
Course: Introduction to AI & Prompt Engineering | AKTU B.Tech First Year | Semester I & II
Course Codes: AAI101 / AAI201
Streams: CSE, EE, ECE, CE, ME, BT, CH, TX & AG
Unit I Overview
These AI and Prompt Engineering Unit 1 Notes explain the definition and scope of artificial intelligence, its historical development, the relationship between AI, machine learning and deep learning, and the ways machines learn from data. The unit also covers data quality, preprocessing, visualization and everyday AI applications.
The content follows the supplied Notes Gallery Unit I PDF. The concepts are introductory: advanced algorithms, detailed neural-network mathematics and prompt-design methods belong to later units. All classroom datasets and systems are illustrative.
Topics Covered
| Topic | Source PDF Pages |
|---|---|
| Definition, scope, AI and automation | 2–3 |
| History: Turing, Dartmouth, neural learning and ChatGPT | 4–8 |
| Narrow, General and Super AI | 9 |
| AI, machine learning and deep learning | 10 |
| Data, patterns, training and inference | 11–12 |
| Supervised learning and a worked case | 13–14 |
| Unsupervised and reinforcement learning; comparison | 15–17 |
| Data types, collection and quality | 18–19 |
| Cleaning, representation, splits and leakage | 20–22 |
| Bar charts, line charts, histograms and scatter plots | 23–24 |
| Daily-use AI applications | 25–26 |
| Engineering applications across nine streams | 27 |
| Five-tool classroom activity | 28 |
| Revision and examination practice | 29–30 |
Learning Outcomes
- Define AI and explain its scope using inputs, tasks and outputs.
- Place major historical milestones in order and explain their significance.
- Distinguish capability categories from learning strategies.
- Explain why machine learning is part of AI and deep learning is part of machine learning.
- Describe features, labels, training, inference and generalization.
- Compare supervised, unsupervised and reinforcement learning through their feedback.
- Identify data-quality problems and suitable preprocessing steps.
- Choose and interpret common data visualizations.
- Analyze daily-use tools and connect AI to engineering applications.
Included in These Notes
Complete topic-wise explanations, comparison tables, worked conceptual cases, 26 numbered source figures, two additional scientist illustration panels, a five-tool activity, revision checks and examination-practice questions. The 28 extracted PNG files follow the article’s Img numbering.
Study Approach
Identify the task. State what the system receives, what it produces and what success means.
Look for feedback. Decide whether the example provides target labels, unlabelled observations or rewards from interaction.
Separate training from use. Fitting a model and using it to make a prediction are different stages.
Check the data. Review quality, representation and whether held-out information has leaked into development.
Revise through examples. Use a diagram, a comparison and one limitation when preparing a longer answer.
Stream and Course Coverage
| Applicable Streams | Semester I Code | Semester II Code | Unit |
|---|---|---|---|
| CSE, EE, ECE, CE, ME, BT, CH, TX and AG | AAI101 | AAI201 | Unit I: Introduction to Artificial Intelligence |
These AI and Prompt Engineering Unit 1 Notes use the common coverage stated in the supplied PDF. For additional unit-wise study resources, visit www.notesgallery.com.
Essential Vocabulary
| Term | Meaning |
|---|---|
| Feature | Input property used by a model |
| Label | Known target outcome in supervised learning |
| Model | Learned or designed representation used for a task |
| Training | Learning or adjusting a model from examples |
| Inference | Using a model to produce an output |
| Generalization | Usefulness on new, relevant examples |
| Preprocessing | Preparing data for analysis or learning |
1.1 What Is Artificial Intelligence?
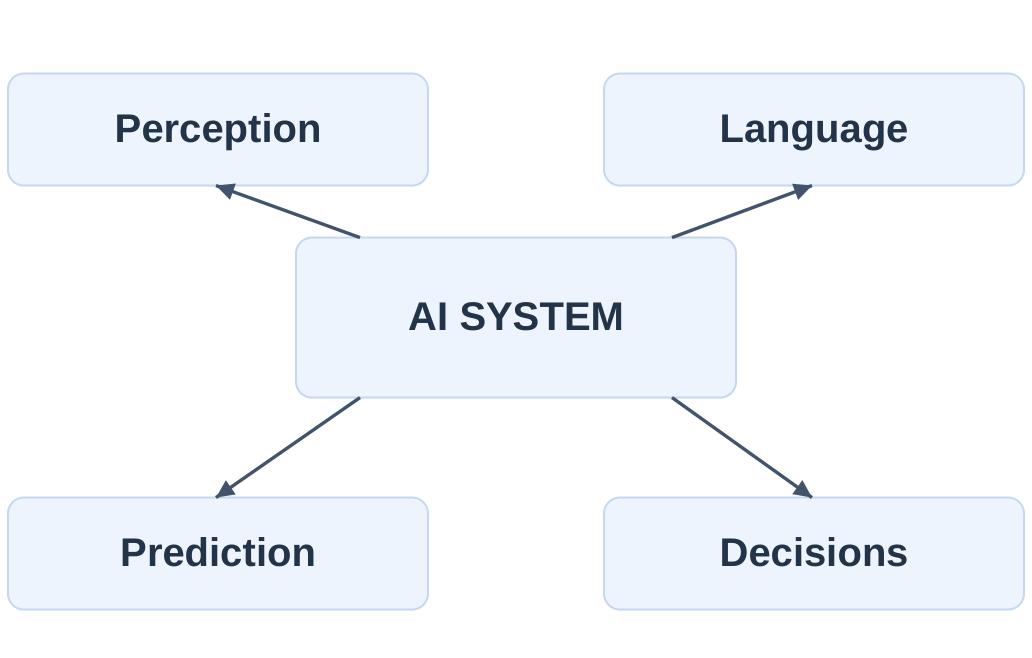
Artificial intelligence (AI) is the field of creating computational systems that perform tasks involving abilities such as perception, reasoning, learning, language use, planning and decision-making. An AI system works toward a specified objective using a designed or learned method.
An engineering description should state what the system receives and produces. A defect detector receives images and produces a defect label or score. A route assistant uses travel-related information and produces an estimated time or suggested route. Neither example needs a human-like body to be AI.
Intelligence in this context is studied through observable capabilities and task performance. A useful output does not establish that a system feels emotions, has consciousness or reasons in exactly the same way as a person.

Exam-ready definition
AI concerns computational methods for tasks such as learning, reasoning, perception and decision-making. Explain it with an input, a task and an output rather than saying only “machines acting like humans.”
Worked Scope Example
A system counts visible vehicles in camera images, then a fixed report adds the counts. Vehicle detection is the perception task; addition is ordinary arithmetic. This distinction lets you describe a mixed workflow without claiming that every line of its software is a learned intelligent component.
1.1.1 Scope and Task Examples
| Capability | Illustrative Task |
|---|---|
| Perception | Recognize an object in an image |
| Language | Interpret or generate text |
| Prediction | Estimate a future reading |
| Reasoning / search | Find a solution satisfying constraints |
| Planning | Choose a sequence of actions |
| Recommendation | Rank items that may be relevant |
A single product may combine several capabilities. A voice assistant can use speech recognition, language interpretation, information retrieval and speech generation. Calling the whole product AI does not mean every component uses the same algorithm.
AI is broader than machine learning. Explicit rules and search can solve some AI tasks without training a statistical model. Conversely, a spreadsheet formula does not become a learned model simply because it processes many rows.
1.1.2 A Useful Description Pattern
Describe a system as input → method → output → check. For a classroom image sorter: a photo is input; a trained classifier is the method; a category is output; a person checks difficult or unfamiliar images.
State the operating context too. A model trained on clear daytime photographs may not work equally well on blurry night images. Its task label remains the same, but the conditions supporting reliable performance have changed.
Worked check
A calculator producing 8 from 5 + 3 follows a direct arithmetic rule. A model identifying a handwritten 8 must deal with many visual forms and uncertainty. Both compute; their task structures differ.
Identify the Output
Predicting that a road segment will take 12 minutes is a numerical estimate. Suggesting route B is a decision or recommendation that can use that estimate. A system may perform both, but checking its time predictions and checking its route constraints require different questions.
1.2 AI, Automation and System Parts
Automation carries out a process with reduced manual effort. It can use fixed rules, learned models or a combination. Automatically switching a lamp at a preset time is automation; a camera-based system recognizing occupancy may include an AI perception component.
Do not equate “automatic” with “learned.” A thermostat following a manually selected threshold does not infer that threshold from examples. A prediction model estimating room demand from historical conditions uses a different mechanism.
An AI-enabled application also needs ordinary software: input validation, storage, user interfaces, access control and reporting. A strong model is only one component of a working system.
| Component | Role in a Defect-Inspection Demo |
|---|---|
| Input collection | Capture a product image |
| Preparation | Resize or normalize consistently |
| Model | Estimate defect category / score |
| Decision rule | Send a low-confidence case for review |
| User interface | Display image and result |
| Monitoring | Record errors and changing conditions |
AI is not the whole workflow
The model may supply a score while a separately designed rule chooses the action. Explain which part is learned and which part is specified by the designer.
When Rules Are Enough
Suppose a classroom task requires converting a temperature using a known formula. A direct calculation is appropriate; training a model to approximate the formula adds an avoidable source of error. Learning becomes useful when the required mapping is uncertain or impractical to specify completely from known rules.
1.2.1 Rule-Based and Data-Based Methods
| Question | Fixed Rule | Learned Model |
|---|---|---|
| Where behavior comes from | Explicit instructions | Patterns fitted from examples |
| Simple illustration | If temperature exceeds 30, print alert | Estimate demand from previous readings |
| Main revision method | Edit the instructions | Retrain or adjust the model |
| Can be wrong? | Yes; rule may be unsuitable | Yes; learned pattern may fail |
A rule-based AI system can use a knowledge base and inference rules. An ordinary fixed threshold is included here to explain automation, not to claim that every conditional statement is itself an AI system.
The distinction is about the source of behavior, not whether code exists. Machine learning is still implemented by software and designed algorithms. Data influences the model’s fitted behavior inside that programmed process.
1.2.2 Human Role
- Define the task and what counts as success.
- Choose and check the data.
- Specify where the system is allowed to operate.
- Inspect errors and decide whether outputs justify actions.
- Maintain the surrounding software and update procedures.
Worked classification
A spreadsheet sorting a column is deterministic automation. A model sorting images by likely object type uses learned perception. A full inspection line may combine both; describe the components separately.
A Mixed-System Trace
A trained model assigns an image a defect score. A designer’s rule sends scores above a chosen threshold for inspection. The score is learned-model output, while the threshold rule determines the next action. Changing the action threshold does not necessarily retrain the image model.
1.3 Origins: Turing and Dartmouth
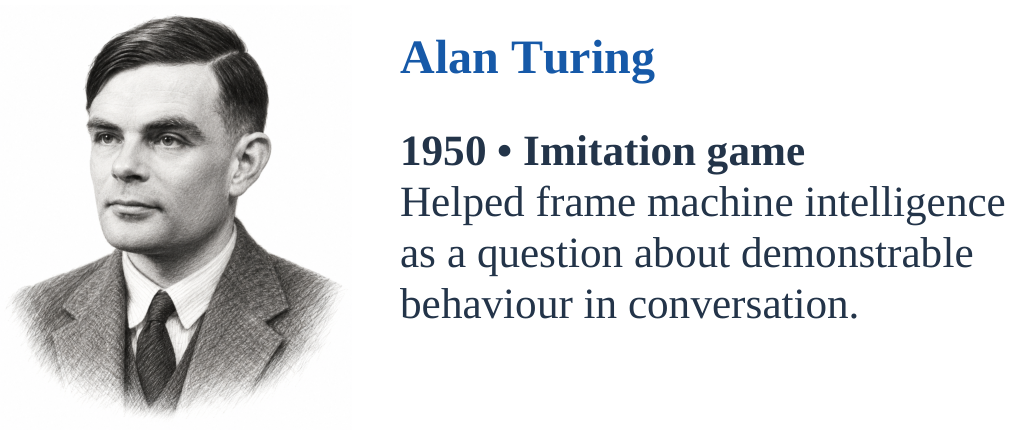
Alan Turing, 1950: In Computing Machinery and Intelligence, Turing examined how one might discuss machine intelligence through observable behavior. His imitation-game argument replaced an ill-defined question with a more operational conversational test.
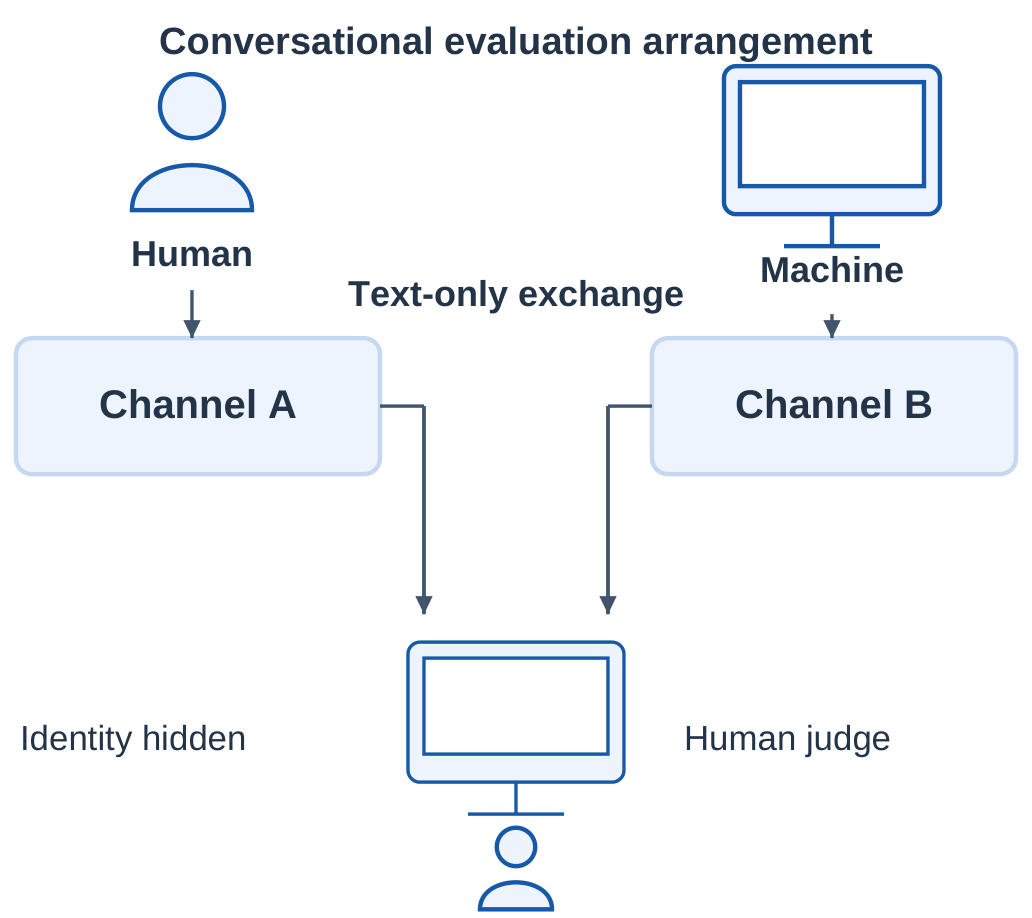
In a simplified modern interpretation, a human judge exchanges text messages with hidden participants and tries to distinguish a person from a machine. Restricting the channel reduces clues from appearance or voice. The illustration explains that arrangement; it is not a claim that a chat test measures every kind of intelligence.

1.3.1 Importance and Limitation
Turing helped focus attention on what a machine can demonstrate in interaction. Convincing conversation, however, does not by itself prove consciousness, physical understanding or reliable reasoning on every task. The significance is the framing of an evaluation problem, not a certificate of universal intelligence.

1.3.2 Dartmouth: 1955–1956
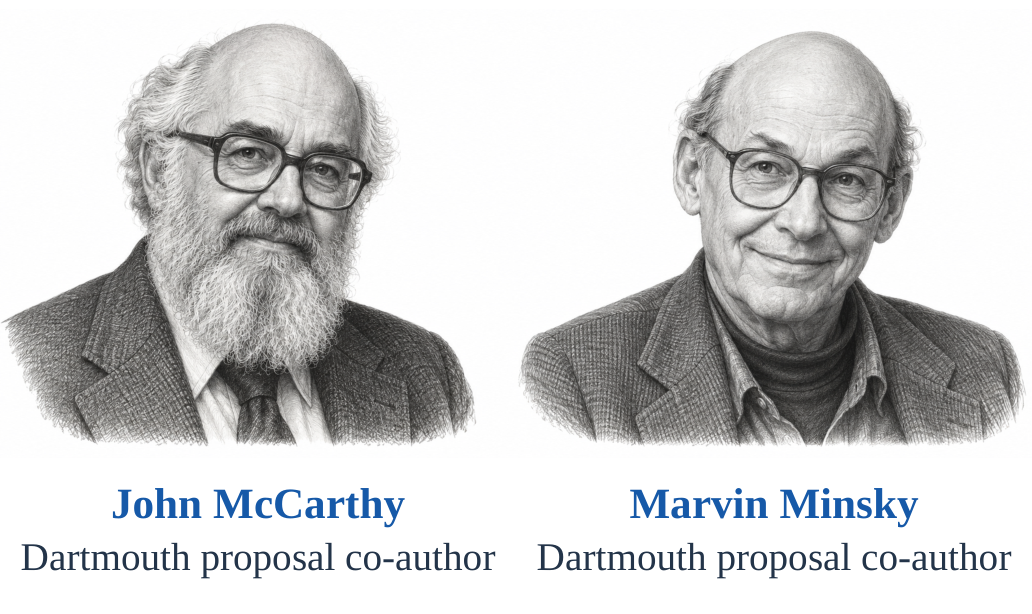
A 1955 proposal by John McCarthy, Marvin Minsky, Nathaniel Rochester and Claude Shannon set out an agenda for the 1956 Dartmouth Summer Research Project on Artificial Intelligence. The project helped establish AI as a named research field.
Researchers explored whether aspects of learning and intelligence could be described precisely enough for machines to simulate them. Language, abstraction, reasoning and learning formed parts of the research ambition. The four names identify the proposal’s authors, not every person who participated.

| Remember | Meaning |
|---|---|
| 1950 | Turing’s paper and imitation-game discussion |
| 1955 | Dartmouth proposal |
| 1956 | Dartmouth summer project |
Why this stage matters
AI began as a broad research program, not a single product. The ambitions covered several capabilities, while the available machines and methods could address only limited tasks.
1.3.3 Symbolic Reasoning and Search
Early AI work often used symbolic representations: explicit objects, facts and relations. A program could search through alternatives, apply rules or construct a sequence of steps toward a goal. This differed from fitting a modern large neural model to enormous datasets.
For a small puzzle, a state describes the current arrangement, an action changes it and a goal test checks whether the task is solved. A search procedure explores possibilities. The number of possibilities can grow rapidly, making efficiency a central challenge.

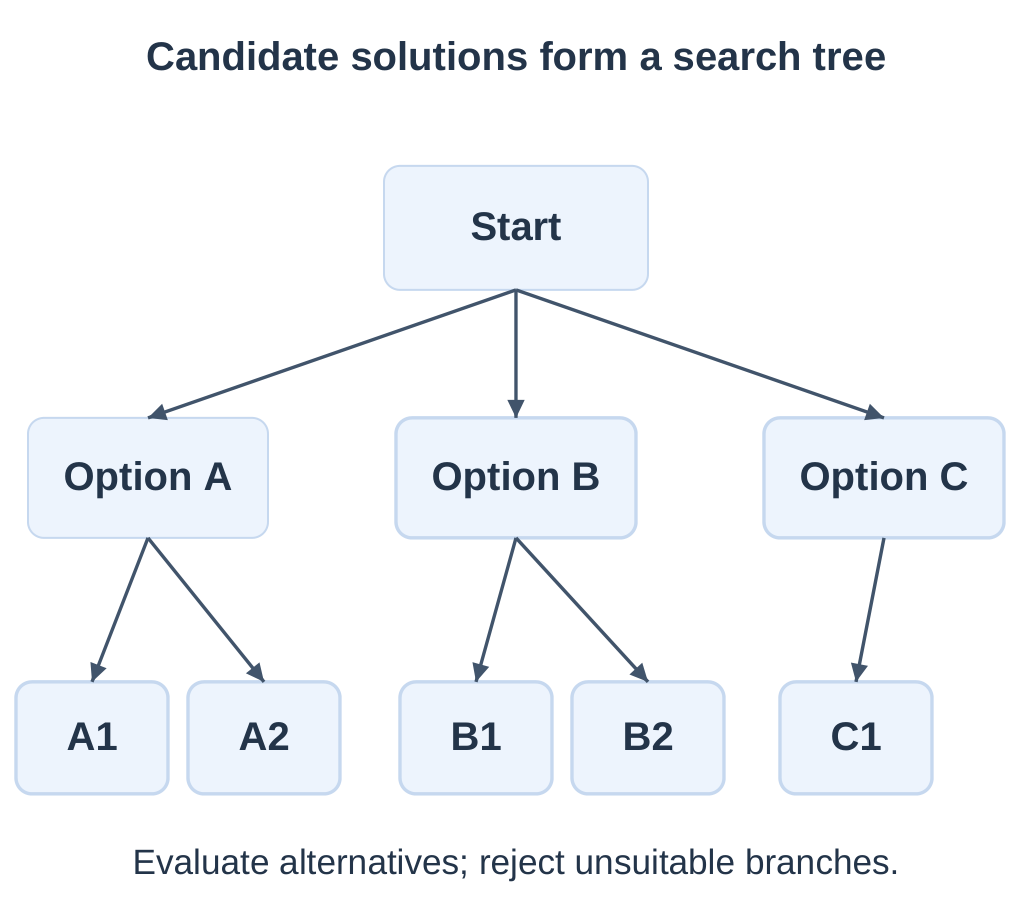
Why Symbolic Methods Mattered
Explicit representations made parts of the reasoning trace inspectable. Designers could see which rule or branch produced a conclusion. Their difficulty was representing enough reliable knowledge and searching effectively when the number of alternatives became large.
Symbolic approaches did not disappear when learning became popular. Search, rules and learned estimates can still cooperate inside one application.
1.3.4 Expert Systems and AI Winters
Expert systems became a prominent direction in the 1970s and 1980s. They encoded specialist knowledge in a knowledge base and used an inference engine to apply that knowledge to a case. Some could provide an explanation trace of the rules used.
Their success depended on a well-defined domain and suitable knowledge. Experts had to communicate rules; developers had to resolve exceptions and maintain the system as practices changed. A large rule set could become expensive to build and revise.

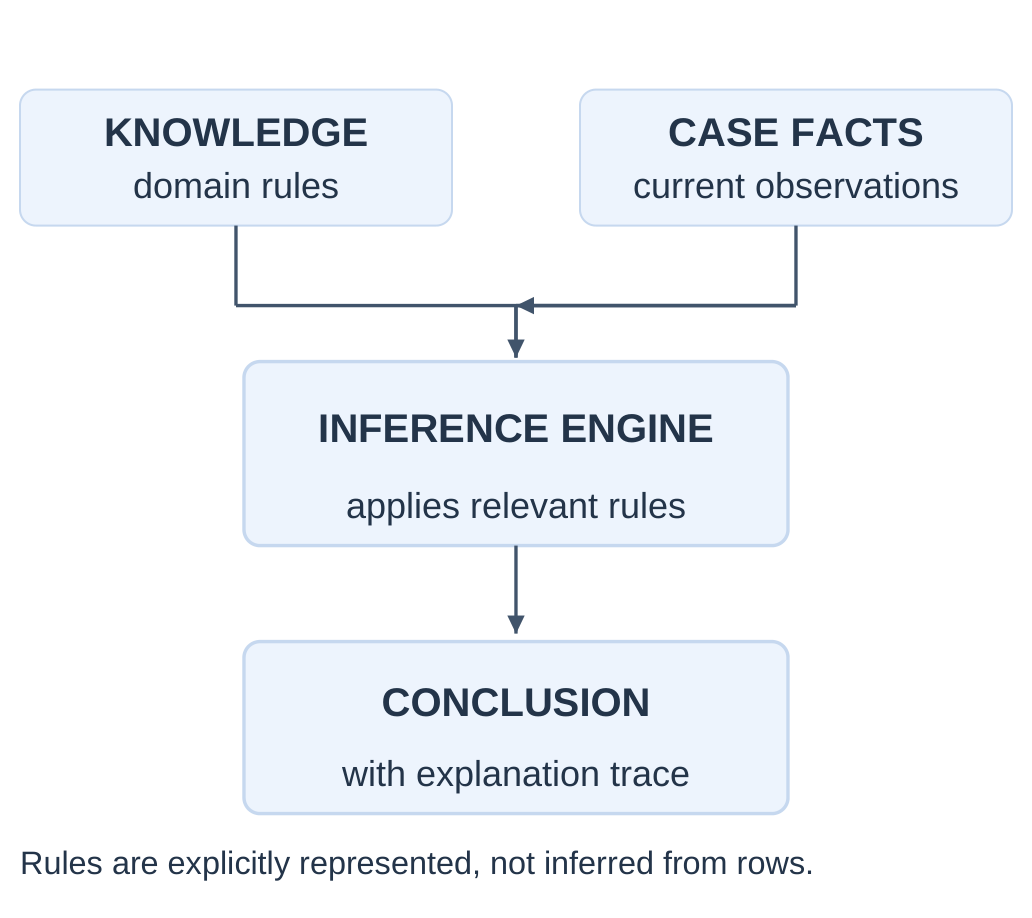
Periods called AI winters involved reduced enthusiasm or support after ambitious expectations exceeded practical results. Limited computing resources, difficult knowledge engineering and unreliable transfer beyond narrow settings contributed to disappointment. There was more than one downturn; the term does not name one universal day when AI research stopped.
Historical lesson
Expectations must match the demonstrated capability. Progress in a constrained problem does not automatically remove the difficulties of a much broader real-world task.
1.3.5 Learning Units and Neural Revival
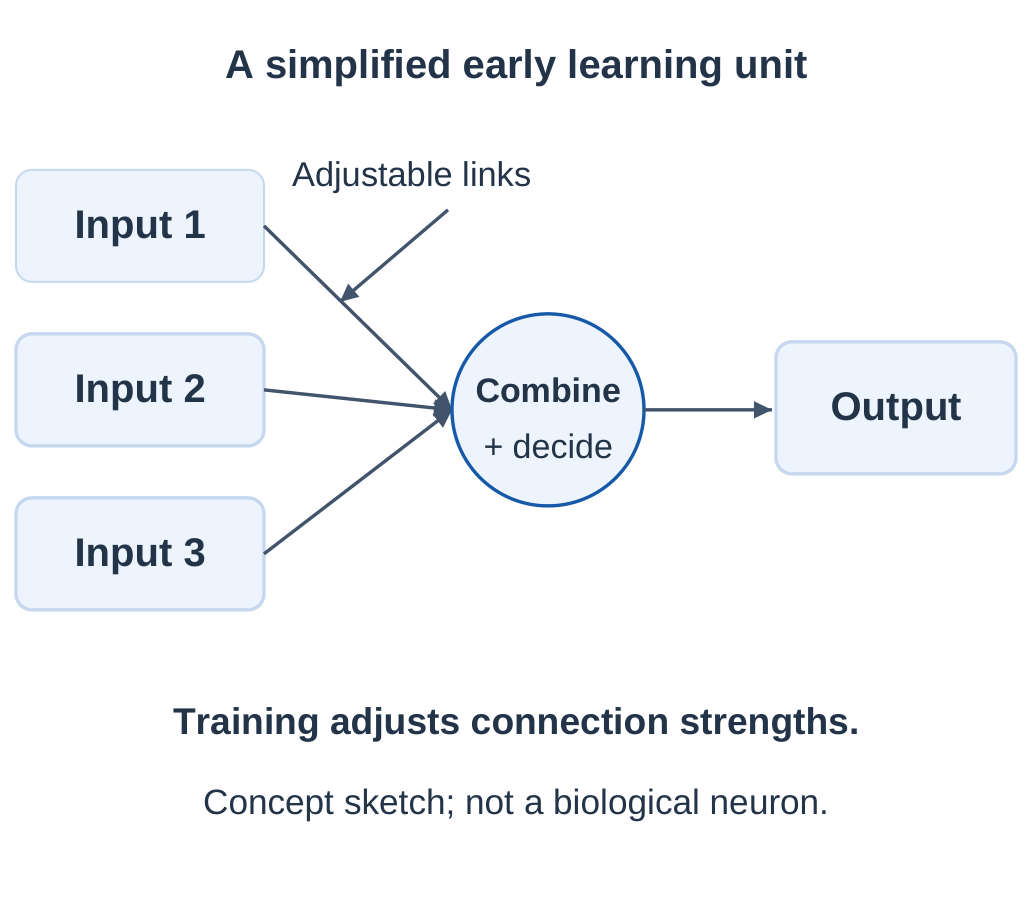
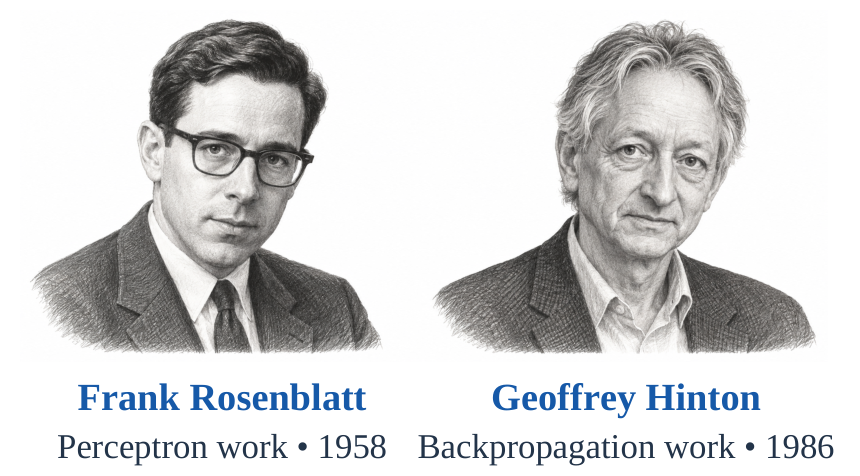
A different research tradition studied learning through adjustable connections. Frank Rosenblatt’s 1958 perceptron work is an important early example. A simple unit combines input signals through adjustable strengths and produces an output decision. It is a mathematical abstraction, not a complete model of a biological brain.
A basic single-layer perceptron has limited representational capacity. Its historical importance lies in showing a trainable connection-based approach, not in solving every pattern-recognition problem.

1986: Backpropagation Becomes Influential
The 1986 paper by David Rumelhart, Geoffrey Hinton and Ronald Williams helped popularize learning internal representations through backpropagation. In conceptual terms, information about output error guides changes to earlier connections in a multilayer network.
Backpropagation was not invented from nothing in 1986; earlier related work existed. The milestone is its influential demonstration and wider adoption. Detailed gradient calculations are outside this introductory unit.

1.3.6 Deep Blue: A Specialized Milestone
In 1997, IBM’s Deep Blue defeated world chess champion Garry Kasparov in a match. Its chess performance relied on specialized computation, search and position evaluation. It was not a deep-learning chatbot or a general-purpose human-level intelligence.
Chess offers explicit rules, legal moves and a well-defined goal. Even in that formal setting, exploring every possible future is impractical, so selective search and evaluation are important. The sketch shows the idea, not the actual historical match position or hardware layout.


| Milestone | What Changed |
|---|---|
| 1958 perceptron | Early trainable connection-based pattern recognition |
| 1986 neural revival | Influential multilayer representation learning |
| 1997 Deep Blue | Striking task-specific search achievement |
Do not confuse approaches
A major AI result need not use the same technique as another result. Deep Blue and later deep neural systems belong in AI history for different technical reasons.
1.4 Deep Learning and Visual Recognition
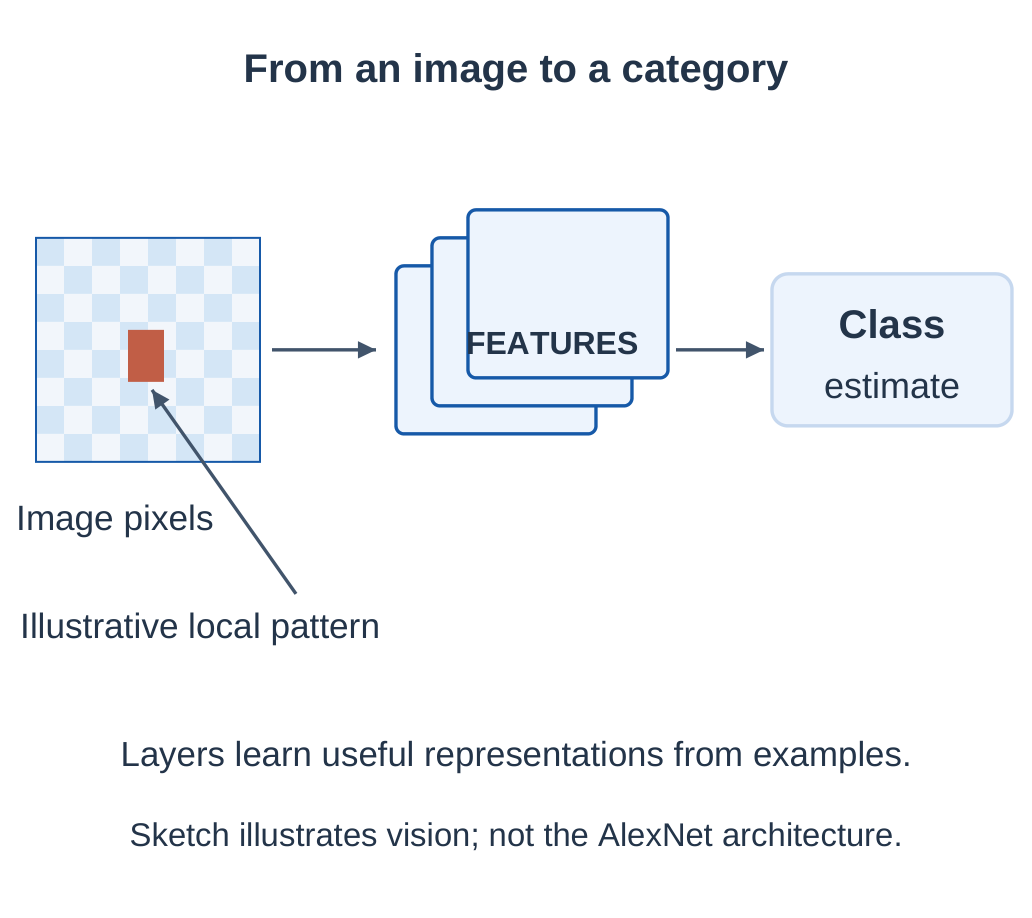
In 2012, the deep convolutional network commonly called AlexNet achieved a major result in ImageNet image classification. Its learned representations helped demonstrate the practical power of deep learning for a demanding visual benchmark.
Rather than relying only on a hand-written rule for every visible pattern, a multilayer model learns numerical representations from training examples. Images, target categories, training procedures and computing resources work together; none alone explains the achievement.

1.4.1 Why the Result Mattered
The result encouraged wider use of deep learning in visual tasks. More data and suitable parallel computation made larger training experiments practical, while improved methods made those resources useful.
An image-classification benchmark tests its specified categories and conditions. Strong performance there does not certify unrestricted visual reasoning, robustness to every camera or recognition of an unseen type of defect.
1.4.2 AlphaGo: Learning with Search
In 2016, AlphaGo defeated Lee Sedol by four games to one. Earlier AlphaGo systems combined deep neural estimates with tree search. A policy component helped identify promising moves; a value component estimated how favorable a position was.
Training involved learned information from games and reinforcement-learning ideas, including self-play. The important point is the combination of methods. The policy does not simply guarantee the winning move, and a value estimate is not a proven final outcome.

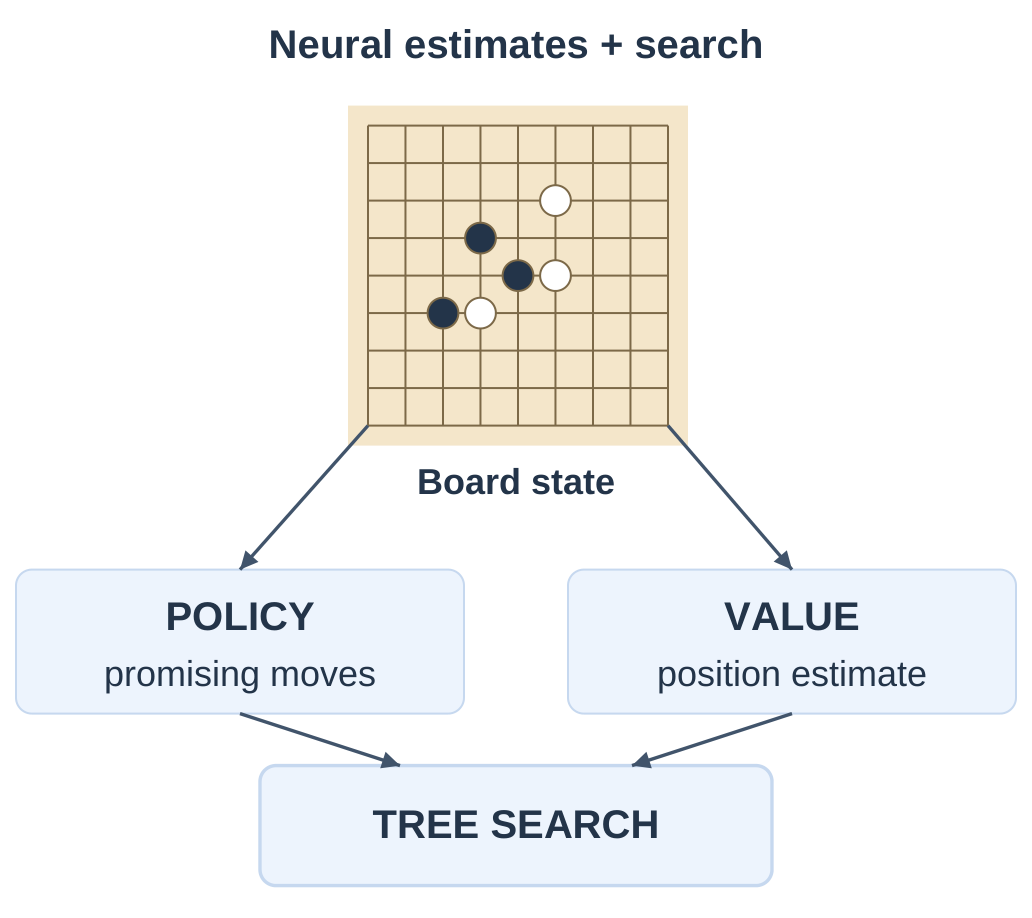
Go’s many possible continuations made effective evaluation and search especially significant. The achievement demonstrated powerful game-playing under formal rules, not automatic transfer to every physical engineering problem.
Do not mix the 2016 match system with every detail of later AlphaGo Zero. Later systems changed aspects of training and architecture. A history answer should name which milestone it is describing.
Compare two game milestones
Deep Blue showed specialized chess search and evaluation; AlphaGo showed a powerful combination of learned neural estimates and search for Go. Both had bounded tasks, despite their broader research impact.
1.4.3 Transformers: The 2017 Milestone
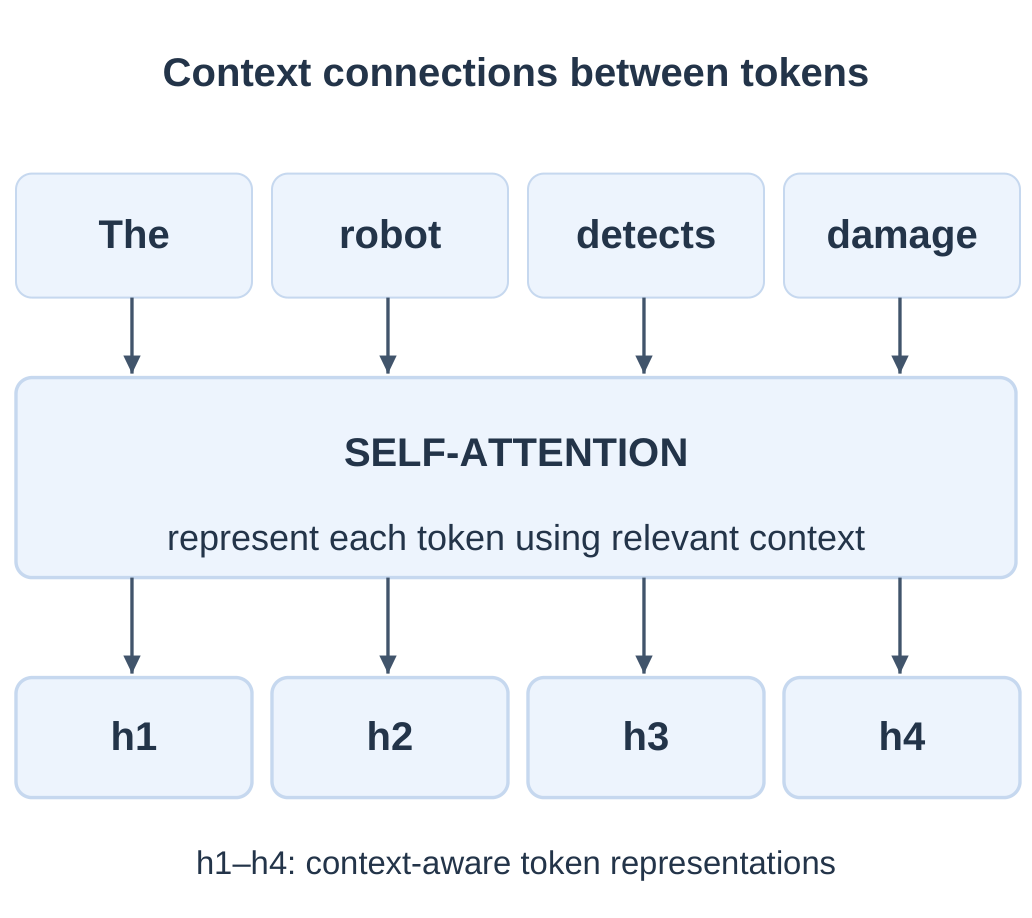
The 2017 paper Attention Is All You Need introduced the Transformer architecture. Its attention-based design made relationships between sequence positions central to processing. This became influential in later language models and other applications.
Conceptually, a token’s representation can incorporate information from relevant context. The same word can have different useful representations in different sentences. Attention is a designed computational operation, not evidence of human-like awareness.

Architecture Versus Application
A Transformer is an architecture family; it is not another name for every chatbot. Data, training objectives, model size and application design also matter. Different systems use attention in different ways.
The historical link is that this architecture supported important later progress in language modeling. This unit needs that connection, not the equations, matrix operations or a full network implementation.
1.4.4 ChatGPT: Public Access in 2022
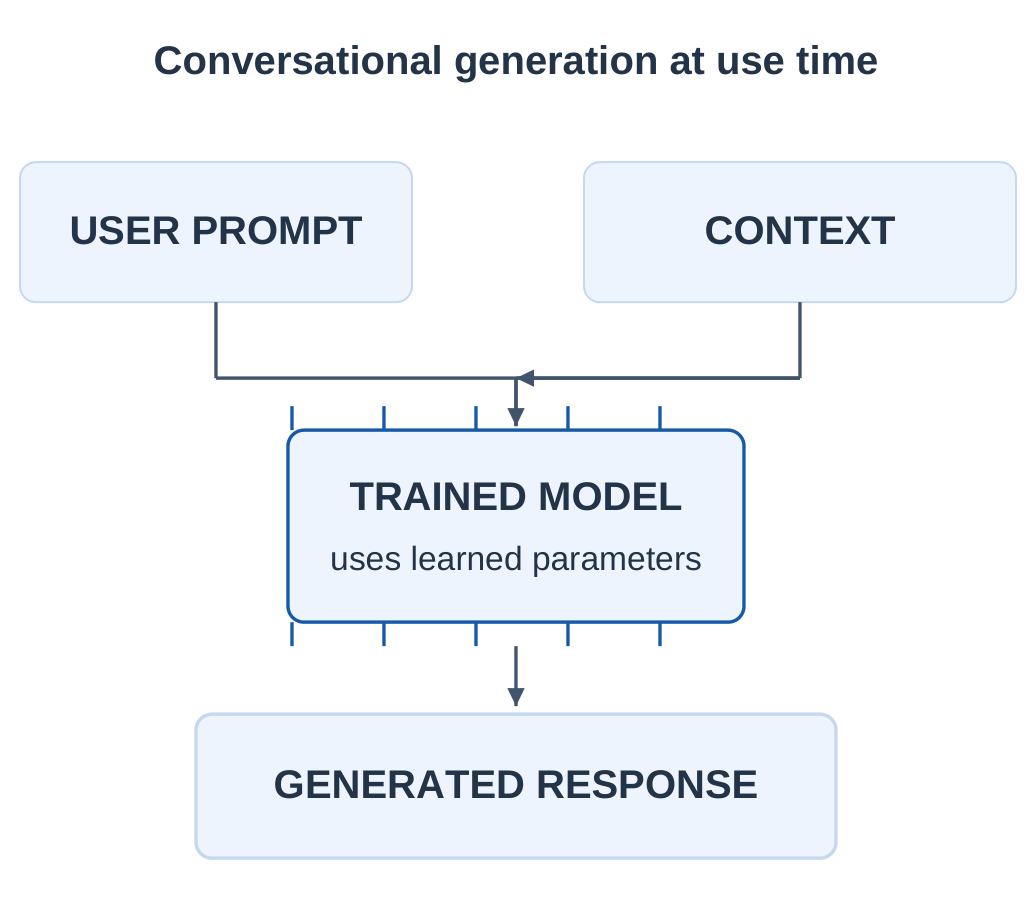
OpenAI publicly introduced ChatGPT on 30 November 2022. A conversational interface made interaction with a trained language model accessible through ordinary requests and follow-up messages. It was an application milestone built on earlier learning and architecture research.
At use time, a trained model processes the supplied prompt and context to generate a response. A new request does not automatically mean its base parameters are retrained. Some applications add retrieval or tools; these should be distinguished from the model’s stored learning.

| Year | Key Idea to Remember |
|---|---|
| 2012 | Learned image representations |
| 2016 | Neural estimates with Go search |
| 2017 | Transformer architecture |
| 2022 | Public conversational access through ChatGPT |
A connected historical account
Explain the progression from evaluating behavior, to explicit reasoning, to learning from examples, to powerful representations and accessible applications. It is a history of interacting approaches, not a claim that each new milestone erased earlier methods.
1.5 Narrow, General and Super AI
These categories describe breadth and level of capability, not the type of training feedback. They should not be mixed up with supervised, unsupervised or reinforcement learning.
Narrow AI is designed or trained for a bounded task or family of tasks, such as image recognition, recommendation or a game. It may exceed human performance on that task while failing outside its operating scope. “Narrow” does not mean trivial or ineffective.
Artificial General Intelligence (AGI) refers to broadly capable intelligence across many cognitive tasks, with definitions and evaluation criteria varying across researchers. It is not defined merely by having a large model, several input modes or an impressive conversation.
Artificial Superintelligence (ASI) is the conceptual category of intelligence exceeding human capability broadly. In introductory study, treat it as a proposed capability level, not a guaranteed product feature or a dated prediction.
| Category | Main Idea |
|---|---|
| Narrow AI | Task-bounded capability |
| General AI | Broad, adaptable cognitive capability |
| Super AI | Broad capability beyond humans |
Use evidence, not a label
A test score establishes performance on that test. A claim of general intelligence needs a stated definition and broader evidence; there is no single universally accepted classroom checklist that settles every claim.
Breadth Versus Speed
A program completing one specialized calculation faster than any person is not general intelligence by that fact alone. Speed, accuracy and breadth are separate properties. The capability categories ask about the range and level of tasks a system can handle, not merely its processing speed.
1.5.1 Compare the Categories
| Criterion | Narrow | General / Super |
|---|---|---|
| Task range | Bounded problem family | Broad capability by definition |
| Example in this unit | Specialized route or defect model | Conceptual capability categories |
| Transfer to unrelated tasks | Not guaranteed | Central to generality |
| Human-like appearance required? | No | Appearance does not define capability |
A system can combine several specialized models and still need substantial human-defined structure. Counting the number of features does not alone establish unrestricted adaptability. Likewise, recognizing text and images is multimodal capability, not by itself proof of AGI.
Avoid forecasting an inevitable timeline for AGI or ASI. Such timelines are outside this syllabus’s conceptual comparison and would require assumptions that a first-year definition does not supply.
1.5.2 Worked Reasoning
A model classifies cloth defects accurately but cannot solve an unrelated planning task. That is evidence of specialized capability. An excellent cloth-inspection result does not become general intelligence because the model runs on a powerful computer.
A conversational system that answers several kinds of questions should be evaluated for reliability, transfer and limitations. Its polished language alone is not a test of consciousness, universal competence or independence from supporting software.
Memory trick
Capability categories answer “how broad and how capable?” Learning strategies answer “what feedback is available during learning?” Keep those two questions separate in an examination answer.
Avoid an Unsupported Forecast
An examination answer can define AGI and ASI without predicting when they will arrive. A forecast requires a separate argument and assumptions. The syllabus’s conceptual comparison is satisfied by explaining breadth, adaptability and the proposed relation to human capability.
1.6 AI, ML and DL: The Relationship
Machine learning (ML) is an approach within AI in which a model’s behavior is fitted or improved using data and a learning procedure. The designer specifies the task and training process, while examples influence the resulting model.
Deep learning (DL) is a family within ML using neural networks with multiple processing layers to learn representations and mappings. The term does not mean that the model necessarily understands a topic deeply in the human sense.
AI is the broad field; ML is one part of it; DL is one part of ML. Therefore every deep-learning example belongs to ML and AI under this relationship, but AI need not be DL and ML need not use a deep neural network.

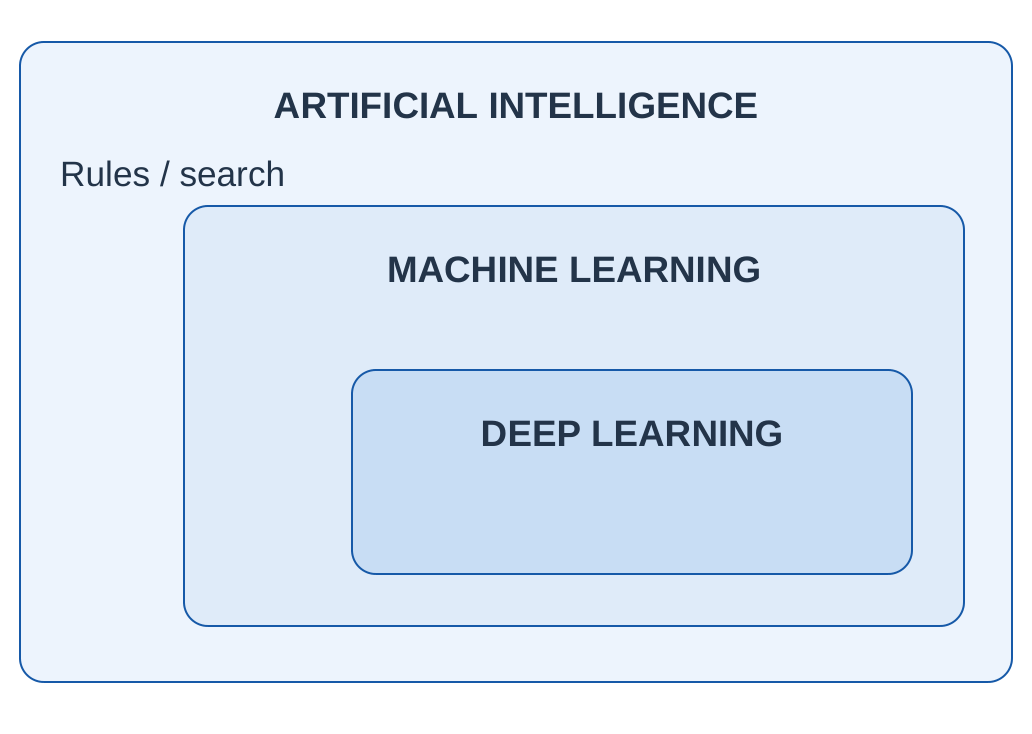
Read the nesting correctly
AI includes methods such as knowledge-based reasoning and search outside the learning subset. ML includes approaches outside deep learning. The diagram expresses conceptual membership, not market size or importance.
Two Non-DL Examples
A knowledge-based system using explicit inference rules can fall within AI without being ML. A simple model fitted to historical numerical examples can be ML without using a deep neural network. These examples demonstrate both gaps in the nesting and explain why the three abbreviations are not synonyms.
1.6.1 Compare the Three Terms
| Term | Focus | Illustration |
|---|---|---|
| AI | Intelligent task performance broadly | Reasoning, search, perception |
| ML | Learn patterns from examples | Predict an outcome from past records |
| DL | Learn using multilayer neural networks | Learn visual representations from images |
A manually specified search strategy can contribute to AI without being learned from a dataset. A fitted numerical predictor can be ML without being a deep network. A multilayer neural image classifier is a DL example.
Do not choose DL just because a project involves many rows. Dataset size, representation, computational resources and the task all affect method selection. A simpler baseline may be easier to check and adequate for the required outcome.
1.6.2 What “Learned Features” Means
For image work, a learning system can derive useful internal representations from pixel patterns rather than relying only on manually written visual rules. Those representations are numerical and task-dependent; they are not a guarantee of human-like meaning.
Deep learning often requires considerable data and computing effort, but there is no universal rule that every DL task needs more data than every other ML task. Prior training and transfer can change the requirements.
Exam check
“All AI is machine learning” is false. “All deep learning is machine learning” is true within the standard nested relationship. Add an example to show that you understand the inclusion rather than memorizing three expansions.
Learning Is Still Designed
A developer chooses an objective, a model family and a preparation procedure. Training then uses data to fit behavior within that setup. The phrase “learns from data” does not mean the system writes its own goal or requires no human engineering decisions.
1.7 How Machines Learn: The Basic Idea
Learning starts with a defined task and examples relevant to that task. A training procedure adjusts a model so that its outputs better match an objective. The model can then use the learned relationships on new inputs.
A feature is an input property made available to the model. For a travel-time task, features might include route length, time period and observed traffic information. A label, when available, is the known target outcome, such as the actual journey duration in a past record.
A pattern is a relationship useful for the task, not necessarily a causal law. Congested conditions may be associated with longer journeys, but the model’s association needs checking across different routes and periods.

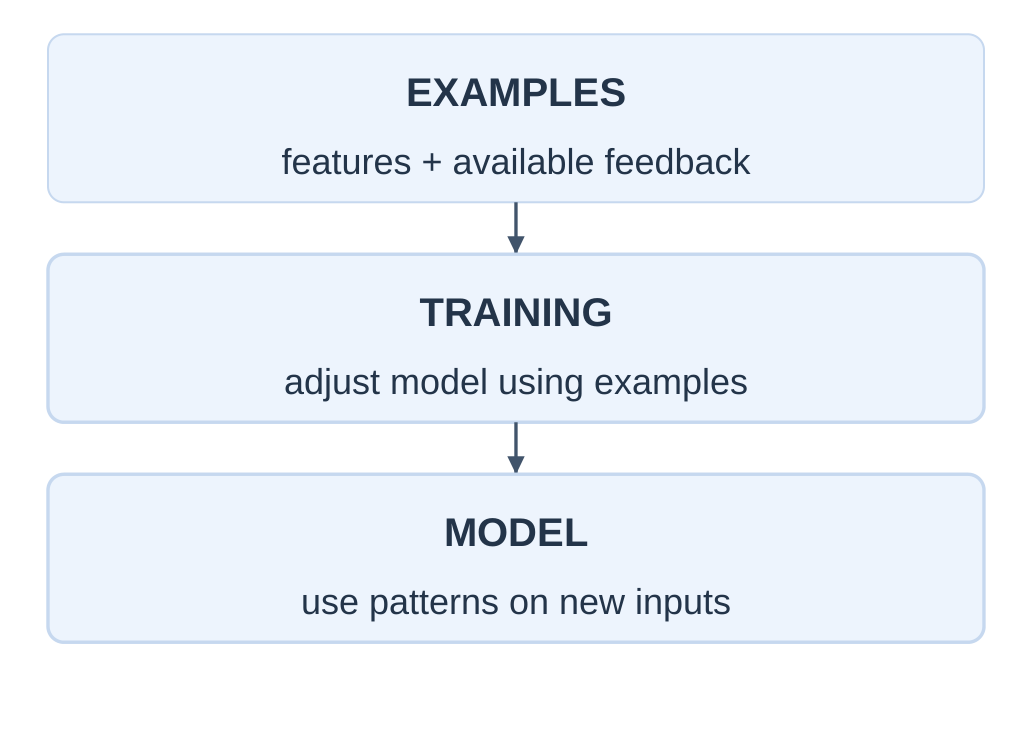
No magic rule discovery
The task, data, representation and learning objective are chosen by people or a designed process. A model does not automatically discover every meaningful law hidden in an arbitrary collection of records.
Match the Time of Prediction
If the goal is predicting tomorrow’s demand, yesterday’s demand can be an available feature. Tomorrow’s final measured demand is the target. A table may contain both, but the column’s availability at the intended prediction time decides whether it is a legitimate input.
1.7.1 A Simple Record Example
| Past Trip | Route Length | Traffic Band | Actual Time |
|---|---|---|---|
| A | 5 km | Low | 12 min |
| B | 5 km | High | 25 min |
| C | 8 km | Low | 18 min |
| D | 8 km | High | 34 min |
Here length and traffic band are example features, while actual time is the supervised target. Four illustrative records help explain the roles; they are far too little evidence to establish a dependable real navigation system.
For a new trip, the model receives the features available at prediction time and estimates a duration. It must not receive the trip’s future actual completion time as an input; that would reveal the answer.
1.7.2 Prediction and Uncertainty
A prediction can be a category, a numerical estimate, a ranking or generated content. Its reliability depends on the task and evidence. A number with many decimal places is not necessarily more accurate than a rounded estimate.
Generalization means performing usefully on new relevant examples rather than merely reproducing the training records. Memorizing every old answer does not establish that the model will handle a different day or machine.
Worked identification
In predicting a fabric defect from a photograph, the image representation is input, the recorded defect category is a possible label, and the predicted category is output. The product serial number may identify a record without being a useful predictive feature.
Memorization Counterexample
A lookup table can reproduce all four old trip durations exactly. If asked about a new route, it may have no useful answer. Perfect agreement on old examples therefore does not establish generalization. A model must be checked on relevant unseen observations rather than rewarded only for recall.
1.8 Training Is Different from Inference
During training, a learning procedure uses examples and an objective to adjust the model. During inference, a model receives an input and produces an output using its current learned behavior. These are different stages even when they appear inside one application.
A model can be trained once and used many times. Receiving a new query does not necessarily update its parameters. A product may record feedback for later improvement, but the recording, retraining and deployment steps must actually exist.
A system can also use fresh information through retrieval or context without training a new model. Adding a current document to a request changes the available input; it is not automatically the same as modifying the model’s learned parameters.

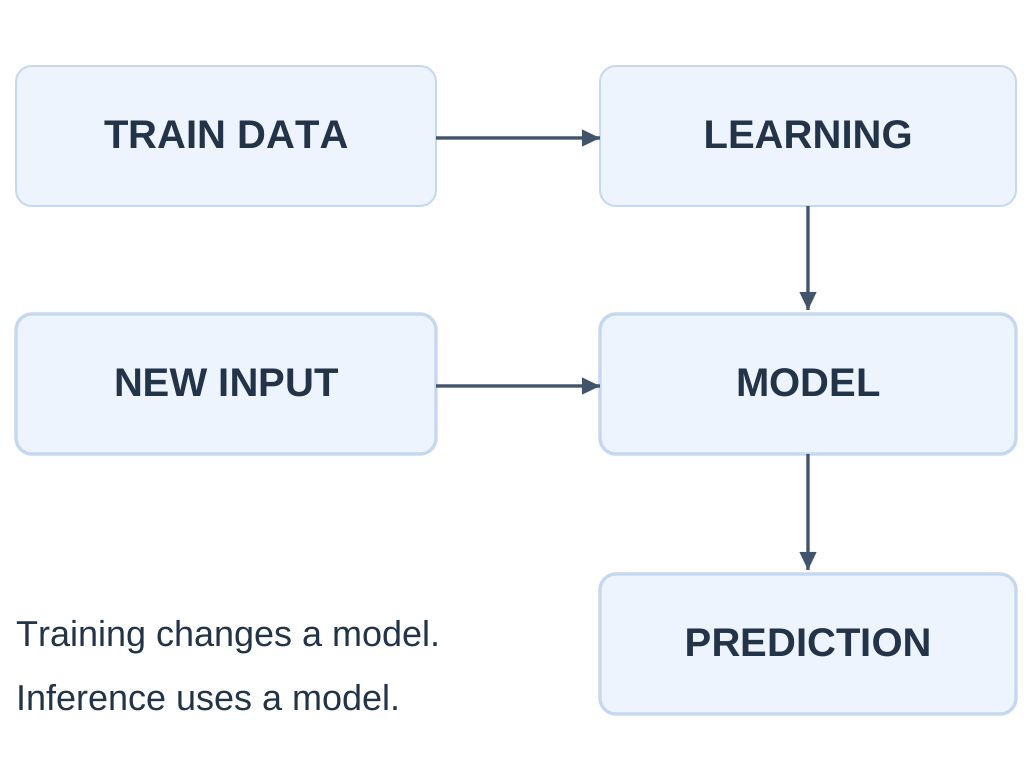
Common misconception
“It learns every time I use it” is not a general rule. Distinguish use, saved feedback, retrieved information and an actual model-update process.
Context Is Not Retraining
Giving a system a new timetable as context can help it answer timetable questions during that interaction. That does not establish that its stored model parameters were updated. The new information may be part of input preparation or retrieval rather than a completed learning-and-deployment cycle.
1.8.1 Generalization and Overfitting
| Behavior | Meaning |
|---|---|
| Fits old examples but fails on new ones | Possible overfitting or mismatch |
| Fails on both simple old and new examples | Model / representation may be inadequate |
| Works on relevant new examples | Evidence supporting generalization |
| Works only on one convenient test set | Limited evidence; broader checks may be needed |
Overfitting means fitting details of the training sample that do not generalize adequately. A model might rely on a background mark accidentally correlated with the label rather than on the intended object.
Distribution change means the new data differ from the conditions represented during development. A camera change, season change or new machine type can alter performance even when the model file is unchanged.
1.8.2 Monitoring and Feedback
- Record outcomes that can reveal model errors.
- Compare performance across relevant conditions.
- Investigate whether the data or task has changed.
- Decide whether retraining, redesign or a simpler rule is appropriate.
- Evaluate an update before replacing the existing system.
Worked reasoning
A deployed model predicts 20 minutes but the journey takes 35. That error is useful feedback. It becomes a training example only if a designed update process collects and uses it; the numerical prediction does not correct itself by observation alone.
Changing Camera Conditions
A defect model may work on sharp images and fail after a camera becomes dirty. Before retraining, inspect the data-collection equipment and image quality. Not every error requires a more complex model; the environment or preparation process may have changed.
1.9 Supervised Learning
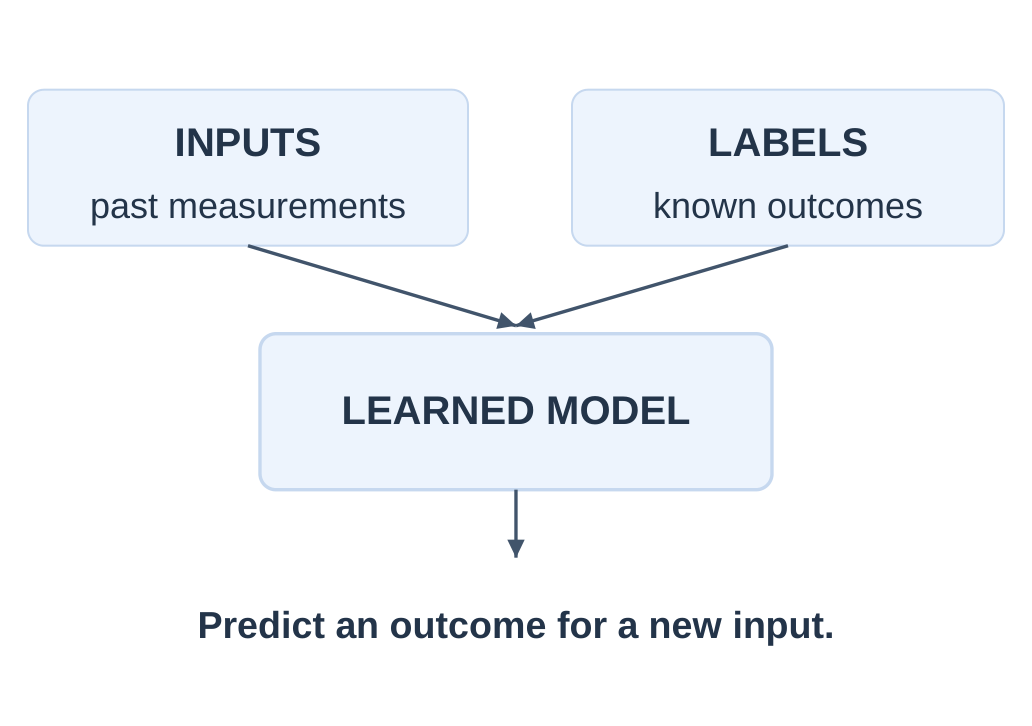
Supervised learning learns from examples containing inputs and known target outcomes. The training procedure compares its outputs with those targets and adjusts the model according to the chosen objective.
“Supervised” refers to the supplied target information. It does not require a person to sit beside the computer during every training step. Labels can come from recorded measurements, a verified event or a human annotation process.
The two main beginner task forms are classification, which predicts a category, and regression, which predicts a numerical quantity. The nature of the target determines the distinction, not whether the input itself contains numbers.

| Task | Target | Form |
|---|---|---|
| Email screening | Spam / not spam | Classification |
| Journey estimation | Duration in minutes | Regression |
| Fabric inspection | Defect category | Classification |
| Energy demand | Power demand value | Regression |
Choose by the Target
Predicting “late / on time” from labelled past trips is classification. Predicting minutes of delay is regression. The same features can support either task, but the target definition changes the output and the appropriate evaluation. Numerical input does not make every task a regression task.
1.9.1 Features Are Not Labels
For email screening, input features may represent the message text and other permitted properties. The known training label indicates whether the message is spam. For a new message, that label is unavailable and is what the model tries to predict.
A numbered class can still be categorical. Labels 0 and 1 for acceptable and defective do not make the task regression. Those numbers encode categories rather than a measured amount.
1.9.2 Why Labels Need Care
- The label must mean the same thing across records.
- Incorrect annotations can teach an incorrect relationship.
- A label recorded after a delay must be matched to the correct input event.
- Rare classes need appropriate representation and evaluation.
- A person’s guess is not automatically a verified ground truth.
| Example | Main Issue |
|---|---|
| “Defect” sometimes means crack, sometimes any mark | Inconsistent definition |
| A temperature copied into the wrong row | Misaligned measurement |
| Only easy acceptable products labelled | Unrepresentative examples |
Solved check
Predicting “machine will fail / will not fail” from historical labelled records is classification. Predicting remaining operating hours is regression. Both can use supervised learning if the required target outcomes are available.
The unit introduces these task types conceptually. Algorithm derivations and detailed evaluation measures are separate topics; a clear description of input, target and new-example behavior is the priority here.
1.10 Worked Supervised-Learning Case
Consider a teaching example of identifying machine-condition categories from vibration and temperature. Past inspections provide the target label normal or needs inspection. The goal is to flag a new example for review, not to replace an engineer’s diagnosis.
The table is deliberately tiny and synthetic. It lets us identify features and labels; it does not justify a deployment threshold, a claim of accuracy or a conclusion about a real machine.
| Record | Vibration | Temp. | Inspection Label |
|---|---|---|---|
| M1 | Low | 45 C | Normal |
| M2 | Low | 48 C | Normal |
| M3 | High | 72 C | Needs inspection |
| M4 | Medium | 66 C | Needs inspection |
1.10.1 Stepwise Explanation
Step 1: Define the classification target.
Step 2: Collect aligned inputs and checked inspection outcomes.
Step 3: Prepare comparable units and representations.
Step 4: Learn a relationship using training examples.
Step 5: Check performance on separate relevant examples.
Step 6: Use a prediction only within the approved review workflow.
Prediction-time availability
The completed inspection report is a training target. If the purpose is to flag a case before inspection, that future report cannot also be an input feature.
Separate Rule from Evidence
From four sample rows, a student proposes “all high vibration means inspect.” That is a candidate rule, not a demonstrated law. Seek other operating conditions and independently checked outcomes before claiming it generalizes. Small teaching tables explain roles; they do not certify engineering decisions.
1.10.2 Examine an Unfamiliar Case
Suppose a new record has medium vibration and 60 C. A trained model may output a predicted category or a score. The small table does not uniquely determine that output, because the learning method and fitted model have not been specified.
Do not invent an exact model answer from a few rows. You can explain which inputs would be supplied and how the result would be checked. If a classroom rule such as “temperature above 65 means review” is introduced, label it a chosen rule rather than a proven trained model.
| Question | Reasoned Answer |
|---|---|
| Are labels supplied? | Yes: past inspection categories |
| Which learning family fits? | Supervised learning |
| Category or amount? | Category: classification |
| Can the four rows establish reliability? | No |
| Who validates the intended use? | The responsible engineering team |
1.10.3 Error Consequences
A missed concern and an unnecessary inspection have different practical consequences. Merely counting all correct outputs can hide an unacceptable type of mistake. Evaluation should reflect what the system is meant to support.
The same reasoning applies to fabric defects, process quality or equipment-condition flags. A good answer states the output’s role and limitation instead of calling every predicted class a confirmed physical diagnosis.
Practice variation
Change the target to tomorrow’s temperature in C. With known past target temperatures, the learning becomes supervised regression. The input variables could remain similar, but the target and evaluation question change.
A Different Target
If the target is the number of hours until a verified event, the output is a numerical quantity rather than a normal/inspection category. The learning remains supervised when past outcomes are available, but the question has changed. Explain the target first and the task label second.
1.11 Unsupervised Learning
Unsupervised learning looks for structure in data without supplied target labels for the training task. The method still has an objective, representation and assumptions; “unsupervised” does not mean no design or no human involvement.
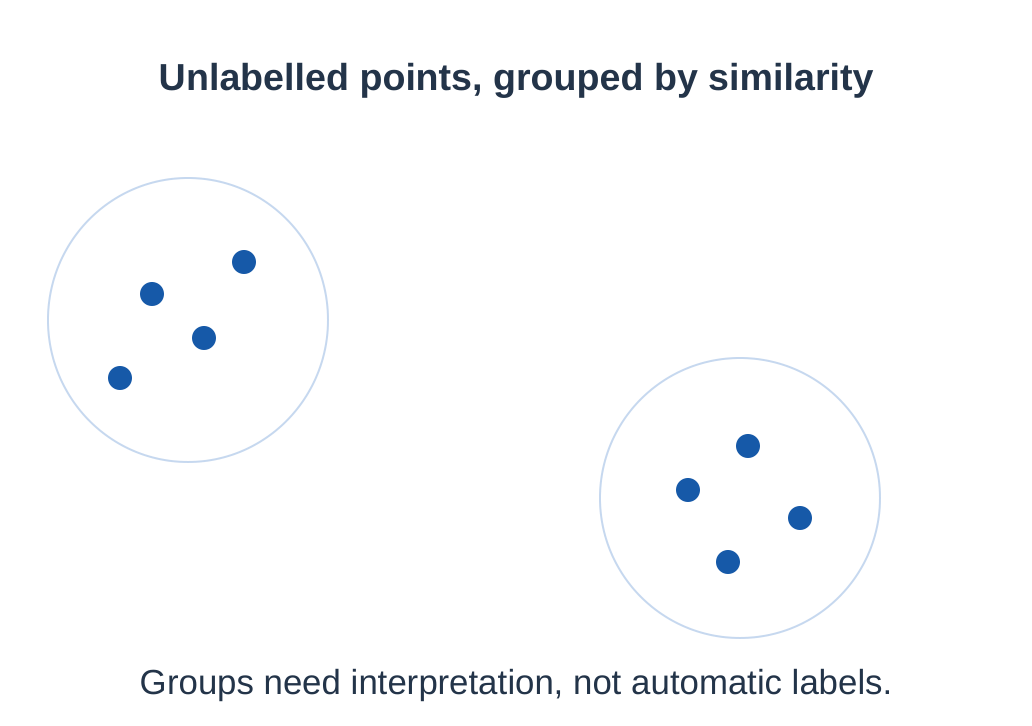
Clustering groups examples according to a chosen notion of similarity. An engineer might group operating patterns or users with similar behavior. The discovered groups are not automatically the correct real-world categories.
Similarity depends on the selected features and their scales. Grouping by temperature and load can produce a different result from grouping by machine age and location. A group name is normally assigned through interpretation afterward.

| Input Situation | Possible Unsupervised Goal |
|---|---|
| Unlabelled operating readings | Find recurring behavior groups |
| Unlabelled usage records | Explore usage segments |
| Product descriptions without categories | Explore similarity or themes |
Groups Need a Meaning
Two clusters of sensor readings may correspond to two operating modes, but they may instead reflect two sensors using different units. Inspect units and metadata before naming them normal and faulty. An unsupervised result reveals a pattern in its representation, not an automatically verified physical explanation.
1.11.1 Structure Is Not a Guaranteed Truth
A cluster may reflect a genuine operating regime, a sensor offset or the way data were collected. Inspect the underlying records before giving it an engineering meaning. The algorithm’s group boundaries follow its inputs and objective.
An unusual observation may be interesting, erroneous or a legitimate rare case. Unsupervised detection of unusual patterns does not establish a fault, fraud or cause without additional evidence.
| Misconception | Correction |
|---|---|
| No labels means no objective | The method still optimizes a defined criterion |
| Clusters arrive with true names | People must interpret the structure |
| Every group equals a real class | Groups depend on representation and method |
| Outlier automatically means error | A rare case may be real |
1.11.2 Association and Exploration
Another broad use is exploring items or events that occur together. A relationship in observations can inform further questions, but it is not proof that one item causes another.
For a first-year answer, contrast the available feedback: supervised learning receives target outcomes; unsupervised learning does not receive those targets for its task. Both can require substantial preparation and evaluation.
Solved check
A dataset contains temperature and load measurements but no normal/fault labels. Grouping similar operating regimes is unsupervised clustering. If verified fault labels are later supplied and the goal becomes predicting them, that is a different supervised task.
Same Data, New Feedback
After an engineer labels selected groups, a later project may train a predictor using those labels. The earlier grouping was unsupervised; the later target-prediction task can be supervised. A project can move through several learning setups without the original terminology becoming incorrect.
1.12 Reinforcement Learning
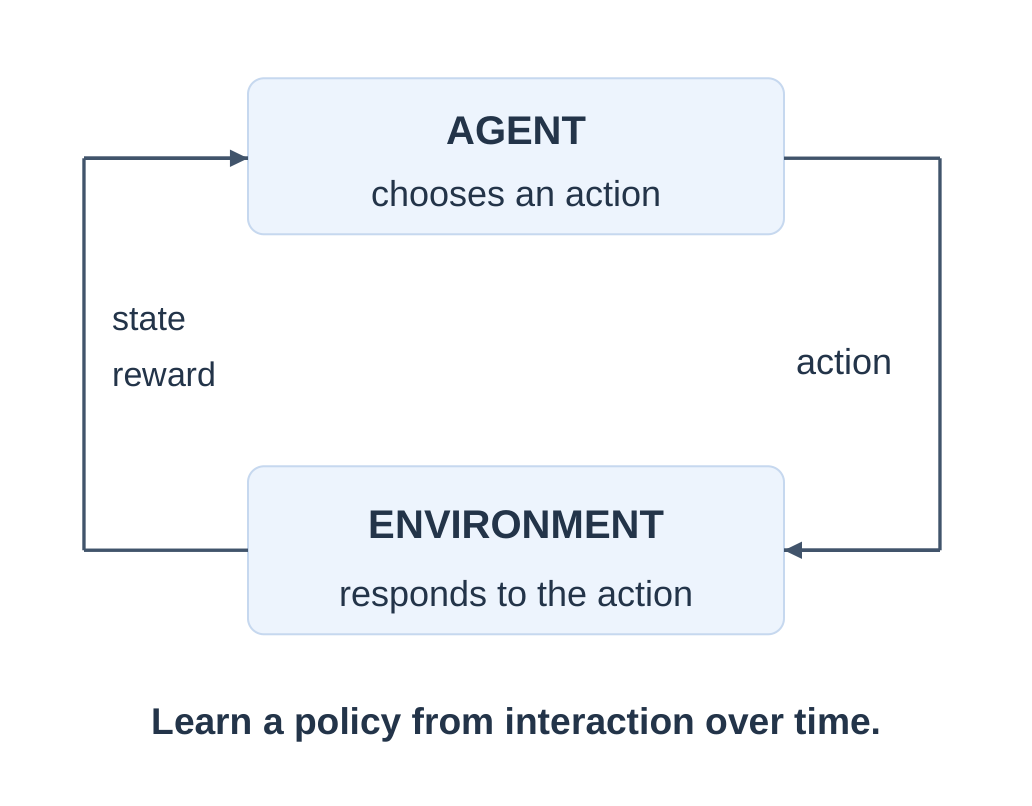
Reinforcement learning (RL) studies an agent learning how to act through interaction with an environment. The agent observes information about the current situation, selects an action and receives a reward signal and subsequent observations.
A policy is the agent’s action-selection behavior. The goal is to improve expected cumulative reward over time, rather than merely match a correct label for every individual input. An action can influence later situations and later opportunities.
Rewards describe the designed objective; they do not automatically represent every human concern. A badly chosen reward can favor unwanted behavior. Real-world exploration also needs constraints; a classroom game is easier to control than a physical process.

Key distinction
A reward says how desirable an outcome was under the designed objective. It is not necessarily a teacher-provided label stating the correct action for every state.
A Delayed-Reward Example
A move away from the goal can be useful if it avoids a wall and enables a shorter complete route. Evaluating each move only by immediate distance can miss that benefit. RL’s sequential objective explains why later consequences matter when learning an action policy.
1.12.1 A Small Navigation Example
| RL Term | Teaching Example |
|---|---|
| Agent | A simulated moving character |
| Environment | A small grid with walls and a goal |
| Observation / state | Current location and relevant surroundings |
| Action | Choose an allowed movement |
| Reward | Designed feedback for reaching the goal or wasting steps |
| Policy | Which movement to choose in each situation |
An agent might try different routes and learn which choices tend to lead to a goal with fewer wasted steps. The feedback can be delayed: a useful early move may not receive its benefit until later.
Exploration tries alternatives to gather information. Exploitation uses what is currently believed to work well. Their balance matters because always repeating a familiar action can miss a better route, while endless experimentation can waste effort.
1.12.2 Reward-Design Check
If reward is given only for moving quickly, the agent may ignore the intended destination or other constraints. A learning system follows its specified objective; it does not infer every unstated requirement.
Some real systems combine RL with other learning methods and planning. Do not label every feedback-based application RL unless its learning setup actually involves action, environment response and reward-driven improvement.
Memory aid
Supervised: examples with target answers. Unsupervised: structure without those target answers. Reinforcement: action, consequence and reward over a sequence of interactions.
Exploration in Context
Trying a different move in a simulated game can provide information at low cost. Trying an untested action on real equipment can have physical consequences. The learning concept stays the same, but an engineering environment needs a controlled, validated way to investigate alternatives.
1.13 Compare the Learning Strategies
Choose a learning strategy from the question and available feedback. The same application area can support more than one task. A factory can predict verified fault labels, cluster unlabelled operating regimes or train an action policy in a simulation.
The industry name does not determine the learning method. “Agriculture uses unsupervised learning” is too broad. Specify whether the task predicts a measured yield, groups field conditions or learns an action sequence from reward.
| Criterion | Supervised | Unsupervised | Reinforcement |
|---|---|---|---|
| Feedback | Known target outcomes | No task target labels | Rewards from interaction |
| Main aim | Predict a target | Find structure | Learn action policy |
| Example | Predict measured yield | Group field patterns | Learn simulated control actions |
1.13.1 Three Questions to Ask
- Is a target outcome attached to past examples?
- If not, is the aim to explore similarity or structure?
- Does the system choose actions that affect future outcomes and receive reward feedback?
Methods can be combined
These are conceptual families, not exclusive labels for every product. A complete application may use several training stages. Identify the stage being described rather than forcing one label onto the entire service.
Insufficient Information
A description says only “AI analyzes farm data.” It does not identify a target, a structure-discovery objective or reward-driven interaction. The learning family is therefore not determined. Ask what is predicted or learned and what feedback is available instead of guessing from the sector.
1.13.2 Solved Scenario Selection
| Scenario | Best Conceptual Description |
|---|---|
| Past messages have spam labels; predict a new one | Supervised classification |
| Past records contain actual travel minutes; estimate another trip | Supervised regression |
| Group unlabelled sensor patterns | Unsupervised clustering |
| A game agent improves action choices from rewards | Reinforcement learning |
| Manually written threshold prints an alert | Fixed-rule automation; not ML by itself |
If a problem does not specify labels, action feedback or the exact goal, the available information may be insufficient to identify one learning family. State the missing detail instead of guessing from a product’s name.
A recommendation problem illustrates this: recorded interactions may support learned prediction, while a sequential recommendation policy could also use reward feedback. A recommendation interface alone does not reveal the internal training method.
1.13.3 A Classification Trap
The word “classification” in an ordinary task description means assigning categories. To justify supervised classification, show that target-labelled examples are available for learning. A hand-built rule can classify cases without being a supervised learned model.
Exam-answer pattern
State the learning family, quote the relevant feedback condition in your own words and explain the expected output. The reason earns more understanding than the label alone.
A Complete Selection Answer
“Supervised classification, because past images have verified defect categories and the goal is to predict a category for a new image” supplies a label and its reason. “It is supervised because a human uses the app” does not identify the relevant training feedback.
1.14 What Counts as Data?
Data are recorded observations, descriptions or measurements represented in a form a system can process. Their meaning depends on the collection method, units, time, context and task. A collection of numbers without this information can be misleading.
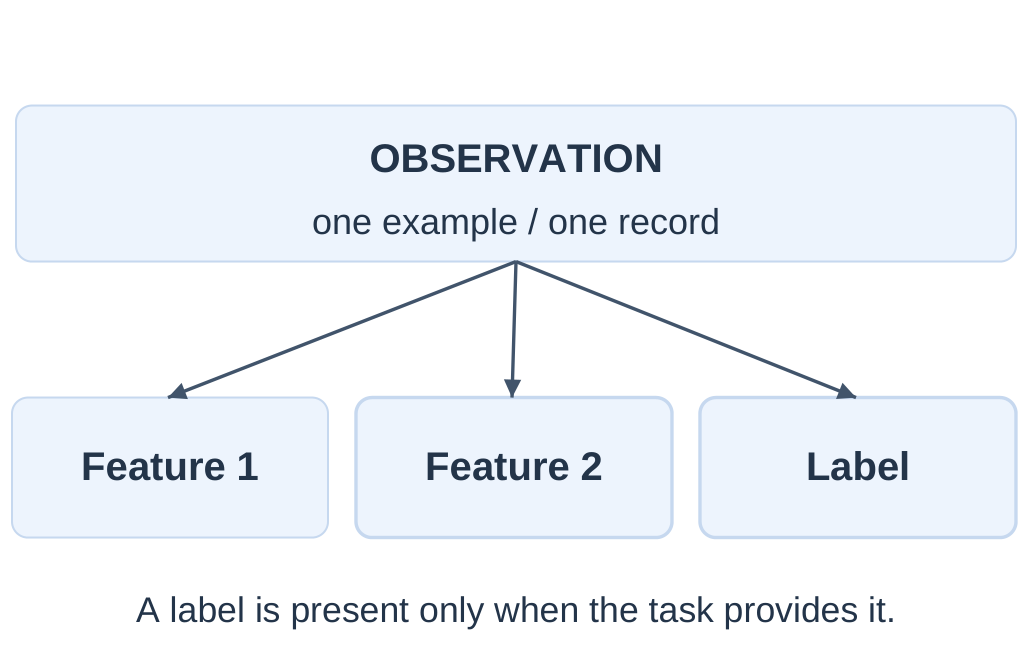
An example is one observation used for a task. In a table, a row commonly represents an example and columns represent properties. In image work, one example may be an image with an associated category. Define the unit of observation before counting examples.
A dataset can include numerical values, categories, text, images, audio or sequences over time. ML systems ultimately need suitable machine-processable representations, but a numeric code does not automatically make the underlying meaning quantitative.

Identifier versus measurement
A roll number, product ID or postal code may contain digits without representing an amount. Arithmetic on such identifiers usually has no useful task meaning.
A Record-Count Check
Ten readings from each of three machines produce thirty measurement records, but only three machine identities. If the goal is testing transfer to a new machine, thirty rows do not necessarily provide thirty independent machine examples. Define the entity and intended generalization before selecting a split.
1.14.1 Main Data Distinctions
| Kind | Example | Important Property |
|---|---|---|
| Numerical | Temperature in C | Quantity with units |
| Categorical | Material type | Group membership |
| Text | Inspection note | Meaning represented in language |
| Image | Cloth photograph | Spatial visual information |
| Audio | Spoken request | Signal over time |
| Time series | Hourly demand | Observation order and timing matter |
Structured data follow an explicit organization, such as rows and fields in a table. Images and free text are often described as unstructured relative to that tabular schema, though they still have internal organization and formats.
Metadata describe the data: a sensor’s unit, collection time or camera setting can determine whether records are comparable. Missing metadata can make an apparently clean dataset unsuitable for a question.
1.14.2 Features and Targets Depend on Task
A temperature may be an input when predicting demand, but a target when predicting tomorrow’s temperature. The column name does not permanently determine its role. The task and prediction time do.
Use only the information available when the intended prediction must be made. A future report may be useful for checking a prediction later without being a legitimate input now.
Worked check
A table has machine ID, current load, current temperature and tomorrow’s failure flag. For predicting that flag now, load and temperature are possible features; the future flag is the label. The ID mainly identifies a record unless a justified representation uses it.
Category or Quantity?
A material code of 101 does not imply twice as much material as code 50. A mass measurement of 100 kg does represent a physical quantity. Both look numerical in a file, but only the latter directly supports arithmetic based on amount.
1.15 Data Collection and Quality
Good data are relevant, accurately recorded, consistently represented and sufficiently representative of the intended use. “More data” helps only when the additional examples contribute useful information rather than repeat the same error.
Start with a collection plan: what is observed, how it is measured, when it is recorded and which conditions are included. A model developed only on convenient daytime samples may fail on the night shift it is expected to support.
A sample can be biased when the collection process systematically leaves out relevant cases. Bias also arises from incorrect labels, unequal measurement quality and proxies that encode unwanted differences. Cleaning a few missing cells does not remove every form of bias.
| Issue | Illustration |
|---|---|
| Missing values | Sensor stopped recording |
| Inconsistent units | Some readings in C, others in F |
| Duplicate records | Same event imported twice |
| Incorrect labels | Good product marked defective |
| Unrepresentative sampling | Only one machine or season |
| Stale data | Old equipment no longer matches current use |
Quality is task-dependent
A blurred image may be unusable for a fine surface crack task but still useful for counting large objects. Assess suitability for the defined question, not a generic clean/dirty label.
Equal Is Not Duplicated
Two different time-stamped readings both show 25 C. They may be legitimate repeated observations. Importing the very same time-stamped event twice is a duplicate under that record definition. Compare identifiers and context before deleting equal values, or you may erase real evidence.
1.15.1 Duplicates and Unusual Values
A repeated number is not necessarily a duplicate record. Two independent measurements can legitimately have the same temperature. A duplicate means the same event or entity occurrence was unintentionally represented more than once under the dataset’s record definition.
An outlier is an observation unusual relative to others or to an expected pattern. It may reveal an error, a new operating condition or an important rare event. Investigate before removing it merely to make a chart look smooth.
1.15.2 Responsible Collection
- Use data that the project is authorized to collect and use.
- Collect only properties relevant to the task.
- Keep private identifiers separate where possible.
- Document collection conditions, known gaps and label definitions.
- Use synthetic or suitably permitted examples for classroom work.
| Question | Why Ask It? |
|---|---|
| Who or what is missing? | Check representation |
| Are values comparable? | Check units and procedure |
| Where did labels come from? | Check reliability |
| What changed over time? | Check future suitability |
Worked scenario
Ten thousand images from one camera angle may teach that viewpoint well while missing every relevant side view. Adding one thousand more from the same angle does not automatically solve the coverage gap.
A useful data-quality report records both the corrections made and the uncertainty that remains. Do not turn an unknown observation into a confident value solely because a complete table is easier to process.
Representation Check
A crop dataset covering only one season may miss conditions required in another. Removing spelling mistakes improves consistency but does not create the absent season’s evidence. Data cleaning and representative sampling solve different problems and may both be required.
1.16 Preprocessing: Checking and Cleaning
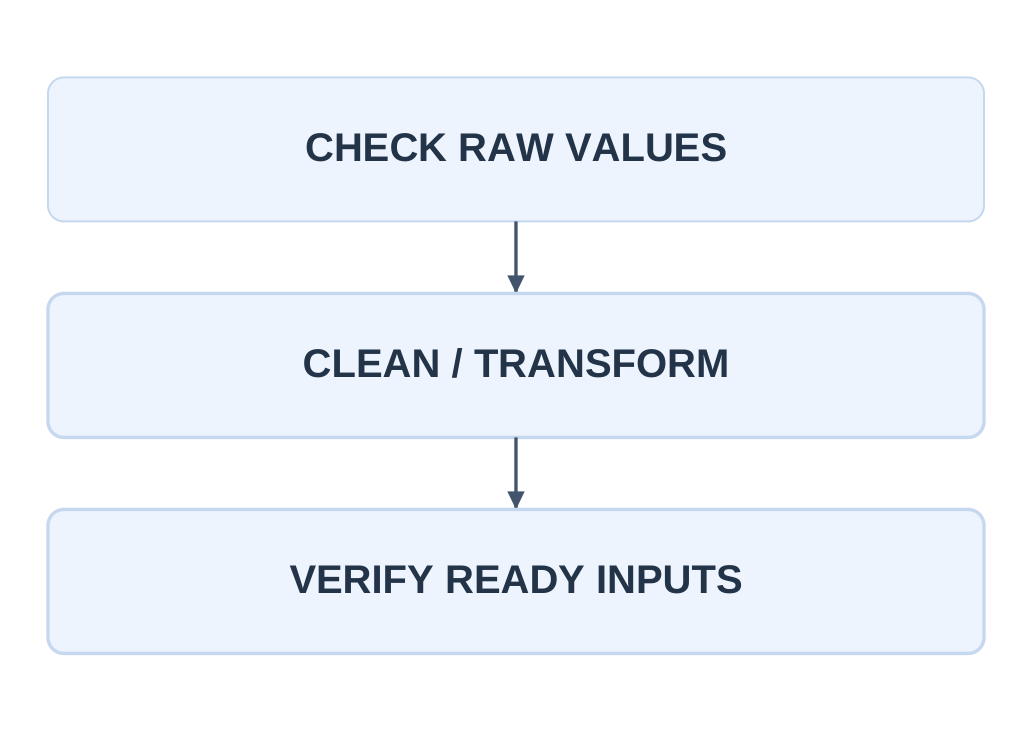
Data preprocessing prepares raw inputs for analysis or learning. It can include validation, handling missing values, correcting representations and constructing suitable features. The appropriate steps depend on the data and method.
Begin with checks rather than immediately editing values. Verify expected fields, types, units, ranges and collection times. Preserve the raw source so that corrections can be traced and reconsidered.
A missing value is not the same as zero. In a temperature dataset, zero may be a real measurement. Replacing a missing cell with zero can introduce a false observation and distort a learned pattern.

| Raw Problem | Possible Action |
|---|---|
| Unit mismatch | Convert using known units |
| Accidental repeated event | Remove verified duplicate |
| Invalid text in numeric field | Flag or correct from a trusted source |
| Missing reading | Use a justified handling policy |
Document a Missing Reading
If the sensor failed at noon, record that cause when known. Replacing the cell with an estimate can make analysis possible, but the estimate should not be reported later as an observed noon measurement. Preserve the distinction between measured values and preparation assumptions.
1.16.1 Handling Missing Data
Possible strategies include collecting the missing information, excluding unsuitable records or estimating a replacement using a justified rule. No single strategy is correct for every dataset. Removing records can bias the sample if missingness is systematic.
Imputation fills missing values using an estimated replacement. A simple summary-based replacement can illustrate the concept, but it is not a recovered true measurement. The uncertainty and method should be documented.
| Policy | Main Trade-Off |
|---|---|
| Investigate / recollect | Better evidence but may require time |
| Remove a record | Loses information and may change representation |
| Estimate a replacement | Keeps a usable record but introduces assumptions |
| Keep a missingness indicator | Preserves the fact that information was absent |
1.16.2 Small Worked Example
A raw log has 25 C, a missing entry and 77 F. Once units are confirmed, 77 F can be represented as 25 C. The missing entry remains unknown until an explicit policy is chosen; it does not become 25 C simply because nearby values match.
After correction, recheck counts and allowed representations. A transformation can introduce mistakes through a wrong conversion factor, a misaligned row or a changed category definition.
Training-data rule
If a replacement value is estimated from data for an ML model, learn that value from the training portion only. Using held-out test information to choose it can contaminate evaluation.
Do Not Erase Rare Events
A high temperature can be the very event a condition-monitoring project needs to recognize. Removing every extreme value as “noise” may remove the target phenomenon. Use the instrument limits, collection record and domain meaning to distinguish errors from important rare cases.
1.17 Preprocessing: Representation
A model needs a representation suited to its method. Raw categories, text or images may require conversion into numerical features. Representation is not merely cosmetic: it changes which relationships a method can detect.
Encoding represents categories in machine-processable form. Arbitrarily numbering material types as 1, 2 and 3 can imply an order or distance that does not exist. A representation should reflect whether the category has a meaningful order.
Scaling changes numerical ranges to make features more suitable for some learning methods. A large-magnitude measurement can otherwise dominate distance-based comparisons even when its units make that magnitude uninformative. Scaling does not add missing evidence.
| Step | Conceptual Purpose |
|---|---|
| Unit standardization | Put comparable quantities in the same units |
| Categorical encoding | Represent group membership appropriately |
| Numerical scaling | Adjust ranges for methods that need it |
| Text preparation | Choose a consistent text representation |
| Image preparation | Use expected dimensions and channel rules |
Not all methods need the same steps
The effect of scaling depends on the learning method. Do not list every preprocessing technique as a compulsory ritual for every AI system.
Encoding Has Semantics
Numbering red, blue and green as 1, 2 and 3 is convenient storage, but a method may interpret their numerical spacing. If no order is intended, use a suitable categorical representation. The fact that a file accepts integers does not establish a meaningful distance between colors.
1.17.1 Feature Construction
Feature construction derives an input from available information. For a timestamp, time of day may be useful when predicting demand. For repeated measurements, a recent trend may be useful if it uses only readings already available at prediction time.
A feature should be relevant and legitimate. The final inspection verdict may strongly correlate with an earlier condition flag because it reveals the target; that makes it a leakage risk rather than a clever new feature.
1.17.2 Consistency at Use Time
The preprocessing used during inference must match the trained model’s expectations. If training used C but new inputs are interpreted as F, the model sees a different numerical meaning. The same issue applies to category mappings and image dimensions.
When a transformation learns parameters from data, retain that fitted transformation and apply it to later inputs. Relearning a new scale separately for every test batch can change the representation unpredictably.
| Example Mistake | Consequence |
|---|---|
| Train in metres; predict in centimetres | Numbers represent different scales |
| Category codes reassigned later | Same code means a different category |
| Model expects one image size | Input may fail or be interpreted incorrectly |
| Remove negation from text carelessly | Meaning such as “not defective” may change |
Worked explanation
A digit in an identifier is not a numerical measurement merely because the model accepts numbers. Explain the semantic role before deciding how to encode it.
A Consistent Conversion
If training converts raw centimetres to metres, later inputs must use the same expected units. Applying the conversion twice changes meaning just as failing to apply it does. Document the raw unit, prepared unit and stage responsible for the change.
1.18 Data Splits and Leakage
A model should be checked on examples not used to fit its behavior. A training set supports fitting; a validation set can support choices during development; a test set provides a separate final check under the chosen evaluation design.
These are roles, not a universal fixed percentage. The correct split depends on the task, sample size, time structure and whether records from the same entity are related. A random row split is not suitable for every problem.
Data leakage occurs when information unavailable in the intended learning or prediction setting improperly influences development or evaluation, making results look more useful than they really are.

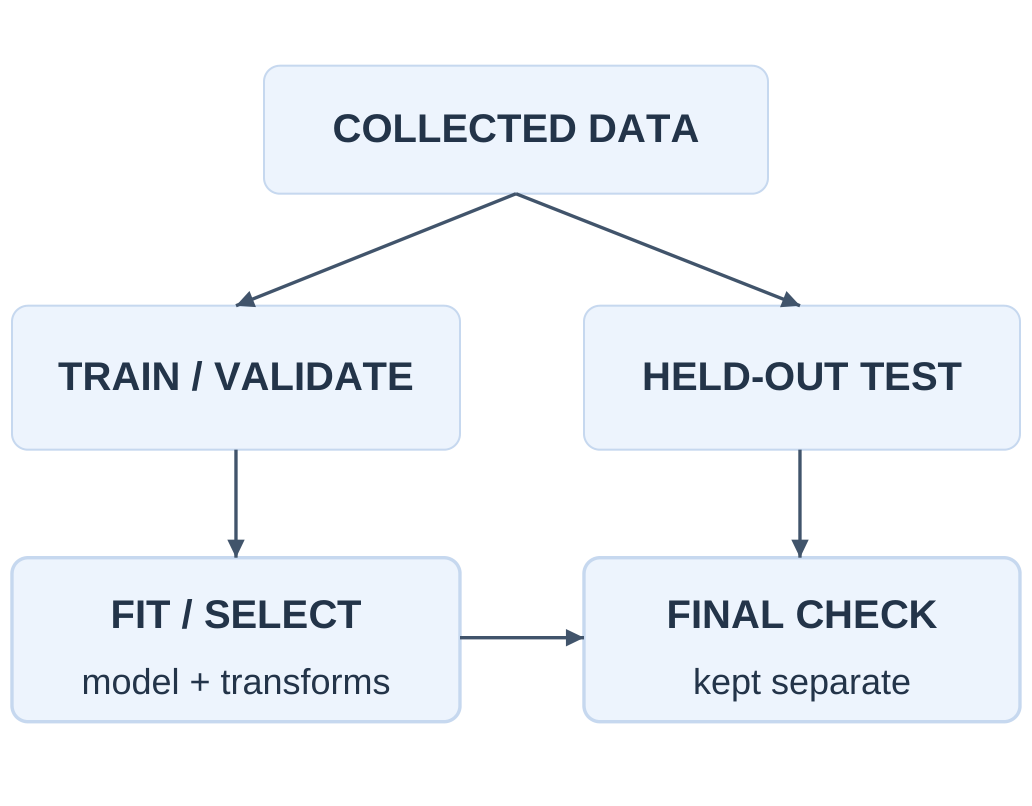
Separation principle
Split appropriately before fitting data-dependent preprocessing. Fit learned replacements or scales using the training data, then apply them to the other portions without learning from their answers.
Keep Related Observations Apart
Several nearly identical frames from one video should not accidentally make a test of new scenes look easier. Decide whether the split needs to group frames by clip or scene. The right unit of separation follows the future-use question rather than a universal random-row recipe.
1.18.1 Leakage Examples
| Situation | Why It Misleads |
|---|---|
| Same photograph duplicated in train and test | The test may reward recognition of an old example |
| Use tomorrow’s fault report as a feature today | Future answer is unavailable at prediction time |
| Choose a model repeatedly from test scores | The test starts influencing development |
| Compute fitted cleaning values from all records | Held-out information enters the fitted process |
For forecasting, preserve the relevant direction of time: development information should precede the future period being predicted. When many records belong to one person or machine, keep related examples together when that matches the intended generalization question.
A strong result on one test set is evidence within that design, not proof of universal reliability. Check whether the evaluation conditions represent the intended use and whether important groups or rare cases are included.
1.18.2 Worked Decision
A student crops each original image into several similar patches, then randomly distributes all patches between train and test. Patches from one image may appear on both sides. A safer design separates original images first, so near-duplicates do not make the test artificially easy.
No mathematics needed
The essential idea is fair separation of learning and checking. Explain who sees which information and when; a long formula is not required to understand leakage.
The Final Check Remains Final
Repeatedly selecting changes after inspecting the test result makes that data part of development. Keep a genuinely separate check for the final chosen process. Otherwise an apparently strong result can partly reflect adaptation to the supposedly unseen examples.
1.19 Data Visualization: Choose a Chart
Data visualization represents observations with visual position, length, shape or other encodings. It helps compare categories, inspect change, find suspicious records and communicate a pattern. A chart supports reasoning; it does not validate the source data automatically.
Use a bar chart to compare quantities across discrete categories. The following synthetic inspection counts belong to batches A, B and C, not to a time series.

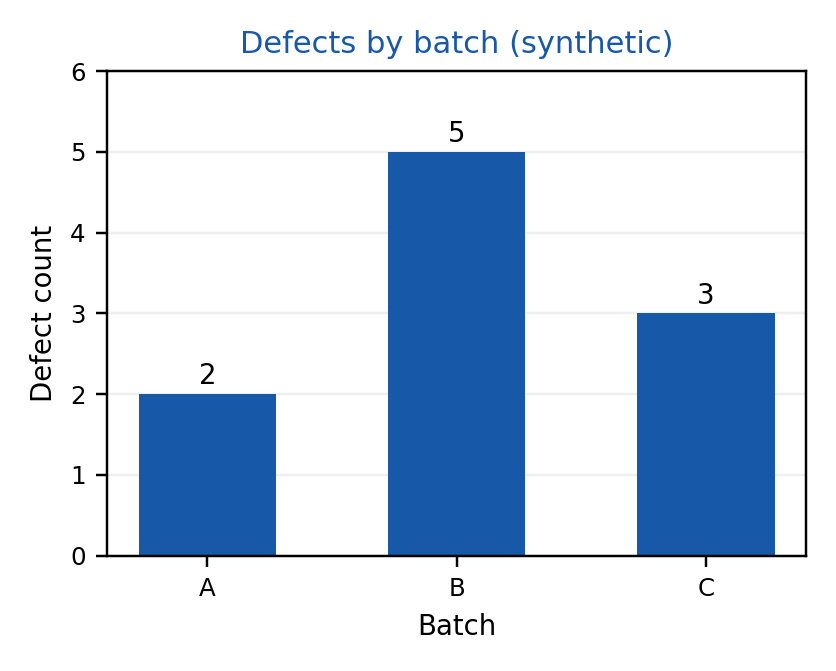
| Chart Choice | Useful Question |
|---|---|
| Bar | Which category has more? |
| Line | How does a value change in order / time? |
| Histogram | How are numerical values distributed? |
| Scatter | How do two numerical variables relate? |
Purpose before decoration
Select the comparison you want readers to make, then choose the chart. An attractive shape is not useful if it hides the variable, units or sample definition.
1.19.1 Line Charts and Ordering
A line chart joins observations in a meaningful sequence, often time. Use a labelled horizontal coordinate and one corresponding vertical value per observation. Joining points does not create new measurements between them.

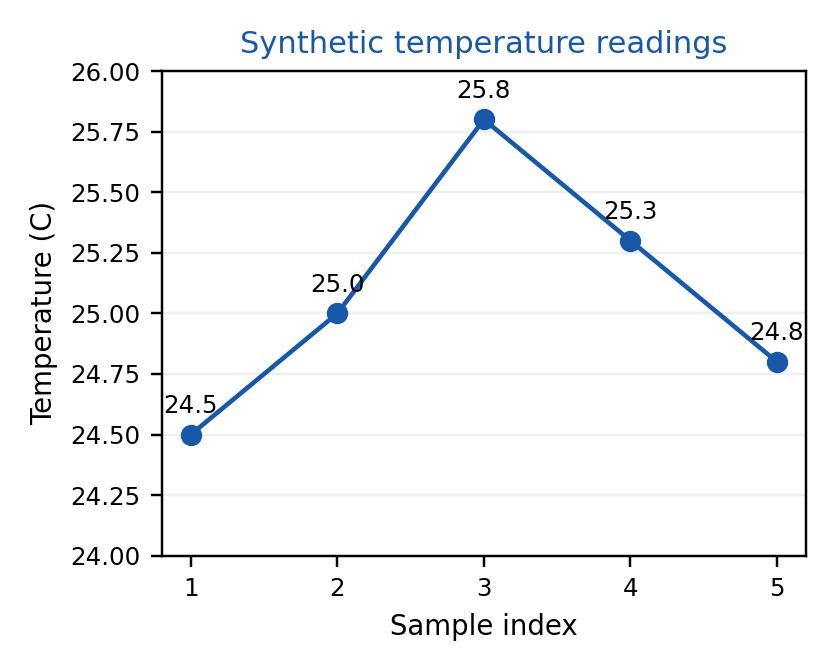
| Sample | Temperature |
|---|---|
| 1 | 24.5 C |
| 2 | 25.0 C |
| 3 | 25.8 C |
| 4 | 25.3 C |
| 5 | 24.8 C |
The line rises to sample 3 and then falls. The vertical scale is deliberately narrow to show variation; read its tick values before judging the apparent size of changes. The graph describes these observations only, not a verified physical cause.
If categories have no natural sequence, a bar or point display may communicate comparison better than a connecting line. A line can imply continuity that the underlying task does not support.
1.20 Distributions and Relationships
A histogram groups numerical values into intervals and displays how many observations fall in each interval. Unlike category bars, its bins represent ranges along one numeric variable. The selected boundaries affect the visible pattern.

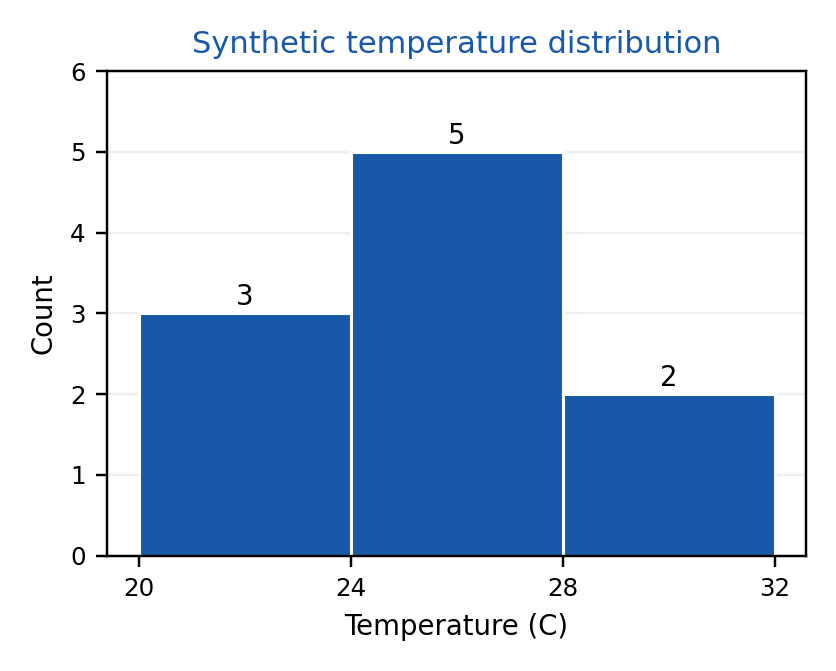
| Bin in C | Included Example Values | Count |
|---|---|---|
| 20 to below 24 | 21, 22, 23 | 3 |
| 24 to below 28 | 24, 25, 25, 26, 27 | 5 |
| 28 to below 32 | 28, 29 | 2 |
The counts sum to ten, matching the number of observations. The bracket notation states that the lower endpoint is included and the upper endpoint excluded in the displayed bins. Those example values avoid the final endpoint convention.
A histogram can reveal concentration or gaps, but a tiny synthetic dataset cannot establish the distribution of a real engineering process.
Bar versus histogram
Bars compare separate categories; histogram bins summarize a numerical distribution. Their visual similarity does not make the underlying questions identical.
1.20.1 Scatter Plots
A scatter plot shows pairs of numerical values. Each point represents one observation with an x coordinate and a y coordinate. It helps inspect association, clusters and unusual pairs without requiring a fitted model.

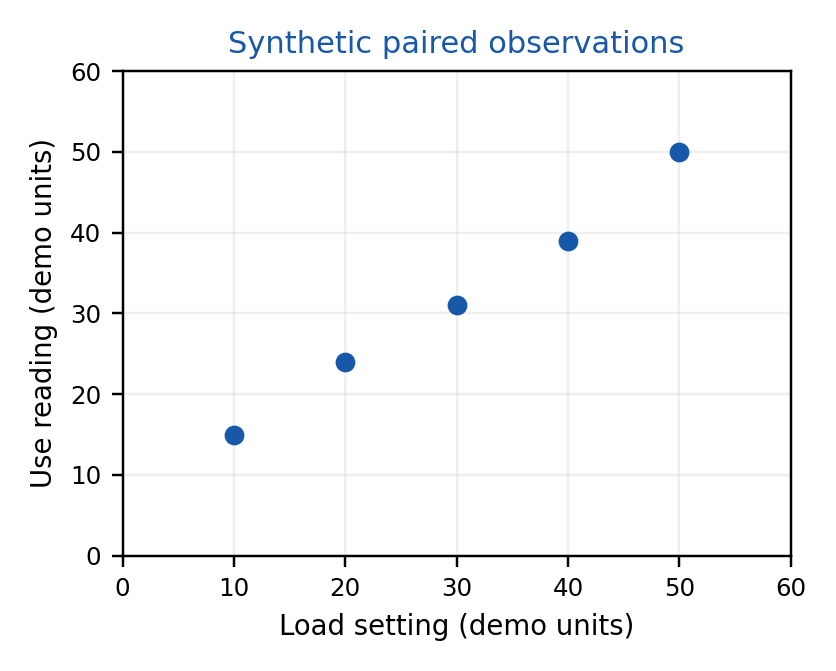
The example x values are load settings [10, 20, 30, 40, 50] and y values are measured-use examples [15, 24, 31, 39, 50]. Both axes use arbitrary demonstration units. A change in one may coincide with another because of a shared cause or collection procedure.
Correlation or association is not causation. A scatter pattern can motivate further investigation, but an experiment or justified causal analysis is needed for a causal claim.
1.20.2 Read Every Chart Critically
- Check title, axes, units and included observations.
- Look at the zero point, scale and any missing interval.
- Ask whether values were rounded, filtered or aggregated.
- Separate what is plotted from an inferred explanation.
Solved check
To show how ten temperatures are spread, choose a histogram. To compare three batch defect counts, choose bars. To compare paired load and use readings, choose a scatter plot.
1.21 AI in Daily Life: Routes and Media
Everyday services illustrate several different AI tasks. A familiar product may combine machine learning, search, explicit constraints and conventional software. Its visible output is useful evidence about the task, but it does not expose its entire proprietary implementation.
Google Maps uses traffic-related predictions to support travel estimates and routing. Historical patterns and current road conditions can help estimate future conditions. An estimated arrival time is a prediction rather than a guarantee.
A route decision also depends on constraints and the map network. Predicting a travel time and finding a route are related but distinct subproblems. Calling both AI without separating them hides the design questions.
| Route-System Part | Concept |
|---|---|
| Estimate road conditions | Prediction from relevant information |
| Compare possible paths | Search / routing |
| Respect closures or restrictions | Constraints and current information |
| Display estimated arrival | Communicate an uncertain result |
Worked question
If a journey estimate changes after congestion increases, that shows an updated input or prediction. It does not prove the model retrained itself during that particular trip.
When describing a daily-use service, use only signals that are relevant and permitted. Do not assume it has access to every private detail of a person’s life. Product behavior, available features and settings can differ.
Ranking Is Not Certainty
A recommendation list orders candidates according to an objective and available signals. The first item can still be unwanted. An individual user response provides feedback, but it does not establish that every relevant preference or context was captured by the ranking model.
1.21.1 Spotify and Netflix
Spotify uses AI and ML for functions including recommendations and search. Netflix uses a recommendation system to help users find relevant titles. These systems rank possibilities rather than prove which choice a person will enjoy.
A conceptual recommendation model can use interaction history and information about items to estimate relevance. Examples of interaction signals include selecting, watching or listening, though the exact system and signal use vary by service and context.

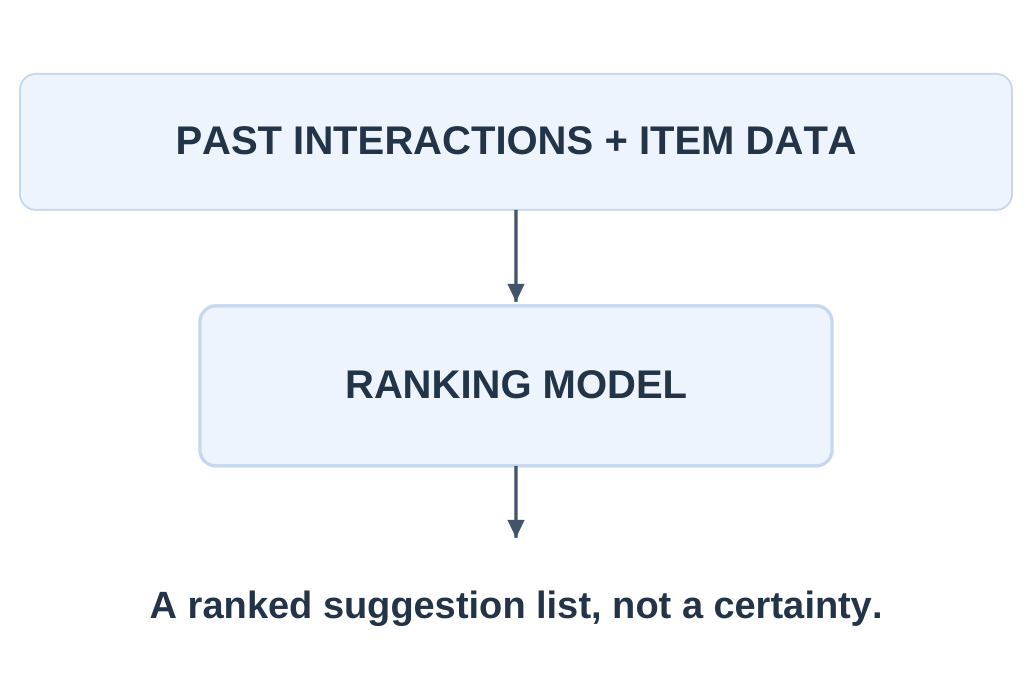
| Question | Conceptual Answer |
|---|---|
| What is the input? | Relevant interaction and content information |
| What is the output? | Ranked candidate items |
| Is every suggestion correct? | No; preferences and context can change |
| Does one click reveal a permanent preference? | No; behavior is an imperfect signal |
Recommendations may favor familiar material if the system optimizes only repeated engagement. Diversity, discovery and other design objectives can change the ranking. An observed click is evidence of an interaction, not a complete explanation of a person’s intent.
Do not overclaim the algorithm
A recommendation interface alone does not tell you whether a particular component uses supervised prediction, a sequential reward method or another technique. Distinguish the conceptual task from an unsupported implementation claim.
1.22 Photos, Voice and Conversation
Google Photos provides examples of AI-assisted visual organization and search. Recognizing visual content or grouping similar faces involves image representations and comparison. Availability and settings can affect the exact feature a person sees.
Face grouping is not the same as perfect identification. Similar appearances, image quality, viewpoint and unfamiliar conditions can cause mistakes. A user-assigned name is separate from the underlying grouping process.
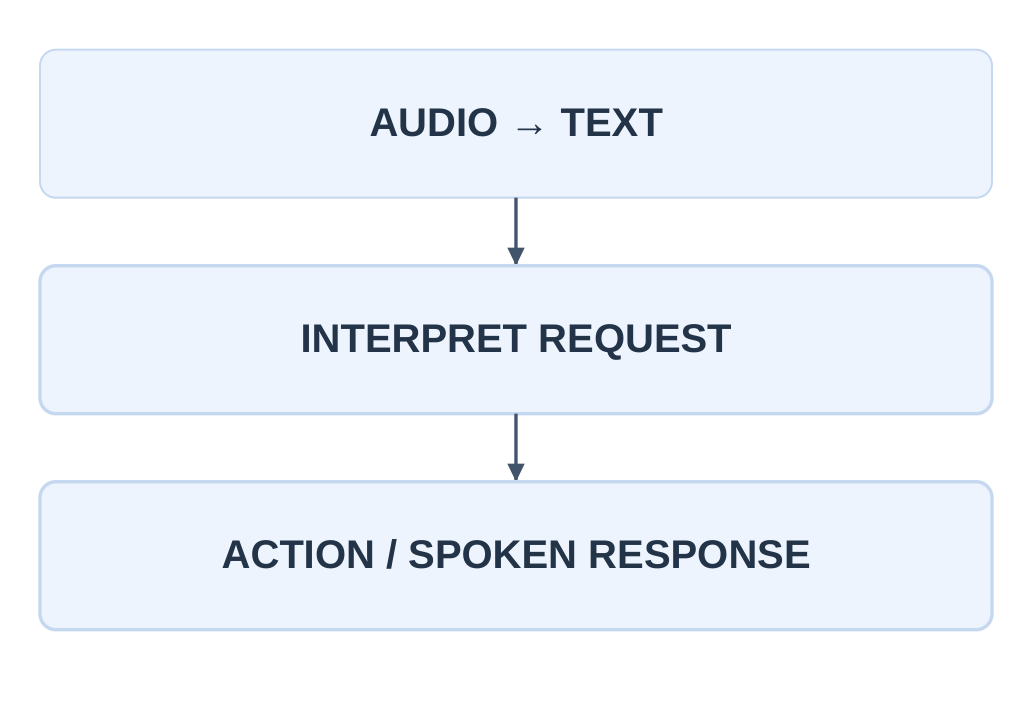
A voice assistant may combine speech recognition, interpretation of a request, information retrieval or action selection, and speech generation. These steps have different inputs, outputs and possible errors.

Locate the error
If the system hears “fifteen” as “fifty,” the problem may arise in speech recognition before later language processing. A fluent spoken response does not show that the original words were correctly understood.
Trace a Voice Failure
A spoken request is mis-transcribed, then correctly interpreted according to that wrong text. The final action can be incorrect even if the language stage behaved consistently. Trace intermediate representations to locate the failure instead of treating the whole assistant as one unexplained intelligent box.
1.22.1 Conversational Generative AI
A conversational language-model system generates a response from learned relationships and the provided context. Some applications also retrieve information or use external tools. Those additional sources should be distinguished from what the model learned during training.
The response can be useful for drafting or explanation while still containing incorrect facts, invented details or inconsistent reasoning. Check important claims against suitable evidence instead of judging truth from confident wording.
| Task | Input | Output |
|---|---|---|
| Photo content search | Image collection and query | Relevant images / matches |
| Speech recognition | Audio | Text transcription |
| Request interpretation | Text and context | Interpreted intent |
| Text generation | Prompt and context | Generated response |
1.22.2 Learning Claims Need Evidence
A corrected transcription, a conversation reply or a user label may be stored or used as feedback depending on the service’s design and settings. Do not claim every interaction immediately changes the base model.
Likewise, a chatbot can produce text without conducting a fresh web search. Whether retrieval or browsing occurred depends on the actual application and action. A current-looking answer is not evidence that a current source was consulted.
Solved comparison
Recognizing an object is an example of perception. Turning audio into text is speech recognition. Producing a new paragraph is generation. A single interface can combine them, but the underlying task definitions remain distinct.
Generated Is Not Retrieved
A model may generate a plausible paragraph from learned patterns without finding a matching source. A retrieval component, when present, supplies external material. Distinguish those operations before claiming that a response is an up-to-date quotation or verified report.
1.23 Connections Across Engineering
AI becomes meaningful in engineering when the task, data and output are defined precisely. The following are illustrative applications for all nine streams covered by these notes. They describe possible uses, not claims that every system in an industry already operates this way.
| Stream | Application | Possible Data / Output |
|---|---|---|
| CE | Structural condition monitoring | Images or sensor records → flag for inspection |
| ME | Predictive maintenance | Operating history → condition estimate |
| EE | Smart-grid demand forecasting | Demand and context → future demand |
| ECE | Signal or visual inspection | Signal / image → class or estimated property |
| CSE | Code analysis and optimization support | Program context → suggested analysis / candidate change |
A supervised setup requires checked target outcomes, such as recorded demand or verified condition labels. An unsupervised setup can explore patterns without those labels. A sequential control-learning setup needs an environment and a designed reward.
A suggestion used in software or structural review still needs validation within the engineering workflow. A plausible output can fail a requirement that was not represented during model development.
CSE example check
A model suggesting a code optimization has not proved semantic equivalence. Tests, program analysis or a justified verification method must check whether the change preserves the required behavior.
A Fair Engineering Comparison
Compare a proposed model with a suitable baseline under the same permitted inputs and relevant test conditions. If one system receives future information and the other does not, a better result does not demonstrate a fair practical improvement. The information available at use time must match.
1.23.1 Material and Life-Related Streams
| Stream | Application | Possible Data / Output |
|---|---|---|
| BT | Support candidate screening | Molecular / experimental data → estimated property for review |
| CH | Process-quality prediction | Operating variables → expected quality measurement |
| TX | Fabric defect inspection | Surface images → defect flag / category |
| AG | Crop-yield estimation | Field and weather history → yield estimate |
These examples support analysis rather than prescribe a real intervention. A research estimate is not an experimentally confirmed property; an agricultural estimate is not a guaranteed yield. The practical action depends on evidence, domain constraints and responsible review.
Represent relevant conditions. A fabric model trained on one material may not generalize to another texture. A crop model trained on one region or season may not represent a new region with different practices.
1.23.2 One Application, Several Tasks
For a chemical process, predicting a measured quality value is supervised regression. Grouping unlabelled operating regimes is unsupervised. Learning control actions in a simulator from rewards is reinforcement learning. The stream label CH does not decide the method.
Choose a baseline and an evaluation setting before claiming improvement. If an ordinary rule solves the required task reliably, adding a complex model without a clear benefit can make checking and maintenance harder.
Answer template
For your stream: name one application; identify input data; state the output; describe the available feedback; give one limitation. This is more informative than writing “AI is used everywhere.”
1.24 Classroom Activity: Five AI Tools
The syllabus asks students to list five AI tools they use and discuss how each one learns. A useful activity separates an observed function from an inferred learning mechanism. Familiarity with a product does not reveal every training detail.
Use public, nonsensitive descriptions or your own permitted observations. No new account or upload of private data is required. If a tool is not personally used, label it a studied example rather than inventing a usage experience.
1.24.1 Worked Activity Sheet
| Example Tool | Observed / Known Function | Learning Discussion |
|---|---|---|
| Google Maps | Traffic-based travel estimates | Past observations can support predictive patterns |
| Spotify | Content recommendations | Interaction and item information can support ranking |
| Netflix | Title recommendations | Past viewing-related information can support relevance estimates |
| Google Photos | Visual organization / search | Image representations support visual matching |
| Voice assistant | Spoken interaction | Speech and language components can be trained on suitable examples |
Interpretation rule
These are conceptual explanations of tasks and possible feedback. They are not a reverse-engineered specification of each service’s current models, datasets or update schedule.
Label the Evidence
In an activity report, write “I observed a ranked list” separately from “a learned ranking model could support this task.” The first is an observation; the second is a conceptual explanation. This makes your report informative without pretending to know private implementation details.
1.24.2 Questions for Each Example
- What exact function appears to use AI?
- What input information is relevant to that function?
- What output does the user receive?
- What training feedback could support that task?
- What information about the implementation is actually known?
- What error could occur, and how would it be checked?
1.24.3 A Complete Sample Response
Tool: A navigation service.
Task: Estimate trip duration.
Input: Route and traffic-related information available at request time.
Output: An estimated arrival time.
Learning explanation: Past trips with measured durations can support a supervised prediction task. A complete route service may combine that component with search and constraints.
Limitation: Unusual congestion or missing road information can make an estimate inaccurate. A revised estimate during the trip does not alone prove retraining occurred.
1.24.4 Discussion Prompts
Compare two classmates’ examples. Did they identify different functions inside the same product? Did either claim a specific learning algorithm without evidence? Can one tool combine perception, prediction and ranking?
Describe a case where an output was useful but imperfect. Focus on a nonsensitive example and identify the likely stage of the error. Distinguish what was observed from a guess about the cause.
Submission format
Use a five-row table with tool, task, input, output, feedback and one limitation. End with a short paragraph explaining why an application’s name does not uniquely identify its learning method.
A Useful Discussion Answer
Two students may use the same photo service differently: one searches by content and another reviews face groups. Those are different functions and can involve different components. Analyze the chosen function before assigning input, output and a possible learning setup.
1.25 Quick Revision and Concept Checks
| Term | Essential Idea |
|---|---|
| AI | Broad field of computational intelligent capabilities |
| ML | Fit model behavior using examples |
| DL | ML using multilayer neural networks |
| Feature | Input property |
| Label | Known target outcome |
| Training | Adjust the model |
| Inference | Use the model |
| Generalization | Work usefully on new relevant data |
| Supervised | Learn with target outcomes |
| Unsupervised | Find structure without task targets |
| Reinforcement | Learn actions using interaction rewards |
| Preprocessing | Prepare suitable consistent data |
| Visualization | Inspect and communicate observations |
1.25.1 History in Four Anchors
1950: Turing’s imitation-game discussion.
1956: Dartmouth AI research project.
1997: Deep Blue’s chess match victory.
2022: Public ChatGPT introduction.
The 2012 image-classification milestone, 2016 AlphaGo match and 2017 Transformer paper connect the later development of deep and generative systems. Explain their bounded achievement rather than treating history as a list of product names.
Remember the two axes
Narrow / General / Super concern capability breadth and level. Supervised / Unsupervised / Reinforcement concern learning setup and feedback. They answer different questions.
A Five-Part Memory Framework
For any new example, ask: task, data, feedback, output and check. This framework connects definitions, learning strategies, preprocessing and everyday applications. It also exposes missing information, such as an unspecified target or a claim of reliability without independent evaluation.
1.25.2 Correct the Misconception
| Incorrect Statement | Correct Explanation |
|---|---|
| All automation is ML | Some automation follows fixed rules |
| All AI is deep learning | DL is one subset within ML and AI |
| Training equals prediction | Training changes a model; inference uses it |
| More rows always mean better data | Relevance and quality matter |
| An outlier must be deleted | It may be a real important event |
| Clusters are confirmed classes | Groups require interpretation |
| A confident answer must be true | Fluency is not verification |
| A line graph proves cause | It shows the supplied observations |
| Every user query retrains the model | Use and training are distinct |
1.25.3 A Small Mixed Case
A class collects labelled fabric images, standardizes dimensions, separates original products into train and test groups and trains a defect predictor. This is supervised classification. Consistent preparation supports input compatibility, while separation reduces a possible leakage route.
If students instead remove labels and explore visual similarity, the question changes to unsupervised grouping. The same source domain can support different tasks; state what is being learned and checked.
Final syllabus checklist
Definition and scope; history from Turing to ChatGPT; Narrow, General and Super AI; AI–ML–DL; data, patterns and predictions; three learning strategies; data, preprocessing and visualization; daily tools; all-stream examples; five-tool activity.
Distinguish Claim Strength
A tiny table can illustrate supervised learning. A plotted association can suggest a relationship. A separate relevant evaluation can support a performance claim. These are different levels of evidence; do not let an attractive figure or confident description substitute for the check needed by the claim.
1.26 Examination Practice
1.26.1 Short-Answer Questions
- Define AI and illustrate one input–output task.
- Distinguish artificial intelligence and automation.
- What did Turing’s imitation game examine?
- Why is 1956 important in AI history?
- Differentiate Narrow AI and AGI conceptually.
- Explain the inclusion relationship AI, ML and DL.
- Distinguish a feature from a label.
- What is inference?
- Why does a missing value differ from zero?
- Give one example of data leakage.
- Choose a chart for a numerical distribution.
- Why does association not establish causation?
1.26.2 Long-Answer Questions
- Explain the scope and historical development of AI with a timeline and bounded examples.
- Compare supervised, unsupervised and reinforcement learning using inputs, feedback, outputs and one engineering case each.
- Describe a data-to-prediction workflow, including quality checks, preprocessing and fair evaluation.
- Explain bar, line, histogram and scatter displays with labelled examples.
- Analyze five daily-use AI tools and distinguish known functions from inferred learning details.
Practice questions, not past papers
These questions are designed for revision from the supplied unit outline. They are not presented as verified previous-year questions or a guarantee of examination coverage.
Practice an Answer Outline
For supervised learning, write the definition, identify input features and known labels, separate training from inference, give a classification or regression example and explain how new examples are checked. That structure develops an answer instead of listing disconnected terminology.
1.26.3 Solved Reasoning Checks
1. A group of unlabelled motor readings is divided by similarity. Which learning family fits?
Unsupervised learning, because no target outcomes are supplied and the goal is structure discovery. The groups still require engineering interpretation.
2. A numeric class code is 0 for good and 1 for defective. Is this regression?
No. The codes represent categories, so predicting them from labelled examples is classification.
3. Does an arrival-time change prove online learning?
No. New traffic information can change inference without retraining the model.
4. Why not compute a fitted missing-value replacement from the whole dataset before splitting?
Held-out information would influence the learned preparation, weakening the separation between training and checking.
5. A model succeeds on a repeated training image in its test set. What is the issue?
The test may reward memorization of an old example; separate related source observations appropriately.
6. Which chart suits load–temperature pairs?
A scatter plot can show their association. It does not prove that load alone causes every temperature change.
1.26.4 Model Answer Structure
For a longer answer, begin with a precise definition, explain the stages or differences, add a labelled figure or comparison table, work through an example, and state one meaningful limitation. Keep the explanation consistent with what the example actually demonstrates.
Final learning check
Can you identify the task, data, feedback, output and validation for a new example? If yes, you can apply this unit’s ideas beyond the products named in the syllabus.
A Final Self-Check
Explain why a route estimate may be wrong without saying the computer forgot to think. Consider changed traffic, missing input, an unsuitable learned relationship or a mismatch between training and current conditions. A concrete failure explanation demonstrates more understanding than a vague claim that AI makes mistakes.
COMPLETE EXPLANATIONS FOR EXAM ANSWERS
The following answers connect the topics in these AI and Prompt Engineering Unit 1 Notes into examination-ready explanations.
Explain AI and Distinguish It from Automation, ML and DL
Artificial intelligence is the broad field of computational methods for capabilities such as perception, reasoning, learning, language use, planning and decision-making. A useful description identifies an input, the task performed and the output. For example, a fabric-inspection system receives a surface image and produces a possible defect category for review.
Automation means carrying out a process with reduced manual effort. It can follow fixed instructions, use a learned model or combine both. A lamp switching on at a preset time is automatic, but its schedule need not have been learned from data. An inspection workflow may combine learned visual detection with fixed reporting and alert rules.
Machine learning is a subset of AI in which data and a training procedure influence the fitted behavior of a model. Deep learning is a subset of machine learning that uses neural networks with multiple processing layers to learn representations and mappings. The relationship is DL within ML within AI. A knowledge-based reasoning system can be AI without being ML; a simple fitted numerical predictor can be ML without being DL.
The distinction concerns the method and source of behavior. An application’s name, an automatic interface or a large amount of data does not by itself establish which method it uses. Human engineering still defines the objective, preparation procedure, operating conditions and checks.
Explain the Historical Development of AI
Begin with Turing’s 1950 discussion of machine intelligence and the imitation game. Its importance was an operational focus on observable conversational behavior. A convincing interaction does not establish every form of intelligence or prove consciousness.
The Dartmouth proposal was written in 1955 by John McCarthy, Marvin Minsky, Nathaniel Rochester and Claude Shannon. The 1956 summer project helped establish AI as a named research field. Early symbolic approaches represented facts, rules and alternative actions explicitly. Expert systems later organized specialist knowledge into a knowledge base and used an inference engine to apply it to cases. Their maintenance and limited transfer beyond a narrow domain helped expose the gap between ambitious expectations and practical capability.
Learning-based research developed alongside symbolic work. Rosenblatt’s 1958 perceptron is an early example of trainable connections. The influential 1986 backpropagation paper helped popularize learning internal representations in multilayer networks; it should not be described as the first related work ever undertaken.
Deep Blue’s 1997 chess victory demonstrated specialized search and evaluation. AlexNet’s 2012 image-classification result showed the practical strength of learned deep visual representations. AlphaGo’s 2016 achievement combined neural estimates with search. The 2017 Transformer milestone introduced an influential attention-based architecture, while ChatGPT’s public introduction in 2022 made conversational generative AI widely accessible.
Conclude by explaining the bounded achievement at each stage. Success at chess, image classification or conversation does not automatically establish unrestricted capability in every domain.
Compare Supervised, Unsupervised and Reinforcement Learning
The deciding question is what feedback is available during learning. Supervised learning uses input examples paired with known target outcomes. A model predicts a category in classification or a numerical quantity in regression. For example, verified fabric-defect labels support classification, while recorded journey durations support regression. The target must be aligned with the input and unavailable as an answer-revealing feature at prediction time.
Unsupervised learning explores structure without supplied task-target labels. It can group similar unlabelled sensor records or investigate patterns in descriptions. A cluster does not automatically have a verified physical meaning. Representation, scaling and the selected method influence the resulting groups, which require interpretation.
Reinforcement learning concerns an agent interacting with an environment. The agent receives observations, chooses actions and receives rewards. Its aim is to learn a policy that achieves a suitable cumulative objective. A simulated navigation agent can learn movement choices from a designed reward for reaching a goal and avoiding wasted steps. Immediate reward need not capture the quality of a long sequence, and poorly designed rewards can favor unintended behavior.
The application domain does not determine the learning family. In the same engineering process, predicting a labelled quality value can be supervised, grouping operating regimes can be unsupervised, and learning simulated control actions from rewards can be reinforcement learning. Name the task, input, feedback and output before selecting the category.
Describe a Data-to-Prediction Workflow
Start by defining the intended task, output and operating context. Identify which input information will actually be available when a prediction is needed. Then collect relevant observations and, for supervised learning, checked target outcomes.
Inspect data quality before fitting a model. Missing values, inconsistent units, incorrect labels, verified duplicate events and unrepresentative sampling create different problems and need different responses. A missing measurement is not automatically zero, and an unusual value may be an important real event.
Choose a defensible separation between training, validation and held-out testing. Related observations may need to stay together: putting near-duplicate images of one product in both training and testing can make evaluation misleading. Future reports must not become present-time features. Any preparation values learned from data must be fitted using the permitted training portion and then applied consistently to held-out examples.
Prepare suitable representations through justified cleaning, encoding, scaling or image and text preparation. Train the model and use validation appropriately during development. Keep the final test separate from repeated model-selection decisions. Compare against a suitable baseline under the same available inputs and relevant conditions.
Inference applies the fitted model to new inputs; it does not necessarily update the model. After deployment, monitor errors, input quality and changing conditions. Recording feedback, retraining and deploying an update are separate processes that need to be deliberately implemented and checked.
Explain the Four Main Visualization Choices
A bar chart compares quantities across separate categories. The source example compares defect counts for batches A, B and C: 2, 5 and 3. Bar length communicates the magnitude, so the zero baseline and scale matter.
A line chart joins observations in a meaningful order, often time. The source temperature example uses sample indices rather than measured durations. Connecting unrelated categories can imply a continuity that the observations do not justify.
A histogram summarizes a numerical distribution using intervals. The source example places ten temperatures into bins with counts 3, 5 and 2. Boundary rules must be explicit so that each value is assigned once. Bin width affects interpretation, and the histogram does not preserve the original measurement sequence.
A scatter plot shows paired numerical observations and can reveal an association. The source load–use example has a positive association, but the plot alone cannot establish causation. Read labels, units, ranges, missing observations and the evidence behind a claim before interpreting any display.
CONCEPT SHEET WITH CONDITIONS AND CHECKS
This unit is primarily conceptual. Use the following sheet alongside the detailed AI and Prompt Engineering Unit 1 Notes.
| Concept | Essential Relationship | Condition or Check |
|---|---|---|
| AI, ML and DL | DL is within ML; ML is within AI | AI also includes methods outside learning |
| Capability categories | Narrow, General and Super | These describe capability breadth and level |
| Learning families | Supervised, unsupervised and reinforcement | Identify the available learning feedback |
| Classification | Predict a category | Numerical category codes remain categorical |
| Regression | Predict a numerical quantity | Define the measured target and its units |
| Training | Fit or adjust model behavior | Use permitted examples and a defined objective |
| Inference | Apply the fitted model | Use the same expected representation |
| Generalization | Work usefully on relevant new examples | Training recall alone is insufficient |
| Data preparation | Inspect, clean and represent | Preserve meaning and document assumptions |
| Data leakage | Held-out or future information enters development | Keep the evaluation and prediction-time boundaries intact |
| Visualization | Match the display to the question | Read scales, units, ordering and limitations |
| Engineering application | Task → data → feedback → output → check | Validate the output’s intended practical role |
QUICK REVISION: EXPLAIN AND CONNECT
Is Every Automatic System an AI System?
No. Automation can follow explicit fixed instructions. Explain which component performs a perception, learning, reasoning or other AI task.
Can AI Exist Without Machine Learning?
Yes. Explicit knowledge-based reasoning and search can contribute to AI without fitting a model from examples.
Does Every Machine-Learning Model Use Deep Learning?
No. Deep learning is one family within ML. The nested relationship does not make the terms interchangeable.
What Distinguishes a Feature from a Label?
A feature is an input property. A label is a supplied target outcome for supervised learning. Their roles depend on the task and prediction-time availability.
Does a New Prediction Prove That Retraining Occurred?
No. New input or retrieved context can change an output while the fitted model remains unchanged.
Are Cluster Names Automatically Verified Classes?
No. Unsupervised groups reflect a method and representation; their practical meaning requires interpretation and evidence.
Why Can an Outlier Be Important?
An unusual value may represent a real fault or rare operating condition. Investigate it before deciding whether it is an error.
Why Is Missing Different from Zero?
Missing means the observation is absent or unavailable. Zero is a recorded value with a task-specific meaning. Replacing one with the other introduces an assumption.
Why Keep a Held-Out Test Set?
It supports a separate check on relevant unseen examples. Repeatedly selecting models from its scores lets the test influence development.
Which Chart Shows a Numerical Distribution?
A histogram groups numerical values into intervals. A bar chart instead compares quantities associated with distinct categories.
Does Positive Association Prove Causation?
No. A scatter plot can display paired observations without isolating a causal explanation.
How Should an Everyday AI Tool Be Analyzed?
Identify its specific function, input, output, possible learning feedback and one limitation. Separate observed behavior from guesses about private implementation details.
For revision, return to the worked cases and diagram references in these AI and Prompt Engineering Unit 1 Notes. Additional study material is available at www.notesgallery.com. The university website is https://aktu.ac.in.