
University: Dr. A.P.J. Abdul Kalam Technical University (AKTU)
Programme: B.Tech First Year, Semester I & II
Course Codes: AAS102A-H / AAS202A-H
Branches: CSE, EE, ECE, CE, ME, BT, CH, TX and AG
Unit: III — Sensors, Catalysis and Applied Process Chemistry
Introduction to Sensors, Catalysis and Applied Process Chemistry
A gas sensor, optical fibre, lubricated bearing, water-treatment bed and enzyme reactor all depend on selected chemical interactions. Their functions differ, but each requires a connection between material composition, mechanism, operating conditions and a measured result.
A sensor converts a chemical interaction into information. A functional dielectric or magnetic material supports a selected electrical task. A lubricant controls contact behaviour, while a fuel supplies energy through a specified conversion process.
Water treatment and separation move or transform selected constituents. Catalysts and enzymes change reaction pathways. Fertilizers supply nutrients, pesticides interact with target organisms, and textile wet processing removes or adds material through controlled chemistry.
These Applied Chemistry Unit 3 Notes develop those relationships through sensing, electronic materials, fuels, water treatment, catalysis, adsorption, enzyme kinetics, agrochemicals and textile wet processing.
The central questions are what interacts, what changes, what is measured and which conditions support the intended use.
Unit Coverage
- Chemical recognition, transduction and calibration.
- Amperometric and potentiometric sensing.
- Metal-oxide, optical and MEMS gas sensors.
- Enzyme, immune and DNA biosensors.
- Responsive RFID tags.
- Environmental detection and electronic noses.
- Blanks, interference, recovery, noise and drift.
- Dielectrics, ferroelectrics and piezoelectric materials.
- Liquid crystals, LEDs and phosphors.
- Ferrites and rare-earth magnets.
- Optical fibres and magneto-optical communication.
- Lubrication, viscosity and additives.
- Calorific values, coal analysis, octane and cetane.
- Biofuels and biogas.
- Water hardness and oxygen demand.
- Clarification, filtration and disinfection.
- Wastewater loads, zeolites and ion exchange.
- Catalysis, deactivation and regeneration.
- Adsorption, chromatography and membranes.
- Enzyme classes, mechanisms and kinetics.
- Inhibition, immobilization and enzyme engineering.
- Fertilizers, pesticide fate and environmental effects.
- Desizing, scouring and bleaching.
- Dyeing, printing and textile effluent.
- Worked problems, formulas and examination revision.
Important Terms
| Term | Meaning |
|---|---|
| Analyte | Chemical species or quantity targeted by a measurement |
| Recognition | Interaction supporting a sensor response |
| Transduction | Conversion of a response into a measurable signal |
| Sensitivity | Signal change per change in the defined input |
| Selectivity | Discrimination against other constituents |
| Calibration | Defined relation between reference input and signal |
| Dielectric | Material supporting electric polarization |
| Piezoelectricity | Coupling between mechanical stress and electrical polarization |
| Viscosity | Resistance to flow or shear under stated conditions |
| Calorific value | Released heat per declared fuel quantity and product basis |
| Adsorption | Accumulation at a surface |
| Catalyst | Material supporting an alternative reaction pathway |
| Reaction selectivity | Product-distribution measure on a stated basis |
| Membrane rejection | Comparison between feed and permeate concentrations |
| Turnover number | Limiting rate per defined active-site amount |
| Dye exhaustion | Transfer of dye from bath on a stated basis |
| Fixation | Retention through the relevant binding and after-treatment process |
Working Conventions
Signals require units, calibration and sample-preparation history. Sensitivity is not selectivity, and repeatability alone does not establish accuracy.
Fuel, adsorption, enzyme and separation calculations retain their supplied models and reporting bases.
Hardness uses a declared equivalent convention. Fertilizer grades distinguish elemental nutrients from oxide-equivalent reporting.
Dye exhaustion and fixation can use different denominators. Treatment diagrams include residual streams because removed material does not disappear.
All numerical properties and efficiencies in the worked problems are supplied educational values.
Branch Reading Guide
| Stream and codes | Unit III title | Complete numbered route |
|---|---|---|
| CE: AAS102A / AAS202A | Water Chemistry and Treatment | 21-26 |
| ME: AAS102B / AAS202B | Lubricants and Fuels | 15-20 |
| EE/ECE: AAS102C / AAS202C | Dielectric, Magnetic and Optical Materials | 9-14 |
| CSE: AAS102D / AAS202D | Sensors and Chemical Detection | 1-8 |
| TX: AAS102E / AAS202E | Textile Wet Processing Chemistry | 44-49 |
| BT: AAS102F / AAS202F | Enzyme Chemistry and Bioprocess Applications | 33-38 |
| CH: AAS102G / AAS202G | Catalysis, Adsorption and Separation Chemistry | 26-32 |
| AG: AAS102H / AAS202H | Agrochemistry: Fertilizers and Pesticides | 39-43 |
Each route is complete. Students do not need to add a hidden common block.
Section 26 is shared by CE and CH. It develops zeolite and ion-exchange chemistry. CH then continues with catalysis, adsorption, chromatography and membranes.
Follow numbered headings rather than broad page ranges because two routes can share a boundary page.
1. Chemical Sensing: Recognition, Transduction and Calibration
Study route: CSE
A chemical sensor converts information about an analyte into a measurable signal.
A recognition or interaction region responds to the sample. A transducer converts that response into an electrical or optical quantity. Calibration links the measured signal with a defined chemical quantity.
A digital number is incomplete without units, sample identity, measurement conditions and a reporting basis.

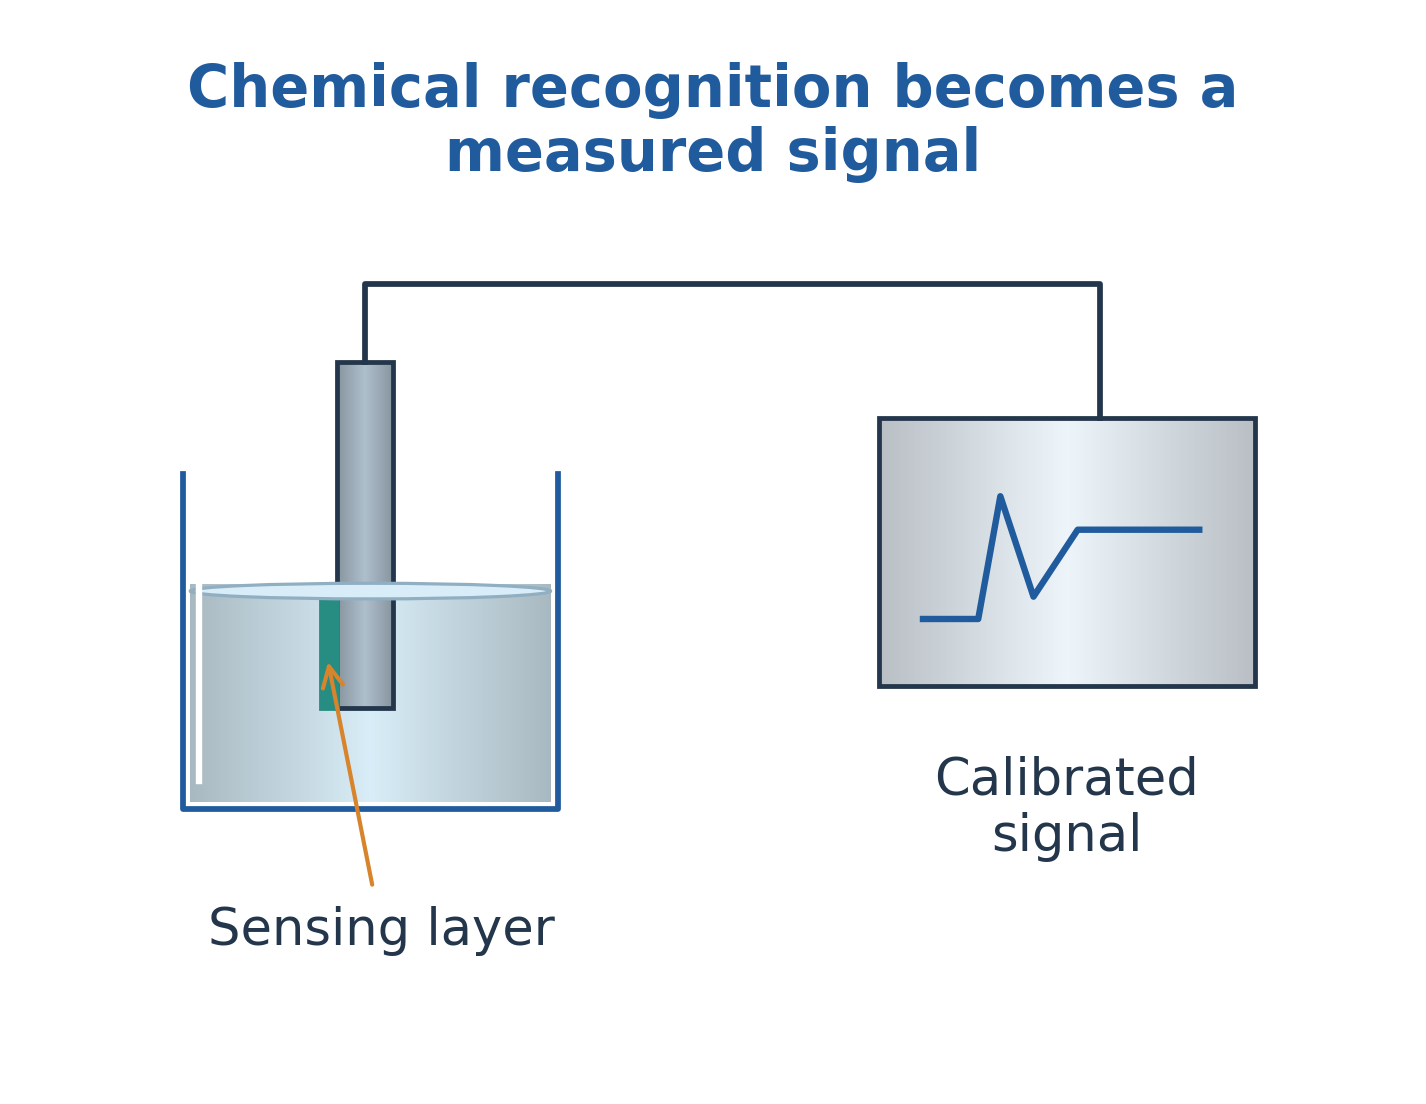
Sensitivity is signal change per input change. Selectivity concerns discrimination against other species.
Range, precision, response time, drift and stability describe different aspects of performance.
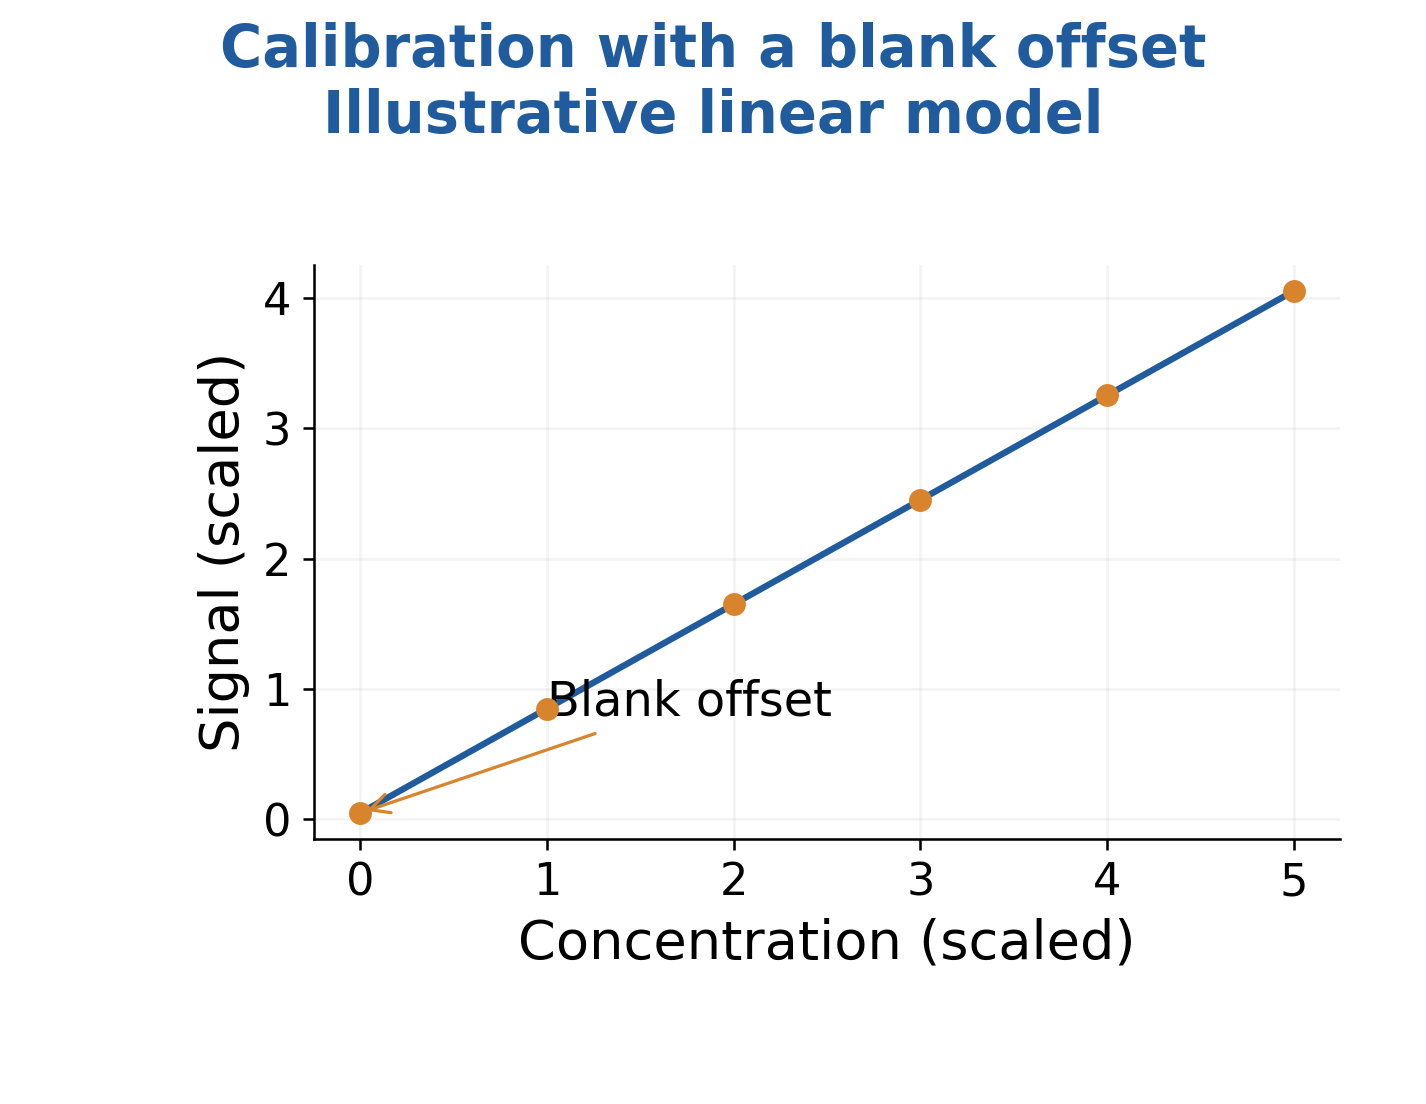
For a supplied linear model:
y = b + mC
Therefore:
C = (y – b)/m
The offset must be removed before dividing by sensitivity.
Calibration establishes a relation under specified conditions. It does not independently prove accuracy or selectivity in another sample matrix.
Worked Problem 3.1: From Input to Signal
Problem: A sensor follows y = 5 + 2C, with y in mV and C in mg/L. Reference input is 20 mg/L. Find expected signal and recover concentration.
Solution:
Target-related signal = 2 × 20 = 40 mV
Total signal = 5 + 40 = 45 mV
Recover concentration:
C = (45 – 5)/2 = 20 mg/L
Answer: Expected signal is 45 mV, and recovered concentration is 20 mg/L.
The calibration provides the conversion between signal and the defined input.
2. Amperometric and Potentiometric Electrochemical Sensors
Study route: CSE
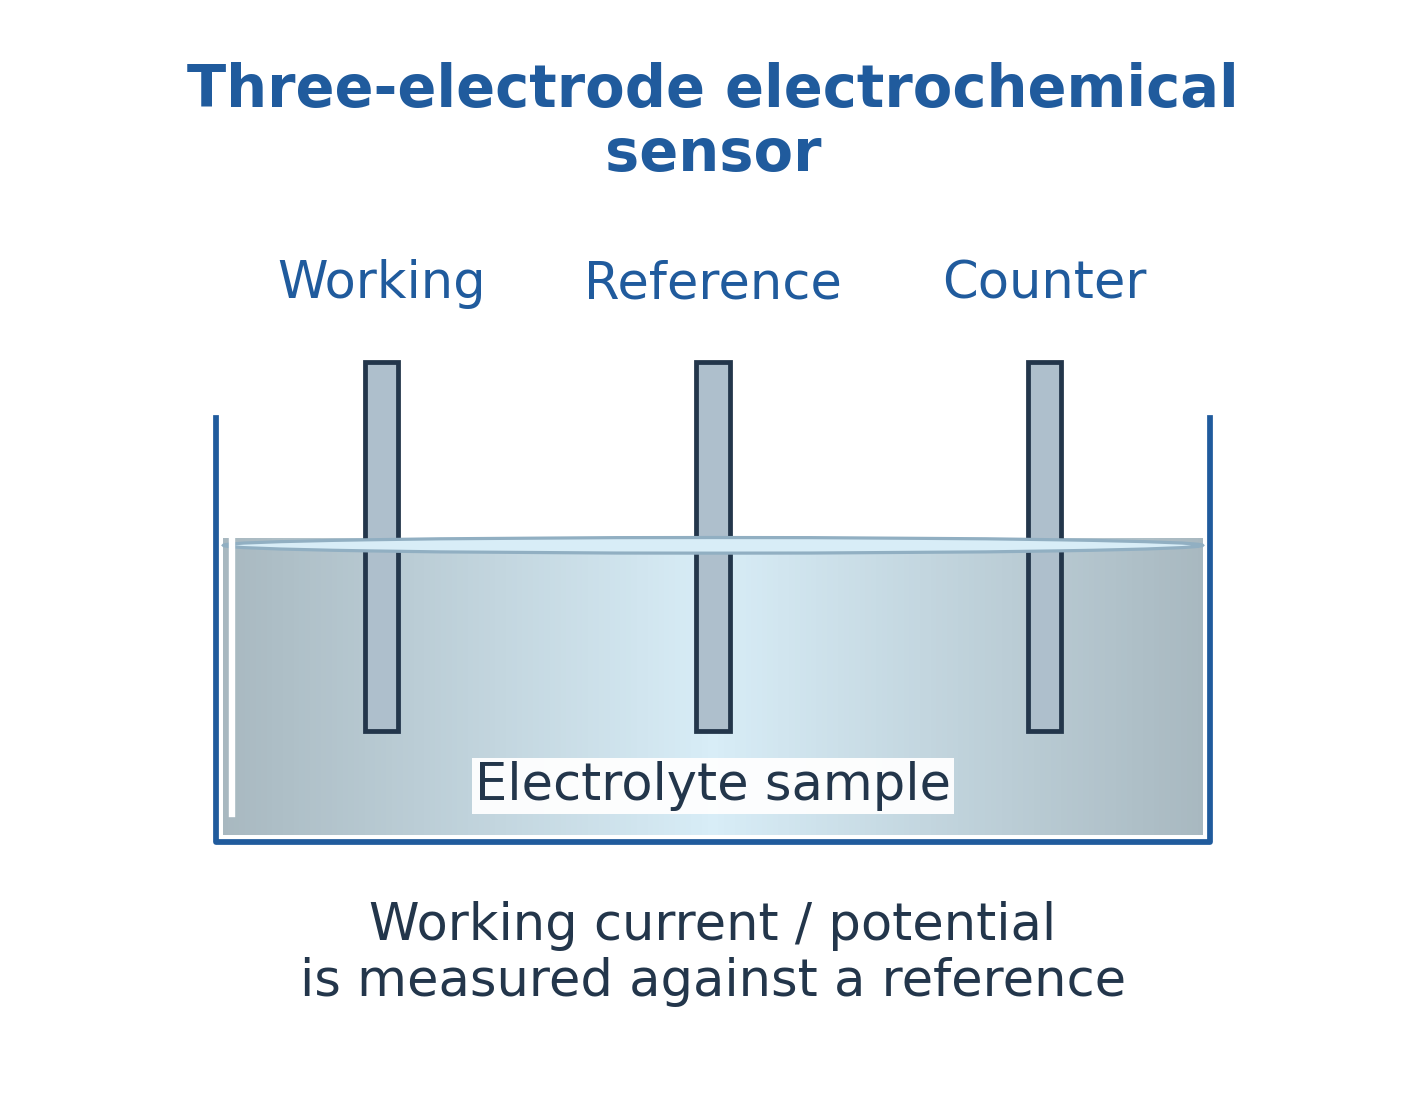
An amperometric sensor measures reaction-associated current under suitable potential control.
In a common three-electrode arrangement, the working electrode provides the sensing interface, the reference defines potential and the counter electrode carries balancing current.
Current can depend on reaction rate, transport and interfering reactions. It is not automatically proportional to concentration without a valid model or calibration.

Potentiometric sensing measures a potential difference with minimal measurement current.
An ion-selective response depends on activity and a reference system. Ideal Nernst-type behaviour is logarithmic in activity.
A pH electrode therefore needs calibration and appropriate conditions.
Distinguish a current readout under potential control from a near-zero-current potential readout.
| Sensor type | Primary readout |
|---|---|
| Amperometric | Current under suitable potential control |
| Potentiometric | Potential difference at minimal measurement current |
Worked Problem 3.2: Reaction Rate and Current
Problem: A target reaction transfers two electrons per molecule. Assigned reaction rate is 2 × 10^-10 mol/s and collection fraction is one. Use F = 96485 C/mol.
Solution:
Electron amount rate = 2 × 2 × 10^-10
Electron amount rate = 4 × 10^-10 mol/s
Current = F × Electron amount rate
Current = 96485 × 4 × 10^-10 A
Current = 3.8594 × 10^-5 A
Answer: Target-current magnitude is 38.594 microamperes.
Worked Problem 3.3: Ideal Activity Response
Problem: A cation sensor follows E = 200 + 59.16 log10 a in mV. Activity is 0.01.
Solution:
log10 0.01 = -2
Potential correction = 59.16 × (-2) = -118.32 mV
E = 200 – 118.32 = 81.68 mV
Recover activity:
a = 10^((81.68 – 200)/59.16) = 0.01
Answer: Potential is 81.68 mV, and recovered activity is 0.01.
3. Gas Sensors: Metal Oxide, Optical and MEMS Platforms
Study route: CSE
A metal-oxide gas sensor can change resistance when adsorbed species alter surface charge and carrier depletion or accumulation.
The sign and magnitude depend on oxide, gas and conditions.
Humidity, temperature and cross-sensitive gases can change response. A resistance ratio must define its numerator.


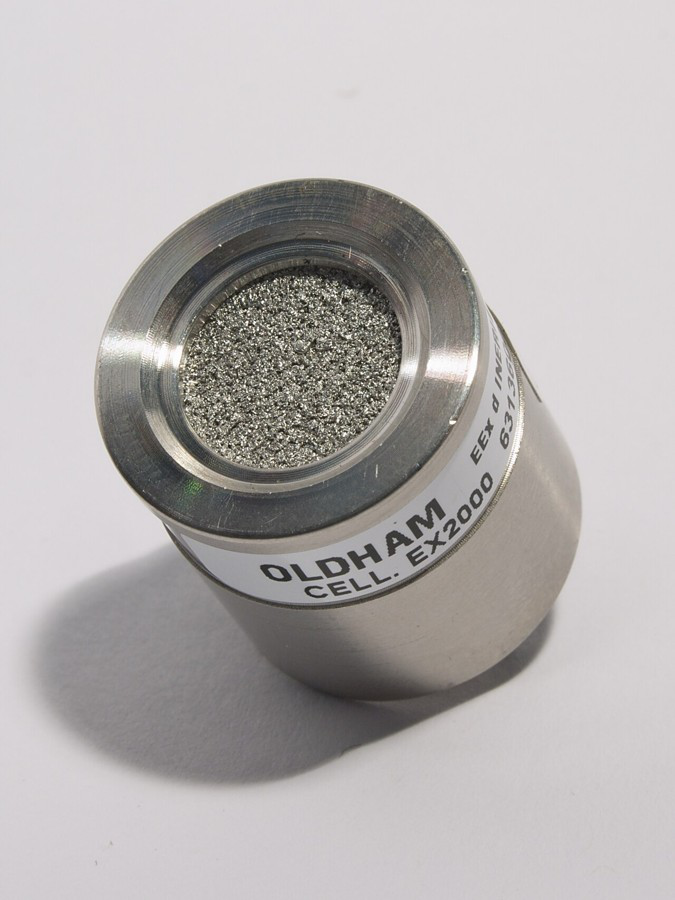
Optical gas sensors use interactions such as wavelength-selective absorption.
Within a suitable linear regime:
A = log10(I0/I) = epsilon × l × c
NDIR instruments compare appropriate absorption and reference channels.
MEMS platforms can integrate micro-hotplates and sensing films. MEMS describes a fabrication platform, not one universally selective chemical reaction.
Match receptor, readout and interference control to the target gas.
Worked Problem 3.4: Transmission and Absorbance
Problem: Reference intensity is 100 units and sample intensity is 50 units after the stated background handling.
Solution:
Transmittance = 50/100 = 0.5
Percent transmission = 100 × 0.5 = 50%
Absorbance = log10(100/50)
Absorbance = log10 2 = 0.30103
Answer: Transmittance is 0.5, percent transmission 50%, and absorbance 0.30103.
4. Biosensors: Enzyme, Immune and DNA Recognition
Study route: CSE
A biosensor combines biological recognition with a transducer and calibrated readout.
Enzyme sensors use selective conversion. A glucose-oxidase-based system can monitor an associated electrical or chemical change under appropriate conditions.
Immunosensors use antibody-antigen recognition together with signal generation. Binding alone is not a complete measurement.

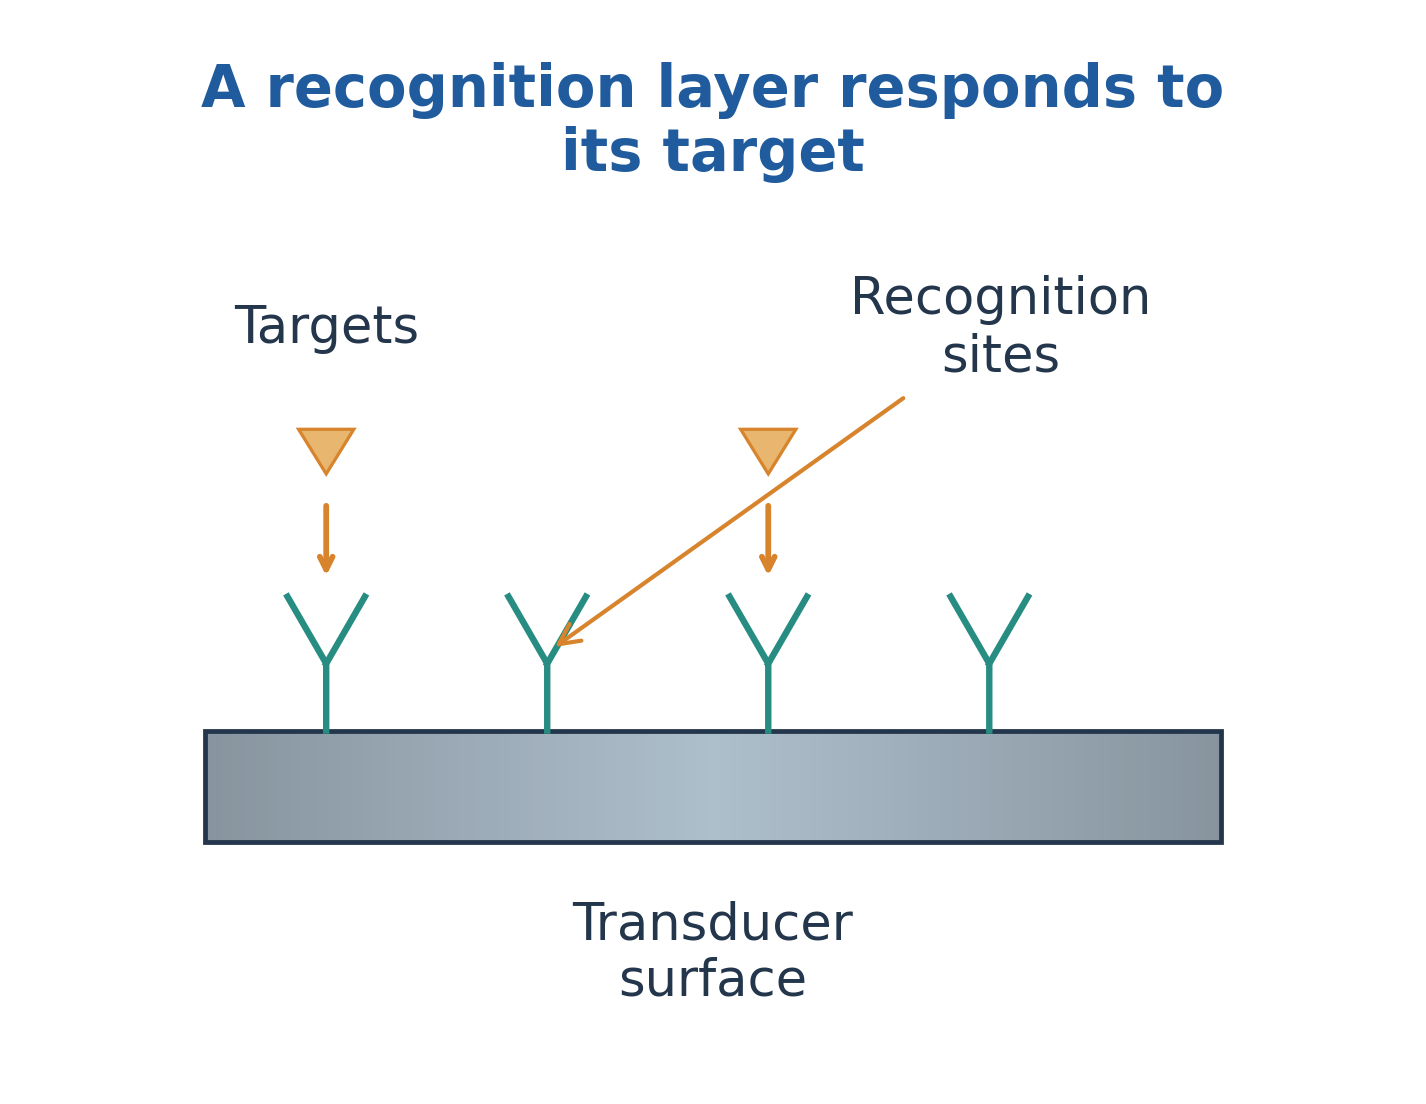


DNA sensors use complementary hybridization or related sequence recognition.
Directionality, mismatch, nonspecific binding and fouling affect interpretation.
Immobilization can change activity and accessibility.
Blanks, negative controls, reference samples and matrix assessment are important. A laboratory calibration does not independently establish complete specificity or clinical performance.
| Recognition type | Main interaction |
|---|---|
| Enzyme | Suitable biological conversion |
| Immune | Antibody-antigen recognition |
| DNA | Sequence-dependent recognition |
Worked Problem 3.5: Complement and Reverse Complement
Problem: A probe is 5-prime ATGC 3-prime. Write its aligned complement and then the complement in its own five-prime-to-three-prime direction.
Solution:
Base pairing gives TACG.
Antiparallel alignment gives:
3-prime TACG 5-prime
Rewriting that strand in its own direction gives:
5-prime GCAT 3-prime
Answer: Aligned complement is 3-prime TACG 5-prime; reverse complement is 5-prime GCAT 3-prime.
5. RFID Materials and Chemically Responsive Tags
Study route: CSE
RFID systems include a reader and a tag containing an antenna and suitable electronic or coupling structures.
Substrate, conductor, chip connection and encapsulation have different functions.
A successful identifier read is not automatically a chemical concentration measurement.

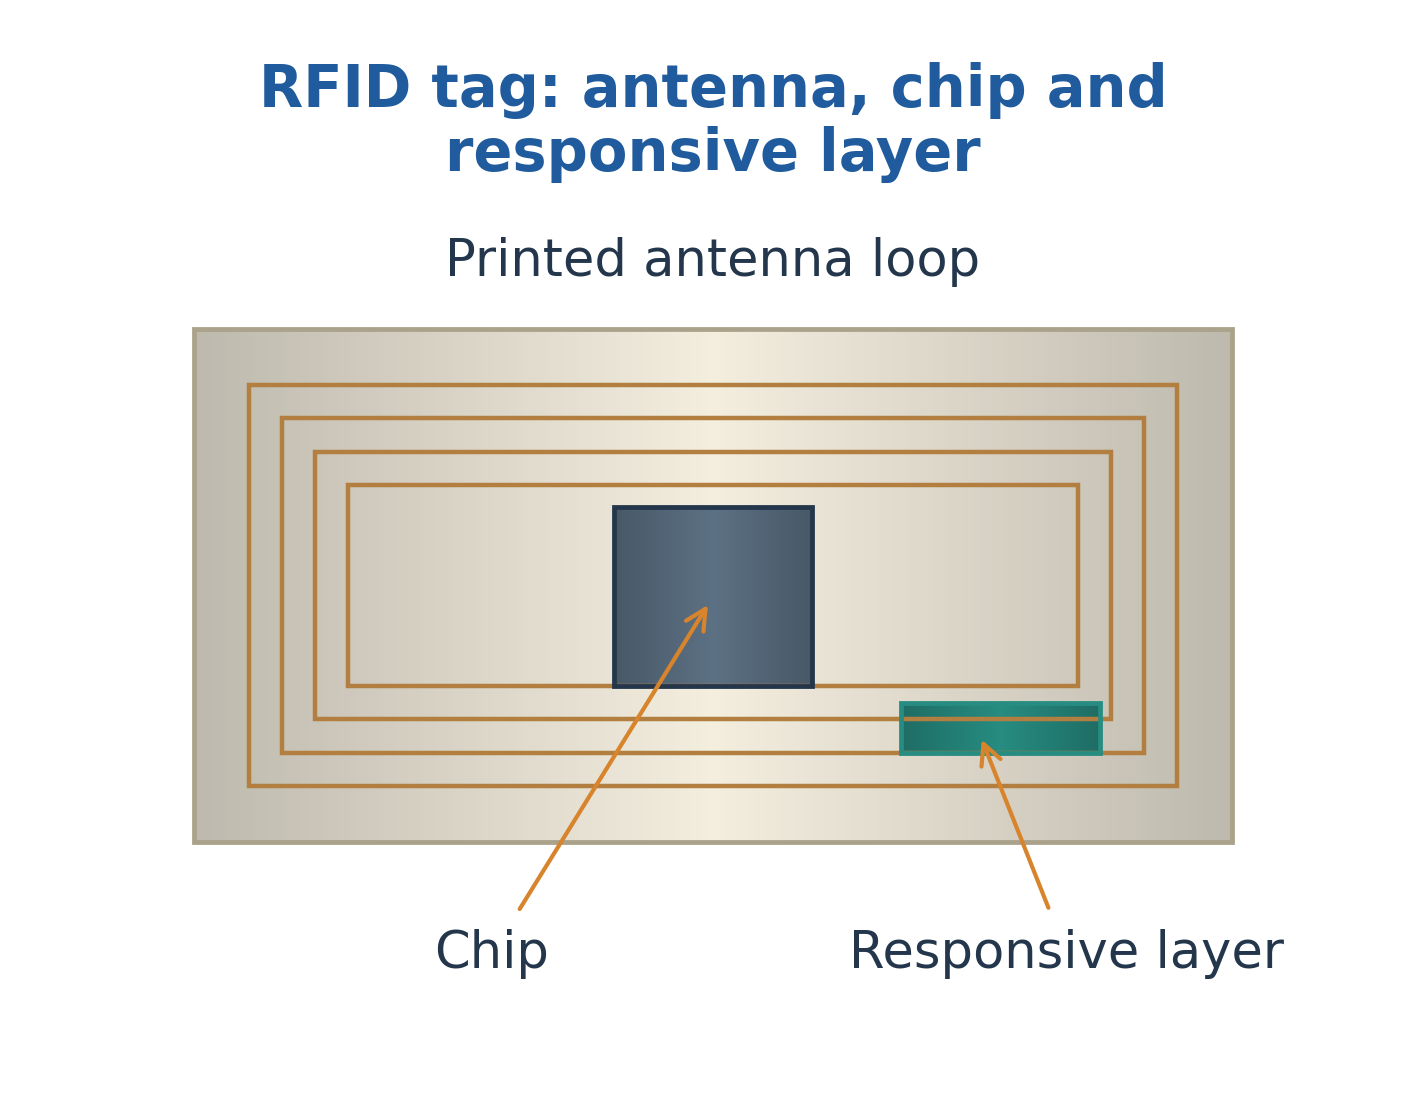
A responsive film can change resistance, capacitance, dielectric behaviour or another coupling-related property.
That change can affect resonance, impedance or read characteristics.
Calibration must separate chemical effects from distance, alignment, substrate and environmental changes.
For an ideal LC model:
f0 = 1/(2 pi sqrt(LC))
Actual RFID response also depends on losses, matching and protocol.
Worked Problem 3.6: Capacitance and Resonance
Problem: L = 1 microhenry and C = 100 pF. A response multiplies C by 1.21 while L remains fixed.
Solution:
L = 1 × 10^-6 H
C = 1 × 10^-10 F
Initial f0 = 1/(2 pi sqrt(LC)) = 15.9155 MHz
Frequency changes inversely with square root of capacitance:
Final frequency = Initial frequency / sqrt(1.21)
Final frequency = 15.9155/1.1 = 14.4686 MHz
Relative change = (14.4686 – 15.9155)/15.9155 × 100
Relative change = -9.09091%
Answer: Initial frequency 15.9155 MHz, final frequency 14.4686 MHz, change -9.09%.
6. Environmental Detection in Air and Water
Study route: CSE
Environmental monitoring begins with target and sampling boundary.
Location, time, sample matrix, preparation and reporting basis define what the result represents.
Water sensors can measure suitable ions or reaction-related quantities. Air systems can report gas mole fractions or mass concentrations.
These require their own conversion assumptions and units.

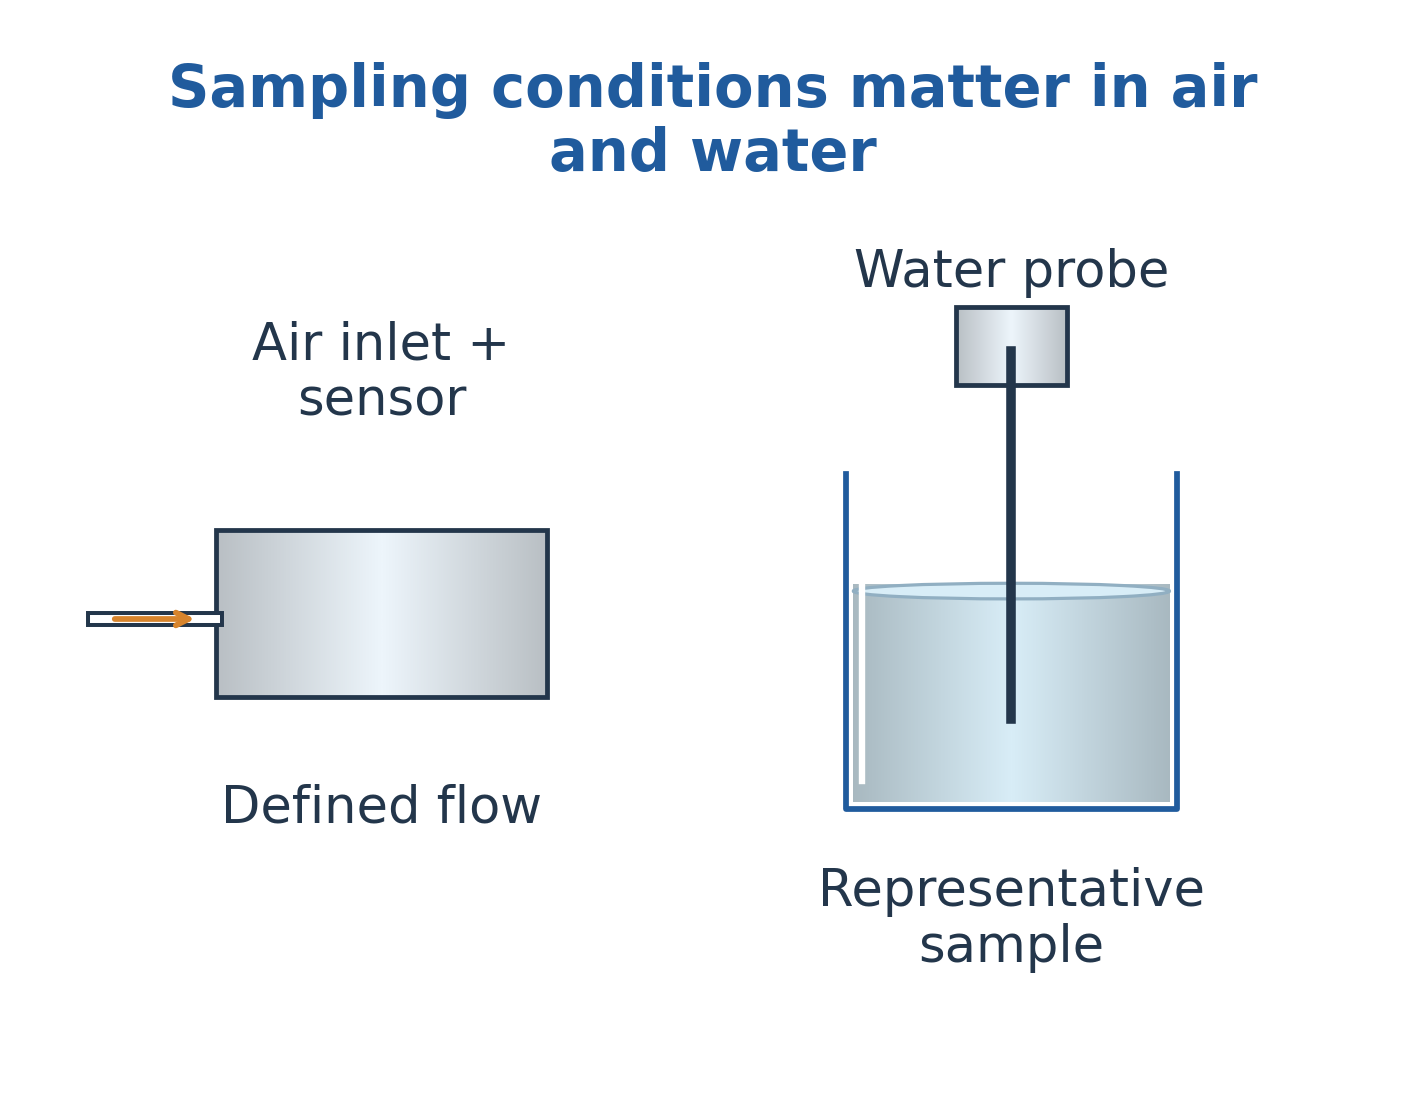
Dilution, filtration, storage and flow can change the represented concentration.
An accurate instrument cannot recover an unrecorded preparation factor.
Time averages need declared intervals or weighting.
Validate in representative matrices and track fouling, drift and interference.
An isolated detection event is not a full trend, and an electronic-nose classification is not automatically a separate calibrated concentration for every species.
Worked Problem 3.7: Sample Mass and Volume
Problem: A prepared sample contains two milligrams target in 500 mL. Original concentration is defined as one times prepared concentration, with no loss or reaction.
Solution:
Volume = 500/1000 = 0.5 L
Prepared concentration = 2/0.5 = 4 mg/L
Original concentration = 1 × 4 = 4 mg/L
Answer: Prepared and original concentrations are both 4 mg/L under the supplied basis.
7. Electronic Nose: Arrays and Pattern Recognition
Study route: CSE
An electronic nose uses an array of partially selective elements to create a response pattern.
Individual channels need not uniquely identify one molecule.
Baseline correction, normalization and feature extraction convert readings into comparable data.


A trained model connects patterns with defined reference classes under training conditions.
Validation needs independent samples and representative humidity, temperature and concentration variation.
Drift can move familiar samples toward the wrong class.
Unfamiliar patterns may need rejection rather than forced assignment.
Sampling -> Array response -> Features -> Validated interpretation
Worked Problem 3.8: Nearest-Centroid Rule
Problem: Sample is (0.2, 0.8), centre A is (0.1, 0.9), and centre B is (0.8, 0.2). Use squared Euclidean distance and accept only when the nearest squared distance is at most 0.1.
Solution:
Distance² to A = (0.2 – 0.1)² + (0.8 – 0.9)²
Distance² to A = 0.02
Distance² to B = (0.2 – 0.8)² + (0.8 – 0.2)²
Distance² to B = 0.72
A is nearer and 0.02 is below 0.1.
Answer: The supplied model assigns class A.
8. Sensor Quality: Blanks, Noise, Recovery and Drift
Study route: CSE
A blank measures relevant background.
Precision describes repeatability, while bias concerns systematic disagreement with a suitable reference.
Sensitivity is a calibration slope, not a synonym for low detection limit.
A threshold based on blank variability uses a stated convention and does not establish every false-positive or false-negative outcome.

Recovery of an added amount tests a particular preparation and matrix experiment.
Drift can change offset, sensitivity or both. Subtracting one constant is not always sufficient.
Response time can include flow and residence effects as well as chemical response.
Maintain calibration history, controls and a defined decision rule.
Validating a Sensor in a Real Sample
Identify target species, matrix and unit.
Select recognition chemistry and readout for the required range.
A pure-water calibration may not apply unchanged to salty or protein-containing samples.
Use standards, blanks and repeated measurements. Add a known target amount to test recovery using the correct final-volume basis.
Challenge likely interferents and relevant temperature, humidity and pH changes.
Check response and recovery time. A fast initial signal is not proof of complete reversibility.
Recheck references after service. For electronic noses, keep training and validation independent and use an appropriate rejection rule.
9. Dielectric Materials, Polarization and Capacitors
Study route: EE and ECE
A dielectric polarizes under an applied electric field.
Electronic, ionic, orientational and interfacial mechanisms have different timescales and frequency dependence.
Relative permittivity concerns charge-storage response. Dielectric loss concerns dissipation. Leakage and breakdown need separate assessment.
Polymers, glass and ceramics provide different combinations.

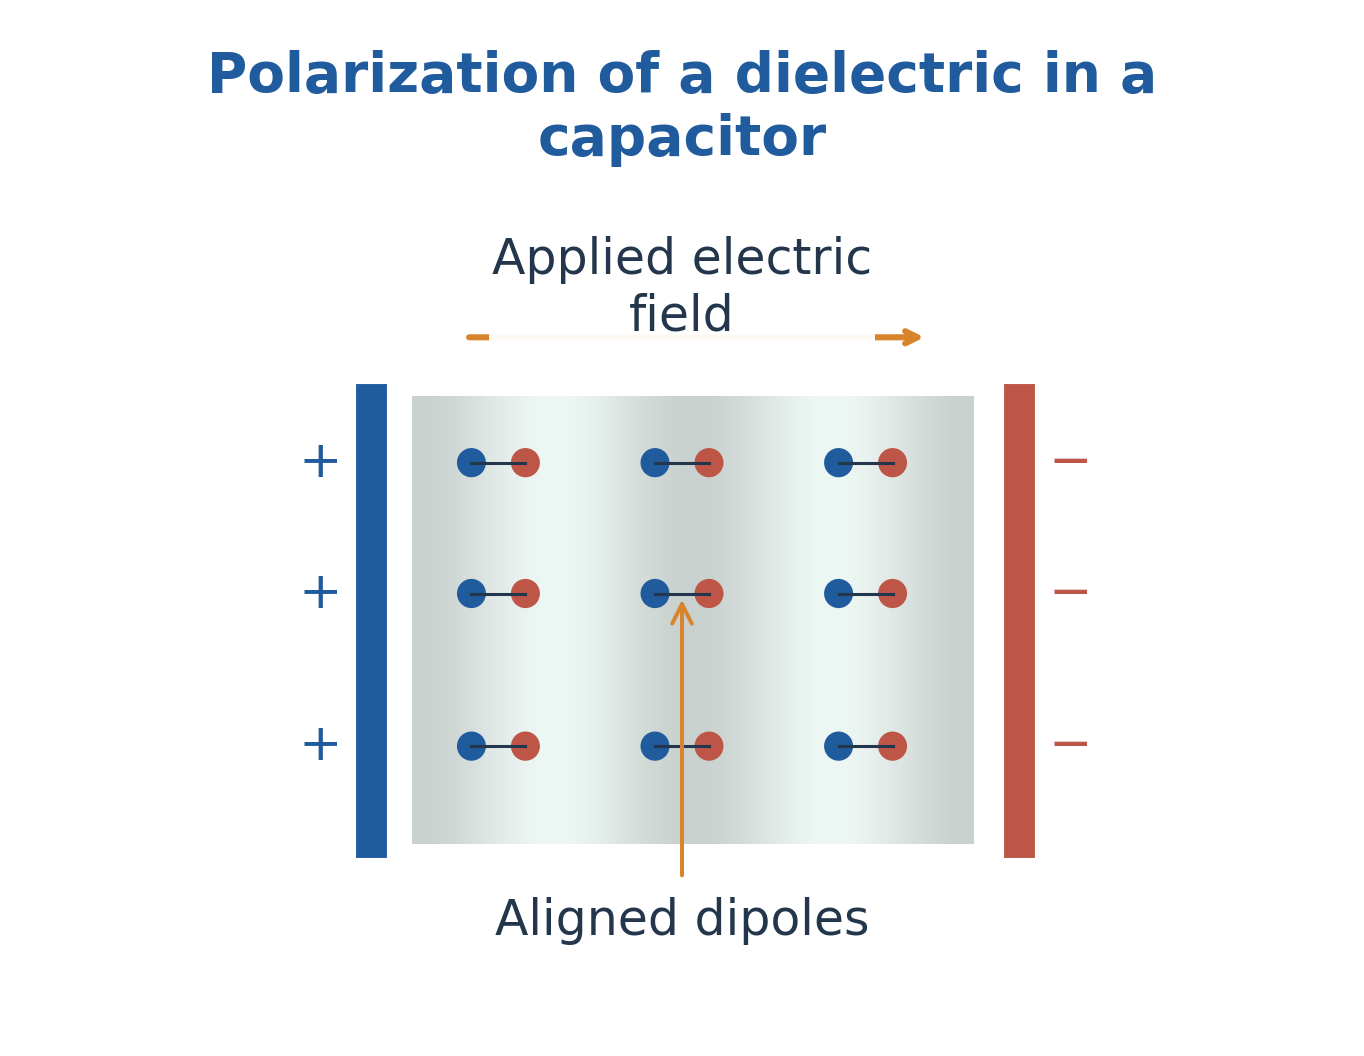
For a fully filled ideal parallel-plate model:
C = epsilon0 epsilon_r A/d
At maintained voltage:
Q = CV
U = CV²/2
At fixed charge:
U = Q²/(2C)
Energy comparison depends on what is maintained.
Geometry, defects, moisture, temperature and frequency influence selection.
Worked Problem 3.9: Capacitance
Problem: A = 0.010 m², d = 1 mm and relative permittivity = 4. Use epsilon0 = 8.854 × 10^-12 F/m.
Solution:
d = 0.001 m
C = 8.854 × 10^-12 × 4 × 0.010/0.001
C = 3.5416 × 10^-10 F
Answer: Capacitance is 354.16 pF, neglecting fringing.
Worked Problem 3.10: Stored Energy
Problem: The 354.16 pF capacitor is held at 100 V.
Solution:
U = CV²/2
U = 354.16 × 10^-12 × 100²/2
U = 1.7708 × 10^-6 J
Answer: Stored energy is 1.7708 microjoules.
The result does not independently establish breakdown performance.
10. Ferroelectric and Piezoelectric Materials
Study route: EE and ECE
Piezoelectricity couples mechanical stress and electrical polarization. The converse effect produces strain under an electric field.
Crystal symmetry and processing matter. Some ceramic systems require poling.
Ferroelectrics possess spontaneous polarization that can be switched by an appropriate field.
Not every piezoelectric is ferroelectric.

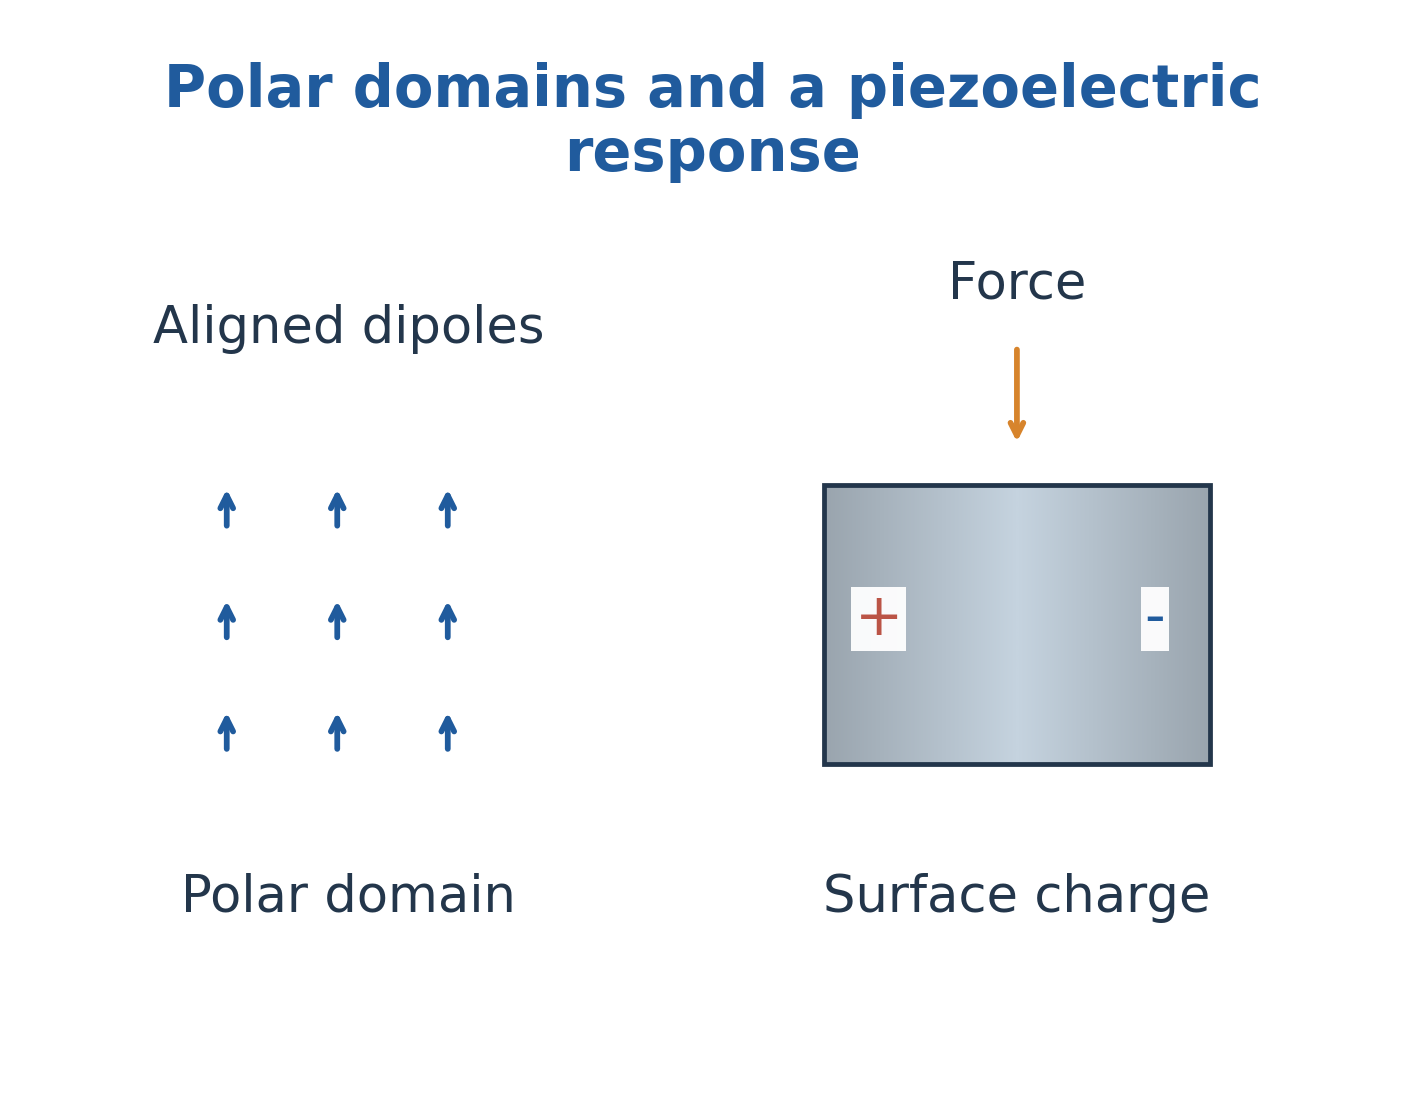
BaTiO3 and PZT are important ceramic examples.
Composition, temperature and domains control response.
A polarization-field loop identifies remanent polarization and coercive field.
Applications include transducers, actuators, sensors and dielectric components.
Keep electric-polarization switching separate from ferromagnetic ordering.
Worked Problem 3.11: Charge Sensitivity
Problem: An element produces 300 pC under 5 N in the supplied linear test.
Solution:
Charge sensitivity = 300/5 = 60 pC/N
Answer: Sensitivity is 60 pC/N.
Voltage additionally requires capacitance and circuit information.
11. Liquid Crystals and LCD Operation
Study route: EE and ECE
Liquid crystals combine fluidity with orientational order.
In a nematic phase, molecular long axes have a preferred average direction called the director.
Surface alignment, temperature, composition and electric field influence organization.
The director is an average orientation, not a rigid bond joining every molecule.

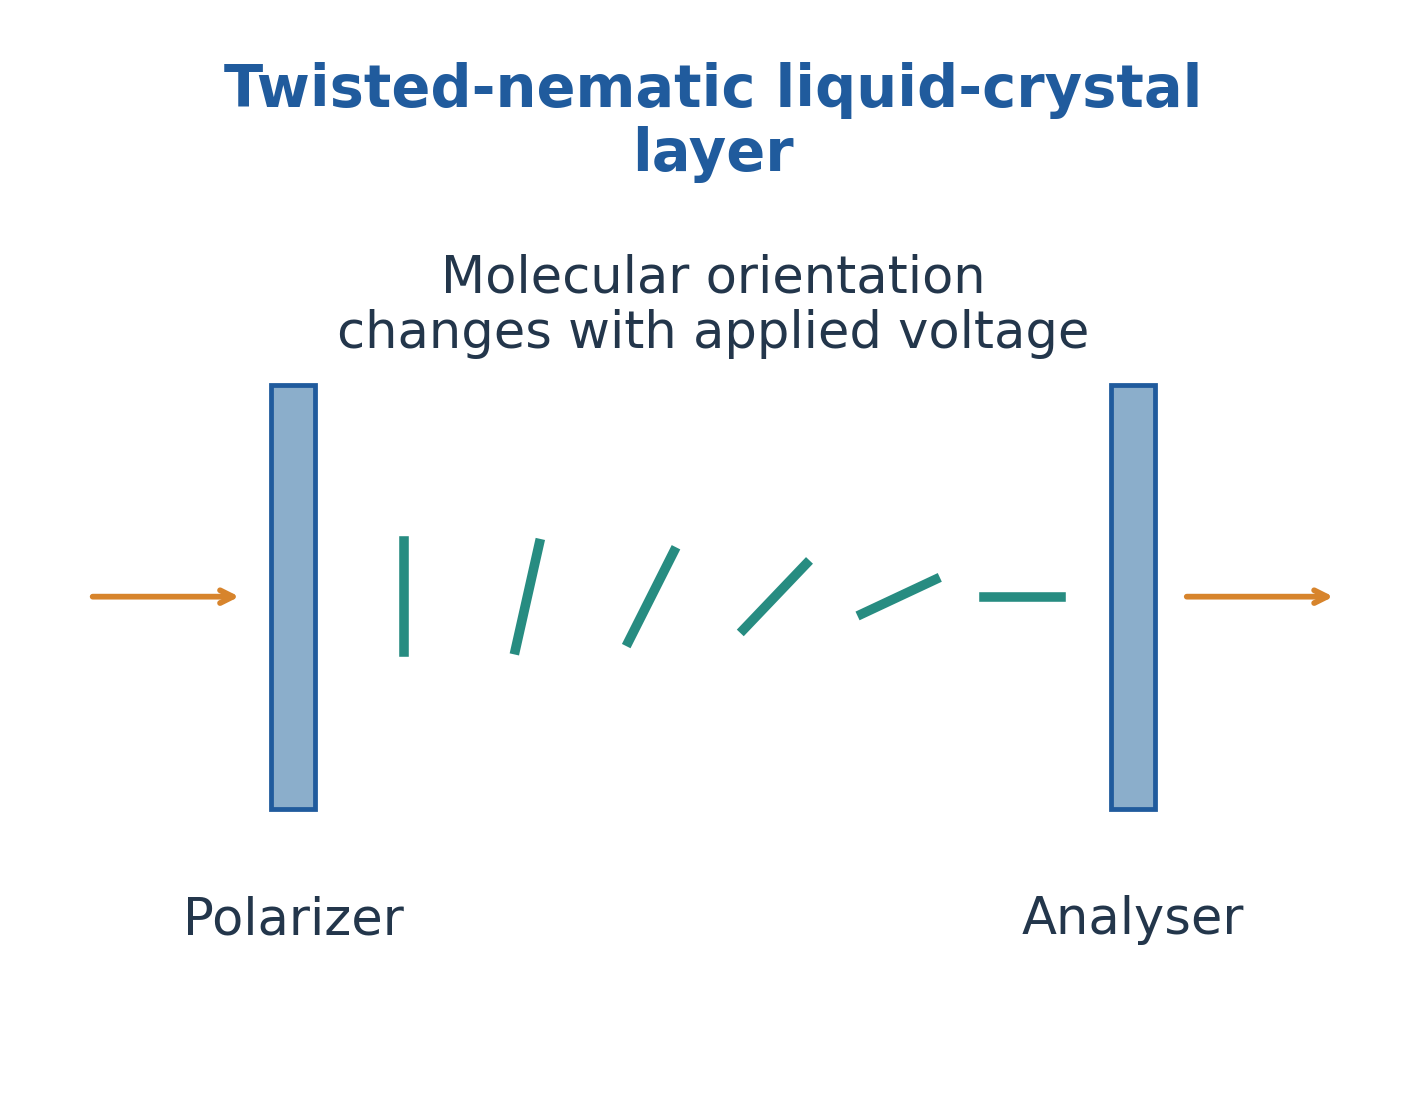
An ordinary LCD modulates light from a backlight or external source.
Transparent electrodes, alignment layers, polarizers and sealing materials have different roles.
The liquid crystal does not ordinarily generate the display’s light by electroluminescence.
Worked Problem 3.12: LCD and OLED
Problem: Why does an ordinary LCD need a light source while an OLED emits light?
Solution:
LCD operation changes transmission through alignment and polarizers.
OLED operation produces photons through electrically excited organic states.
Answer: LCDs modulate light; OLEDs generate light through electroluminescence.
12. Electroluminescence, LEDs and Phosphors
Study route: EE and ECE
Electroluminescence is light generation following electrical excitation.
In an LED, injected electrons and holes can recombine radiatively.
Composition and electronic structure influence emission energy. Defects, temperature, nonradiative pathways and extraction influence useful output.
Photon energy = hc/lambda

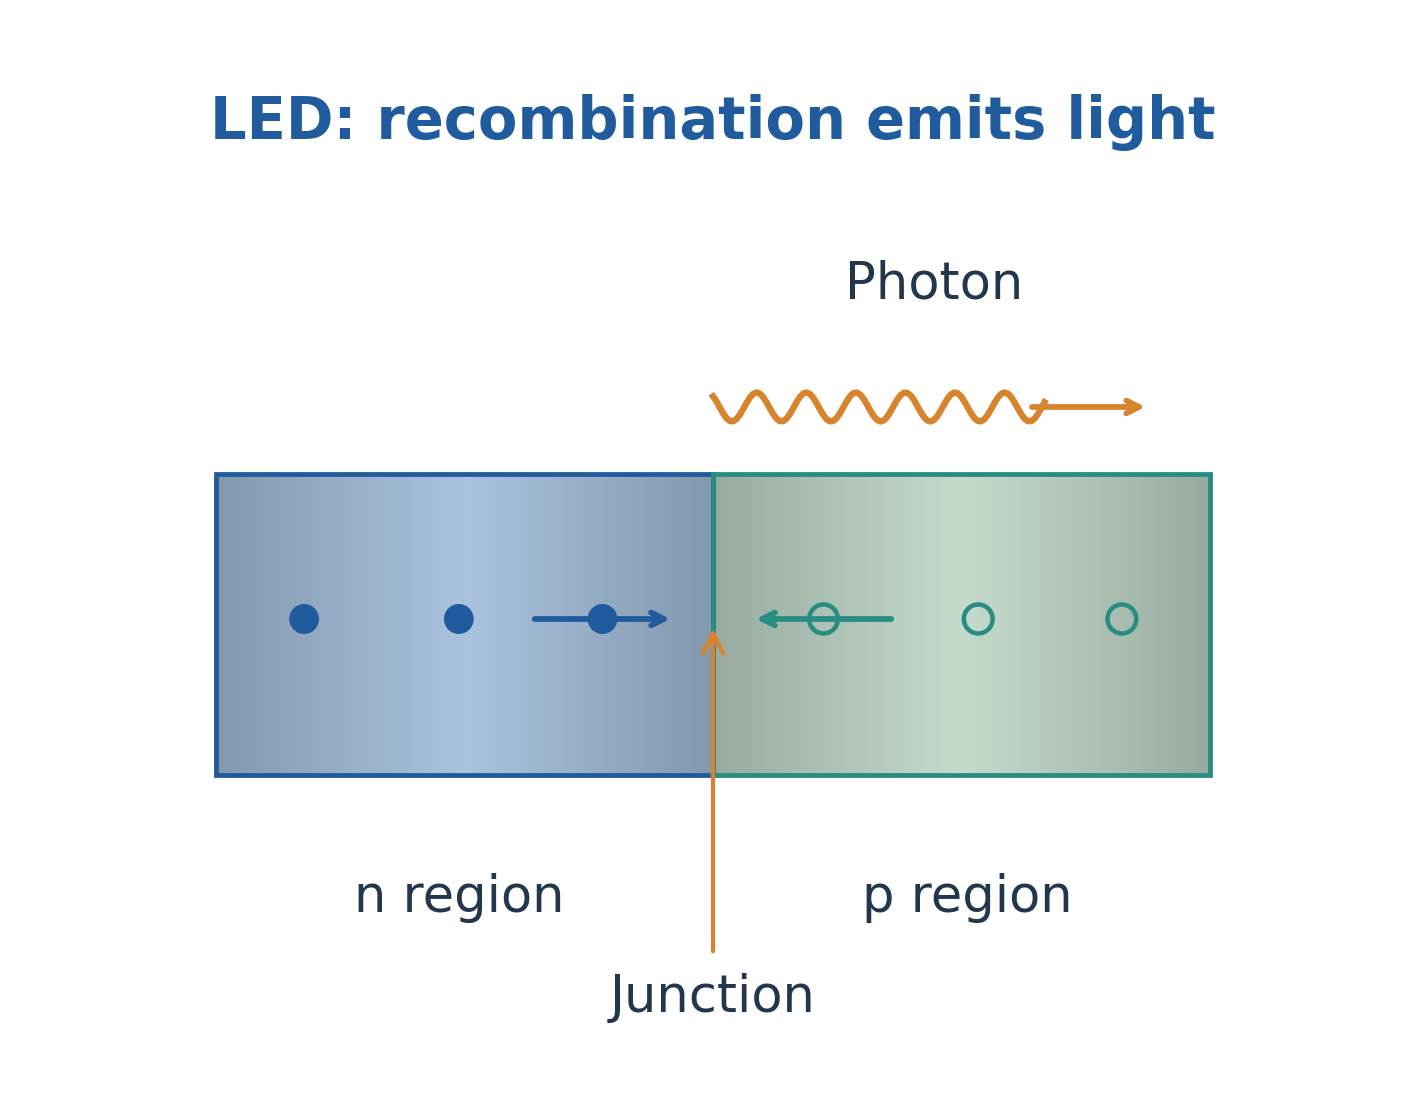

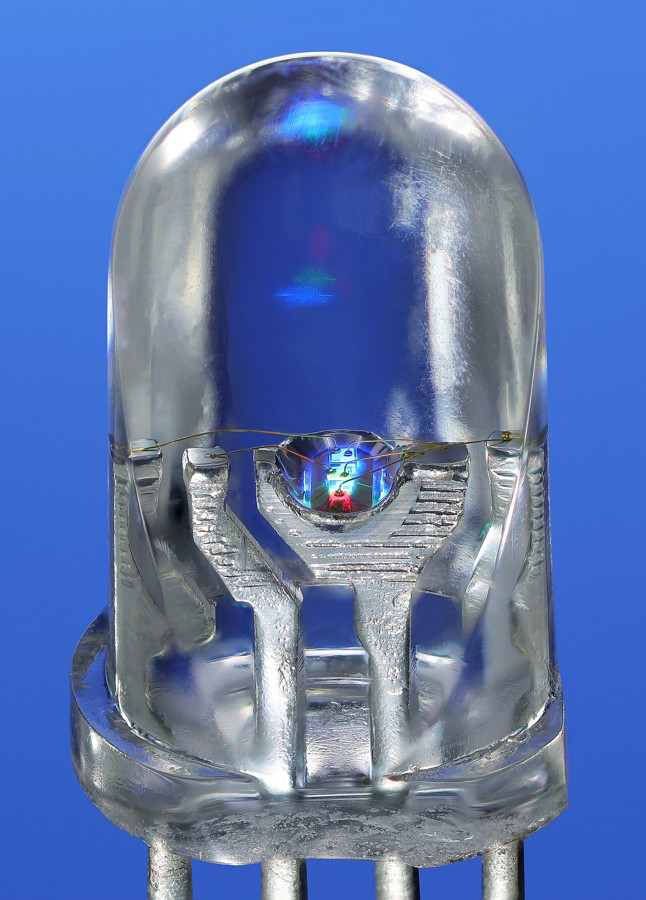
Phosphors absorb excitation and emit through suitable luminescent centres or host-dopant systems.
They can convert part of a source spectrum.
A phosphor and LED junction therefore have different roles even when combined.
Colour, conversion efficiency and stability need separate evaluation. Brightness alone does not determine electrical efficiency or long-term colour stability.
13. Magnetic Materials: Ferrites and Rare-Earth Magnets
Study route: EE and ECE
Magnetic response depends on electronic moments, ordering and domains.
Ferrites are iron-oxide-based ceramic magnetic materials with useful resistivity and composition-dependent frequency response.
Soft magnetic materials suit repeated flux changes with appropriate low coercivity and loss.
Hard magnets retain magnetization and resist demagnetization.

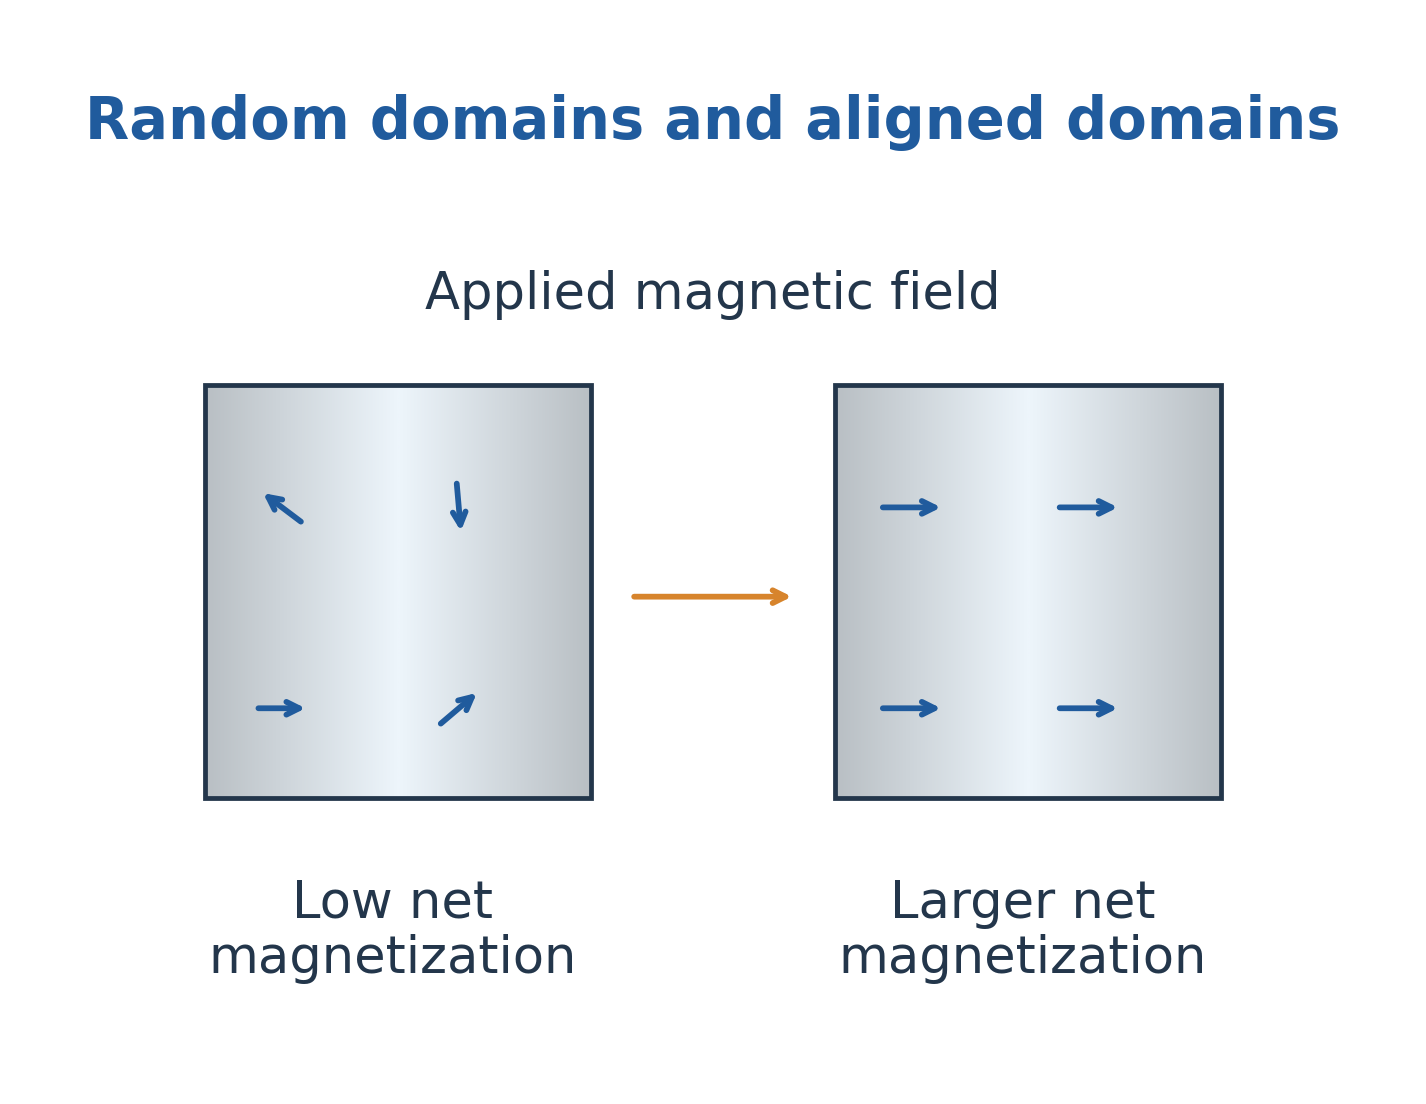
Nd-Fe-B systems provide strong permanent-magnet behaviour with temperature, corrosion and supply considerations.
Remanence, coercivity, saturation and permeability are different quantities.
A suitable B-H loop area gives hysteretic energy loss per cycle per volume.
Core selection balances saturation, loss, frequency and temperature.
Worked Problem 3.13: Loss Power
Problem: A core loses 0.20 J per cycle at 50 Hz.
Solution:
Power = Energy per cycle × Frequency
Power = 0.20 × 50 = 10 W
Answer: Average loss power is 10 W.
The supplied total cannot be assigned entirely to hysteresis without separating other contributions.
14. Optical Materials, Fibres and Magneto-Optical Communication
Study route: EE and ECE
Optical materials transmit, absorb, emit, guide or modulate light.
A conventional fibre uses a higher-index core and lower-index cladding.
Absorption, scattering, interfaces and defects influence attenuation.
Transparency at one wavelength does not establish useful transmission at all wavelengths.


Magneto-optical materials change optical behaviour under magnetic influence.
Faraday rotation supports nonreciprocal components such as optical isolators.
This is not simply bending a light ray with an ordinary magnet.
A complete application connects material interaction, optical arrangement and communication function.
Selecting a Functional Electronic Material
Begin with the required function.
A dielectric must control storage, loss, leakage and breakdown. A piezoelectric must provide suitable mechanical-electrical coupling.
An LCD modulates light. An LED emits it. A phosphor converts excitation into another spectrum.
A soft magnetic core and permanent magnet require different responses.
An optical fibre needs index control and low loss.
A favourable result in one measurement does not establish all these properties.
Worked Problem 3.14: Numerical Aperture
Problem: Core index is 1.50 and cladding index 1.47 for an ideal step-index fibre in air.
Solution:
NA = sqrt(1.50² – 1.47²)
NA = sqrt(2.25 – 2.1609)
NA = 0.2985
Acceptance half-angle = arcsin(0.2985) ≈ 17.4 degrees
Answer: Numerical aperture is 0.2985, with acceptance half-angle approximately 17.4 degrees.
15. Lubrication Regimes and Viscosity
Study route: ME
Lubricants reduce friction and wear through fluid-film separation or protective boundary interactions.
Hydrodynamic lubrication supports load through a moving fluid film.
Boundary lubrication relies strongly on surface films. Mixed lubrication includes both contributions.
Oils, greases and solids serve different operating conditions.

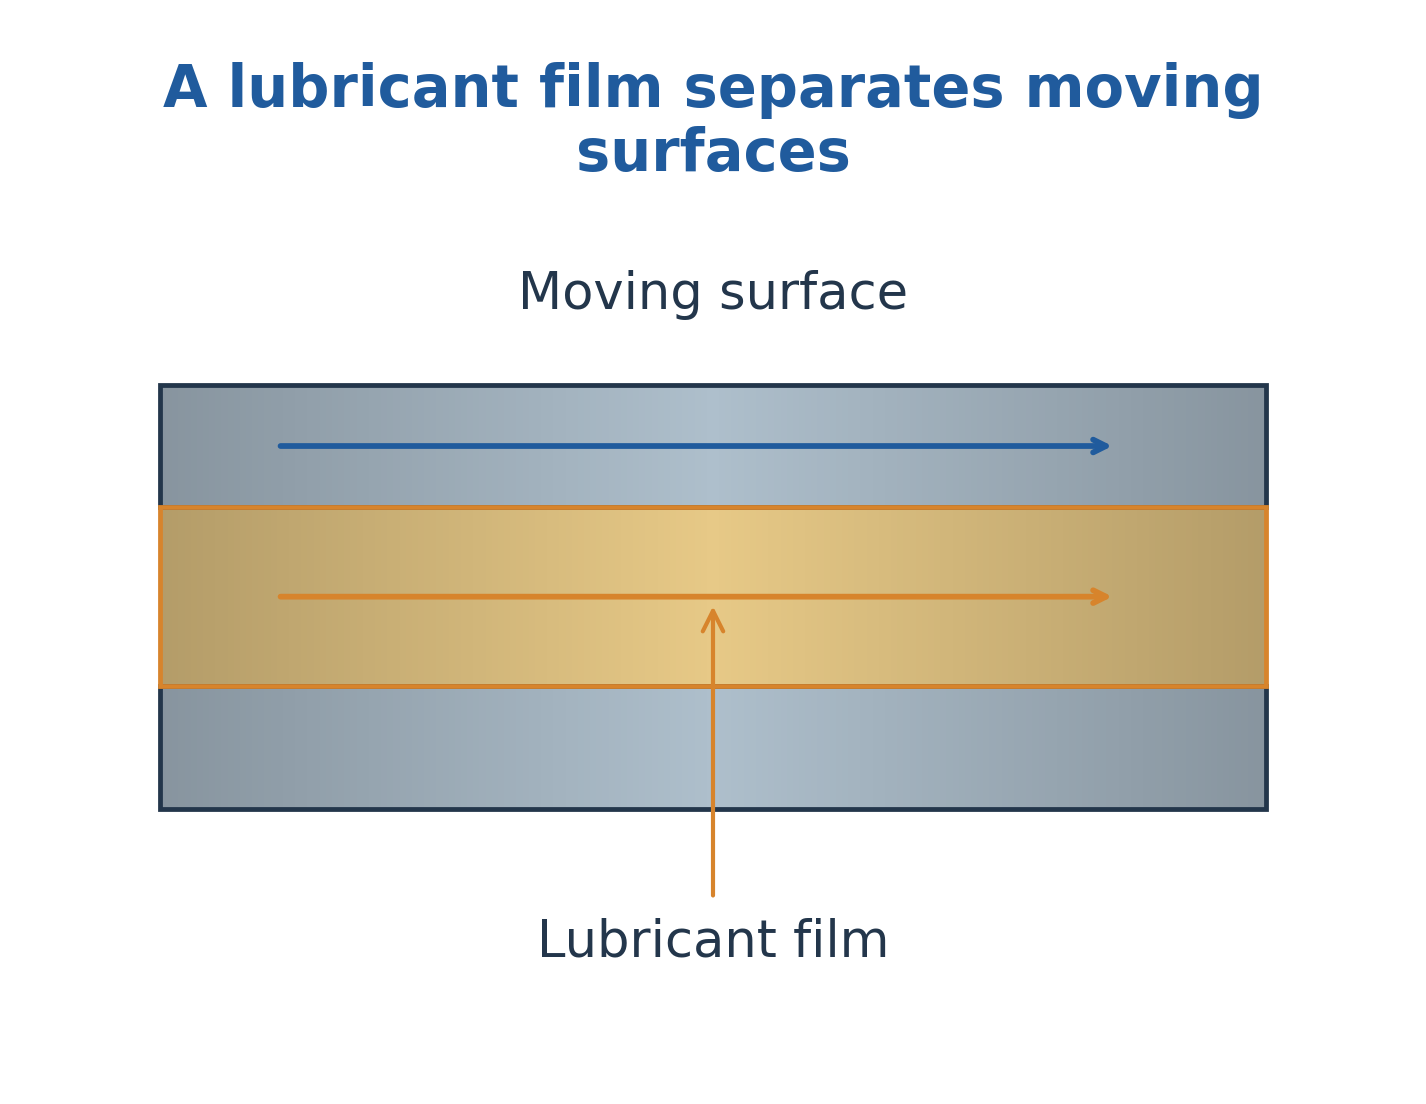
Dynamic viscosity measures resistance to shear.
Kinematic viscosity = Dynamic viscosity / Density
Both require temperature.
Viscosity index describes relative temperature sensitivity under a defined comparison.
High viscosity can increase drag or hinder low-temperature delivery. Selection balances film support, flow and thermal behaviour.
Worked Problem 3.15: Kinematic Viscosity
Problem: Dynamic viscosity is 0.080 Pa s and density is 800 kg/m³.
Solution:
nu = 0.080/800 = 1.0 × 10^-4 m²/s
nu = 100 mm²/s
Answer: Kinematic viscosity is 100 cSt, at the stated measurement temperature.
16. Lubricant Properties, Additives and Solid Lubricants
Study route: ME
Flash point is a test-defined temperature at which vapour ignites momentarily.
Fire point concerns sustained burning under the specified procedure.
Pour point describes a defined low-temperature flow limit.
These tests are different from viscosity and chemical stability.


Anti-wear additives support protective films. Antioxidants slow oxidation. Extreme-pressure additives operate under severe compatible contacts.
Graphite, MoS2 and PTFE provide different low-shear mechanisms.
Grease combines lubricating fluid with a thickening system.
Contamination, oxidation products and compatibility affect performance.
More additive or a higher flash point does not automatically improve the complete lubrication duty.
17. Fuel Classification and Calorific Values
Study route: ME
Fuels release useful energy through suitable conversion processes.
Solid, liquid and gaseous fuels differ in storage, handling, combustion and residue.
A good fuel combines useful energy with controllable ignition, availability, storage and manageable emissions.
Heating value alone is not a complete selection criterion.

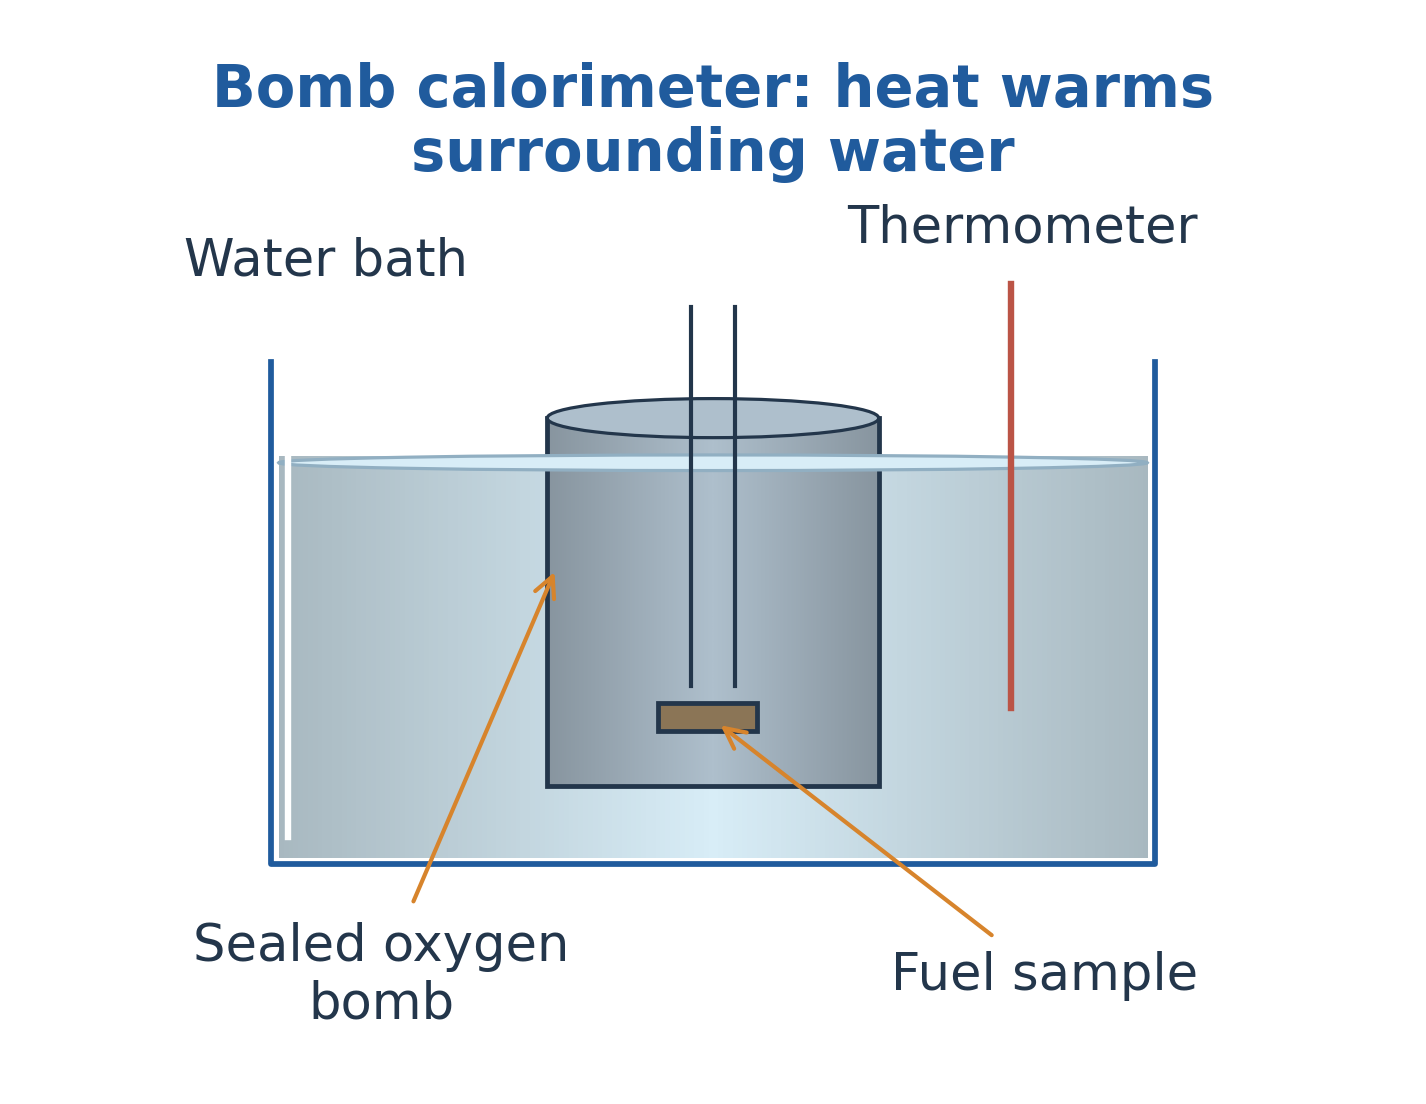
HCV includes heat recovered when product water condenses.
LCV excludes that latent-heat recovery.
Hydrogen-derived water and initial moisture must use a consistent basis.
Heat input = Fuel mass × Calorific value
Useful heat = Efficiency × Heat input
Worked Problem 3.16: Fuel Requirement
Problem: LCV is 40 MJ/kg. Deliver 120 MJ useful heat at 75% efficiency.
Solution:
Input heat = 120/0.75 = 160 MJ
Fuel mass = 160/40 = 4 kg
Answer: Fuel requirement is 4 kg.
Worked Problem 3.17: HCV to LCV
Problem: Dry fuel contains ten percent hydrogen. HCV is 40 MJ/kg and water latent heat is 2.4 MJ/kg. Ignore initial moisture.
Solution:
Water formed = 9 × 0.10 = 0.90 kg/kg fuel
Latent heat excluded = 0.90 × 2.4 = 2.16 MJ/kg
LCV = 40 – 2.16 = 37.84 MJ/kg
Answer: LCV is 37.84 MJ/kg.
18. Coal: Proximate and Ultimate Analysis
Study route: ME
Proximate analysis reports moisture, volatile matter, ash and fixed carbon under a defined procedure.
Fixed carbon is commonly obtained by difference on one consistent basis.
Moisture affects useful heat and handling. Volatiles influence ignition and combustion. Ash contributes residue.
Fixed carbon is not the same as elemental carbon.

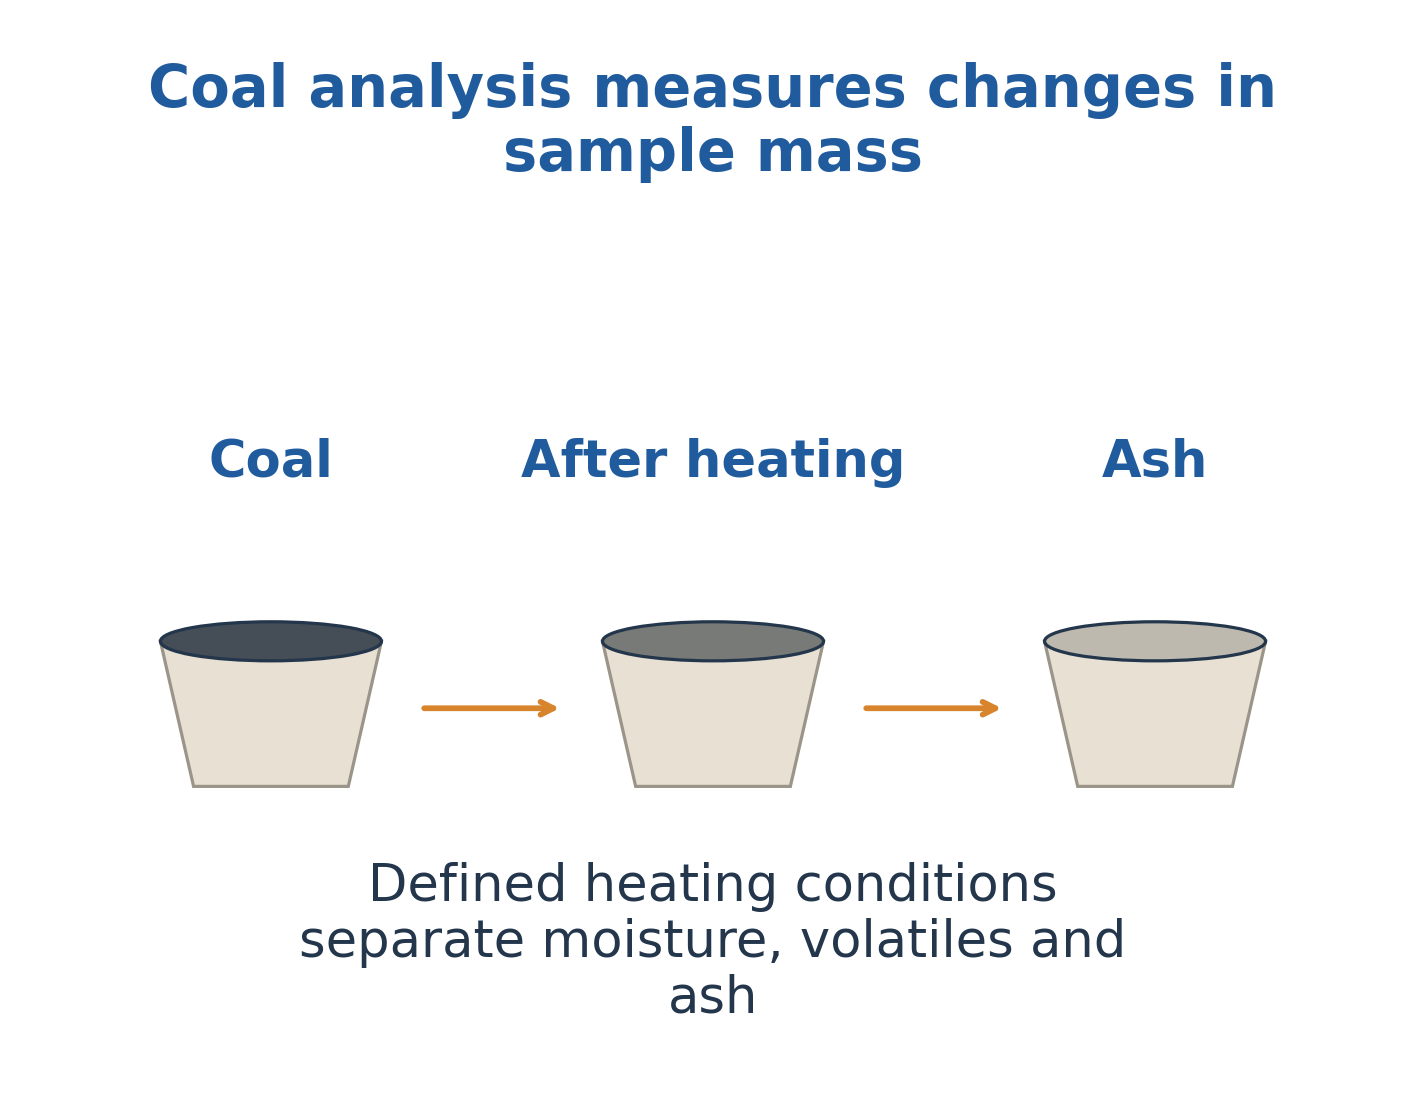

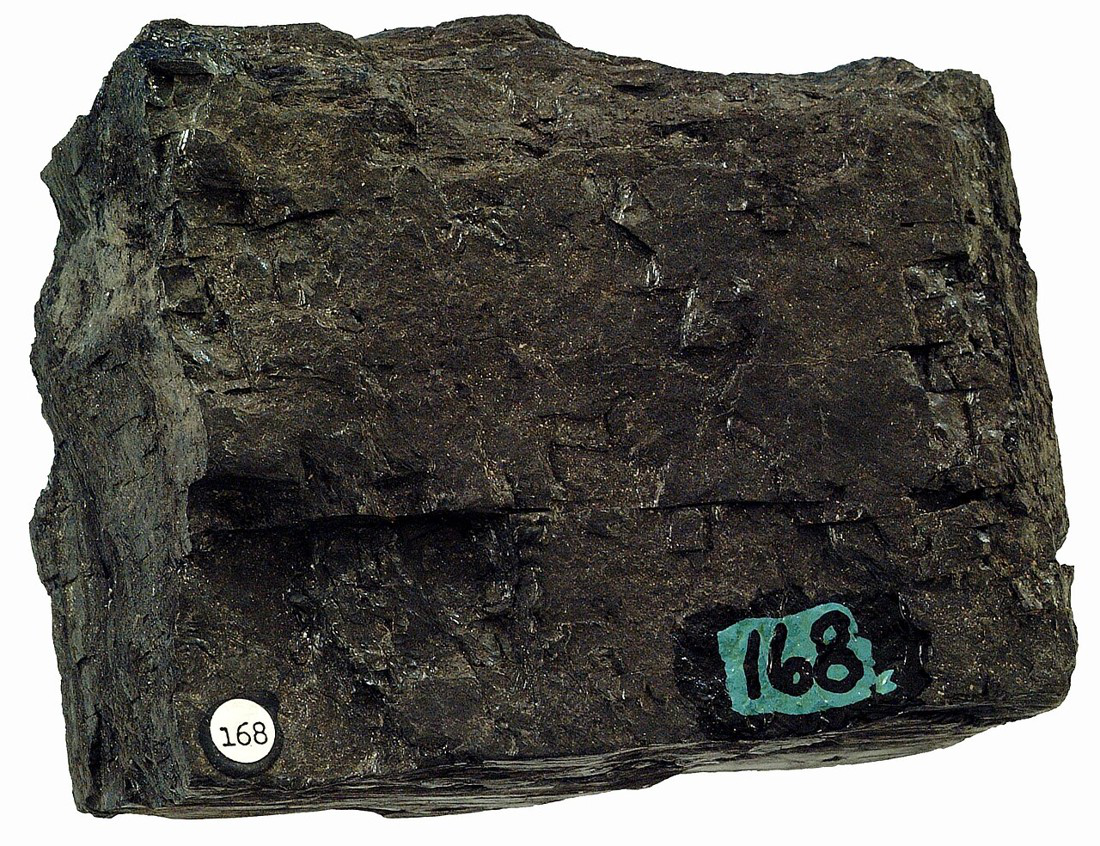
Ultimate analysis determines elemental composition such as C, H, N and S.
It supports oxygen and product balances.
As-received, dry and dry-ash-free bases differ.
Do not combine percentages from different bases in a subtraction or empirical relation.
Worked Problem 3.18: Fixed Carbon
Problem: Moisture is five percent, volatiles thirty percent and ash fifteen percent on one basis.
Solution:
Fixed carbon = 100 – 5 – 30 – 15
Fixed carbon = 50%
Answer: Fixed carbon is 50% on the stated basis.
19. Octane and Cetane
Study route: ME
Octane number characterizes knock resistance in a specified spark-ignition reference test.
Cetane number characterizes ignition quality or delay in a compression-ignition comparison.
They describe different engine processes and are not interchangeable energy ratings.

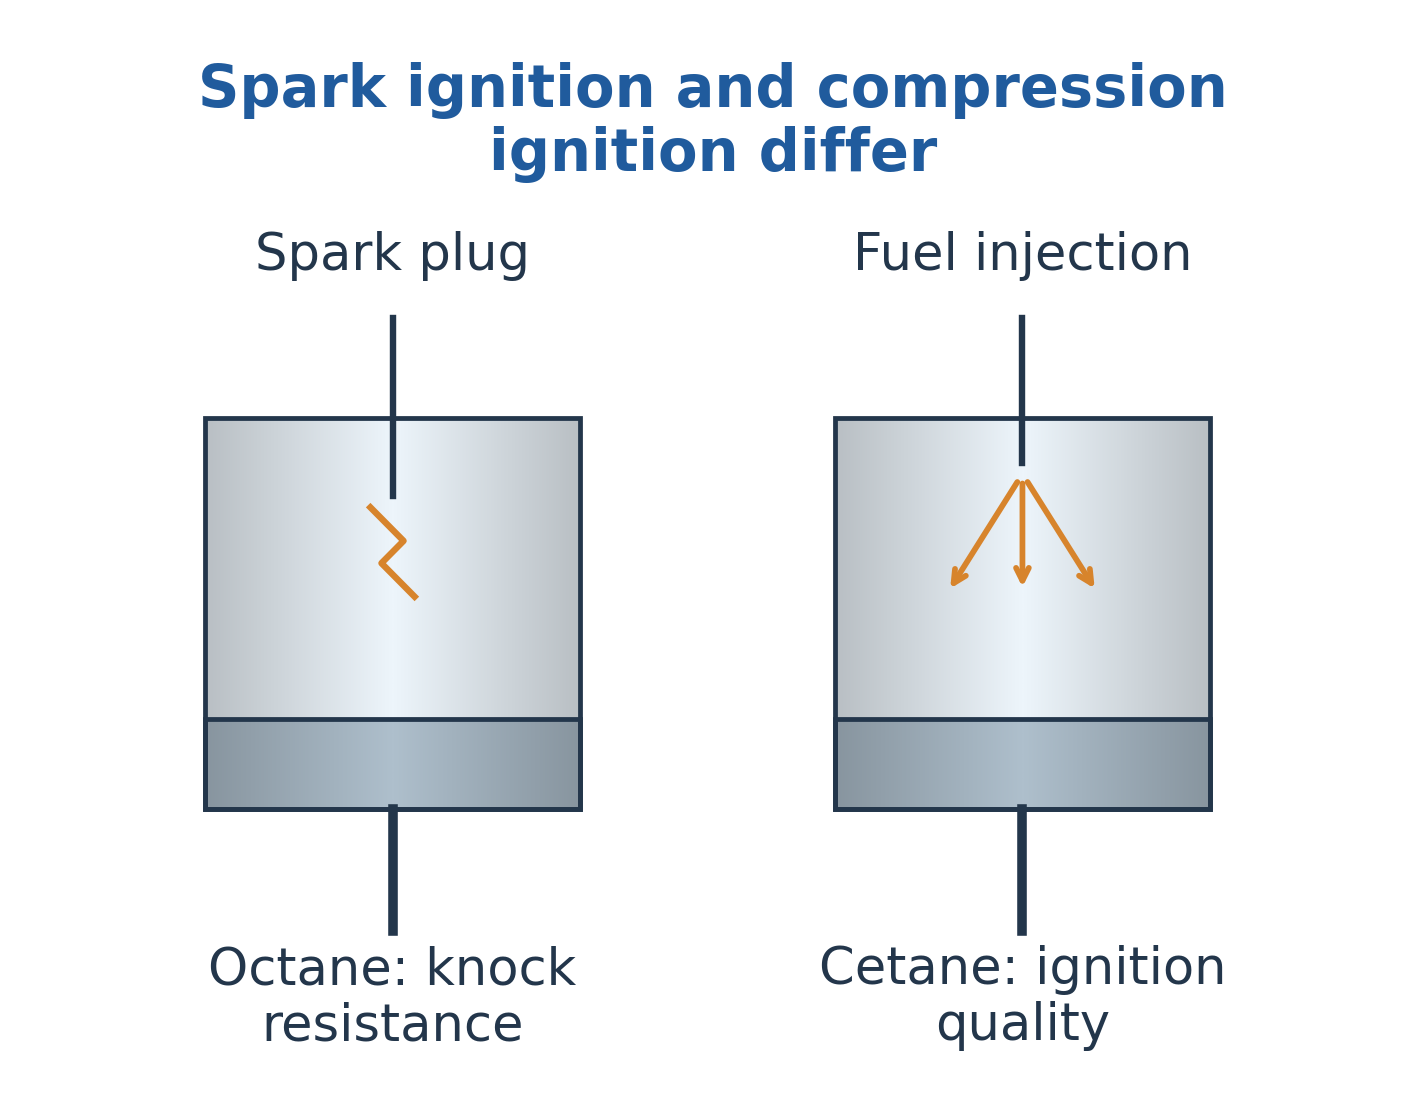
Molecular structure, volatility, composition and engine conditions affect combustion.
Reference scales describe equivalent behaviour rather than the actual composition of every commercial fuel.
A high-octane fuel is not automatically the fuel with greatest calorific value.
Worked Problem 3.19: Octane Interpretation
Problem: A fuel has octane number ninety. Does it contain exactly ninety percent isooctane?
Solution:
The rating compares knock resistance with a reference blend.
It does not establish actual composition.
Answer: No. It matches the stated reference behaviour of ninety percent isooctane and ten percent n-heptane in the specified test.
20. Biofuels and Biogas Manufacture
Study route: ME
Biodiesel consists mainly of fatty-acid alkyl esters made through suitable transesterification of oils or fats with alcohol.
Glycerol is a co-product. Water and free-fatty-acid content affect processing.
Bioethanol can be produced through fermentation of accessible sugars followed by recovery and purification.
Feed preparation, yield and energy demand matter.

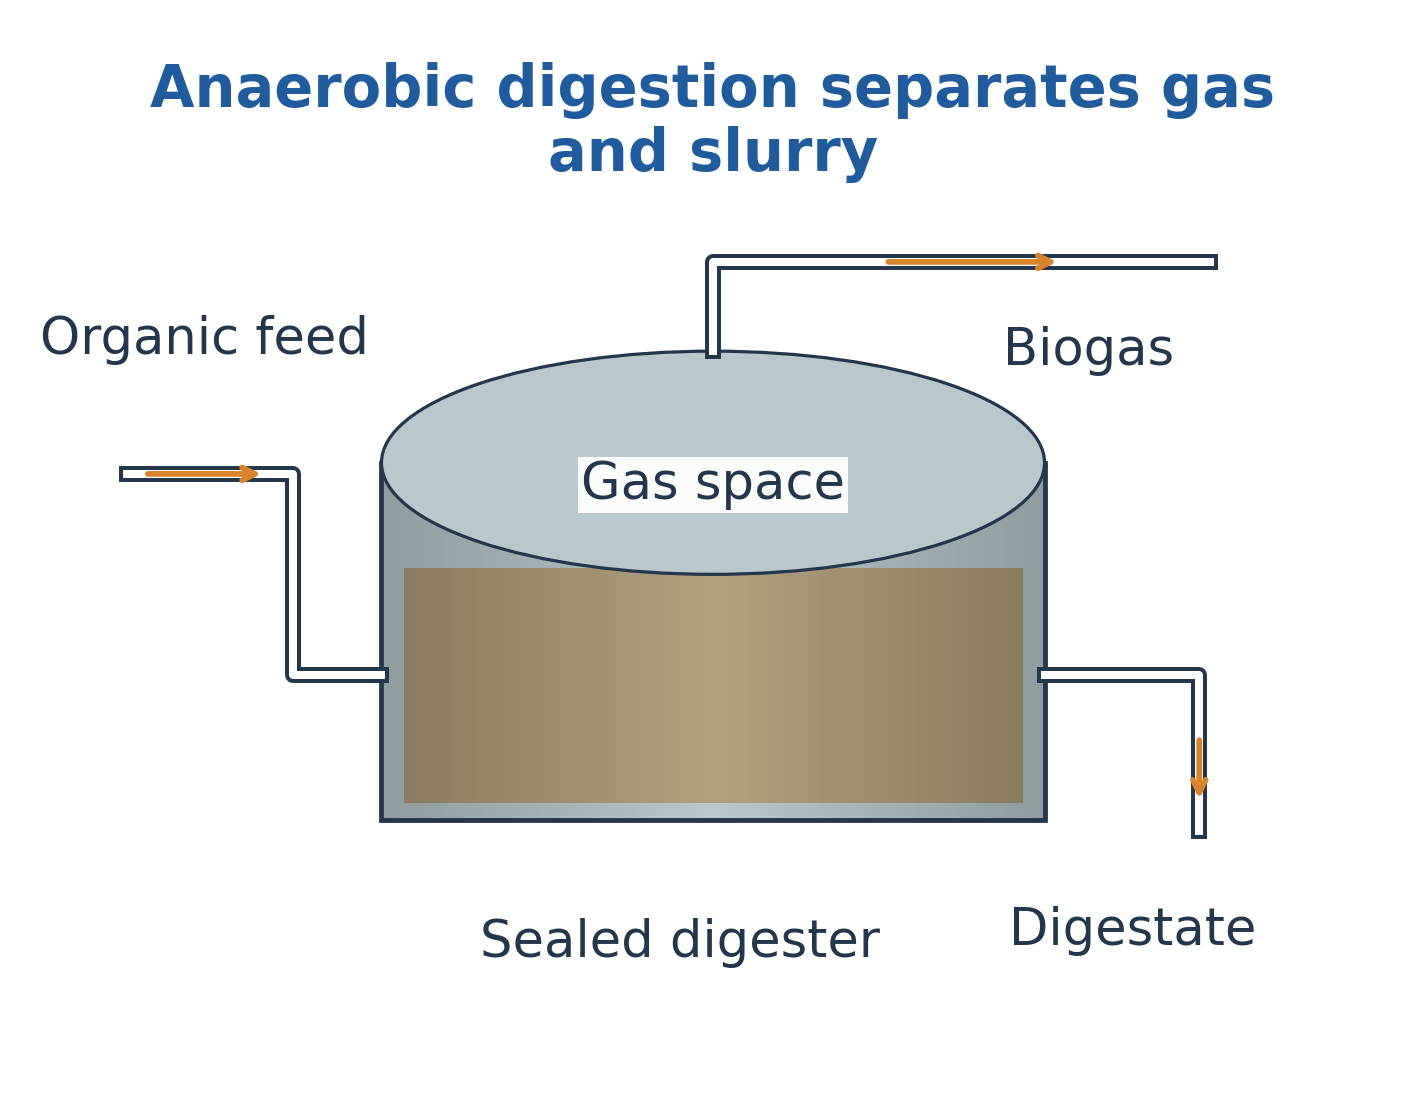
Biogas production involves hydrolysis, acidogenesis, acetogenesis and methanogenesis.
The digester needs suitable feed, oxygen exclusion, gas collection and digestate handling.
Biogas mainly contains methane and carbon dioxide with variable impurities.
Renewable origin does not imply zero processing burden.
Fuel and Lubricant Interpretation
For consistent hydrogen and moisture fractions:
LCV = HCV – (9wH + wM)Lv
Do not mix dry hydrogen data with as-received heating value without conversion.
Proximate and ultimate analyses describe different quantities.
Octane and cetane describe ignition rather than heat.
Lubricant viscosity, viscosity index, flash point and pour point likewise answer different questions.
Worked Problem 3.20: Biogas Energy
Problem: Biogas flow is 10 m³/h, methane fraction 0.60 and methane heating value 35 MJ/m³ at matching conditions.
Solution:
Methane flow = 10 × 0.60 = 6 m³/h
Fuel energy = 6 × 35 = 210 MJ/h
Thermal power = 210/3.6 = 58.3 kW
Answer: Gross energy is 210 MJ/h, equivalent to 58.3 kW thermal.
21. Water Properties, Hardness and Alkalinity
Study route: CE
Water polarity and hydrogen bonding influence solvent and thermal behaviour.
Dissolved salts, gases and suspended matter determine engineering suitability.
Hardness mainly arises from calcium and magnesium.
Temporary hardness relates to bicarbonate chemistry affected by boiling. Permanent hardness is not removed simply by boiling.

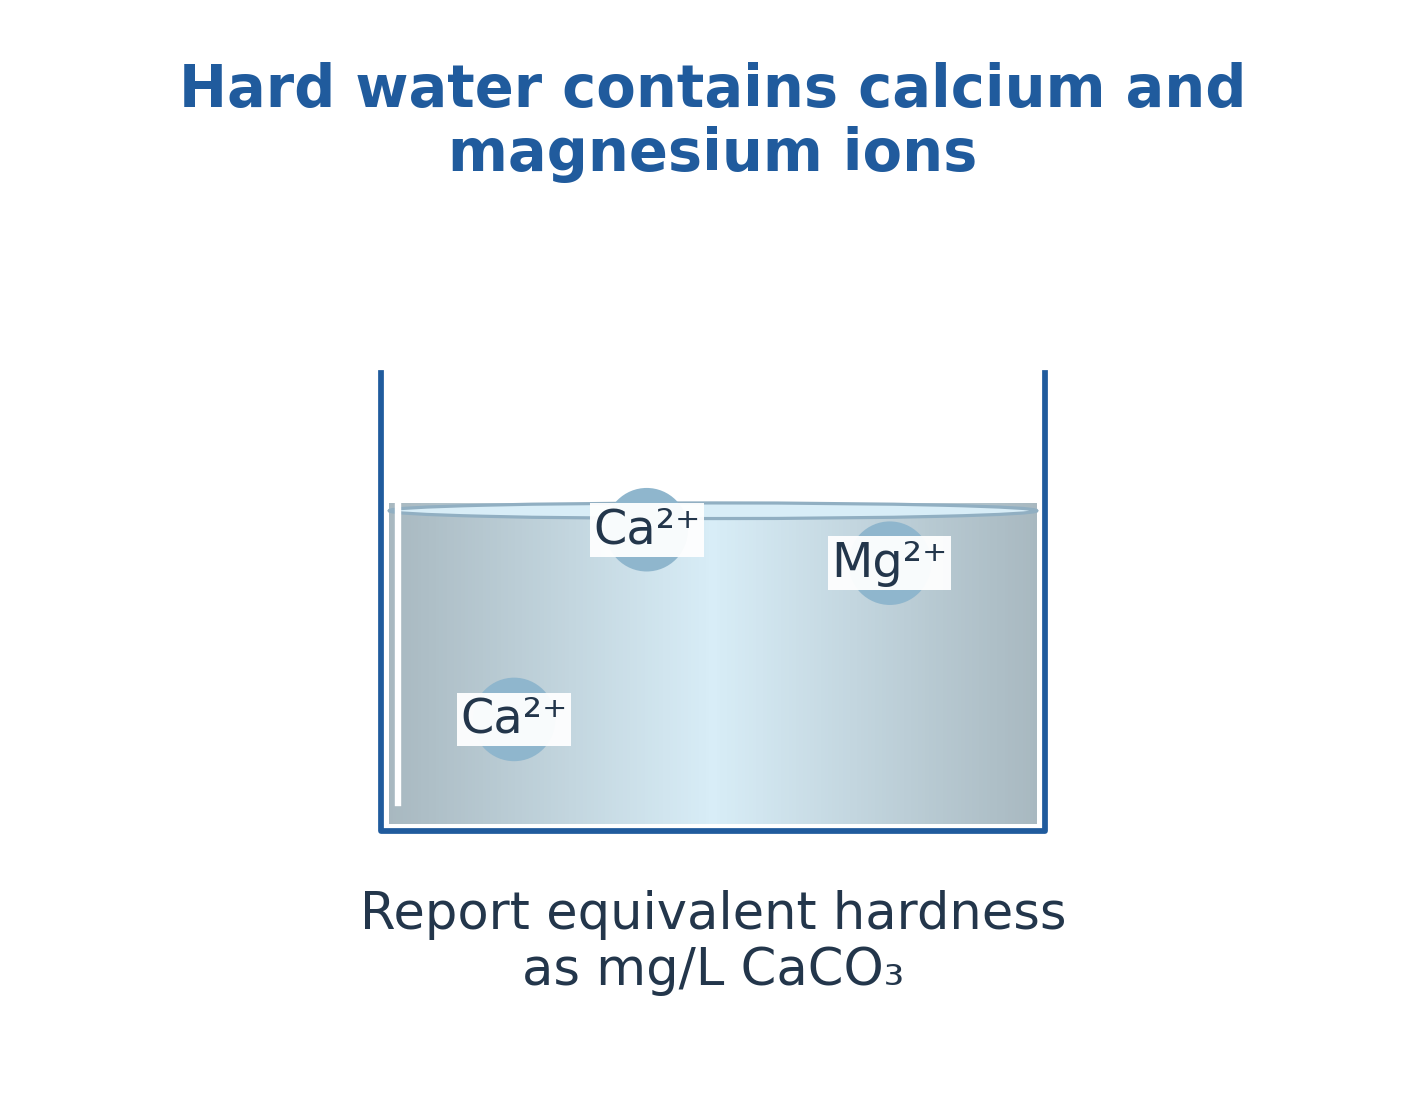
CaCO3 equivalent = Ion mg/L × 50/Equivalent weight
Alkalinity measures acid-neutralizing capacity. pH measures hydrogen-ion activity.
These are related chemically but not interchangeable.
A clear sample can retain substantial dissolved material.
Worked Problem 3.21: Total Hardness
Problem: Calcium is 40 mg/L and magnesium 24 mg/L. Equivalent weights are twenty and twelve.
Solution:
Calcium contribution = 40 × 50/20 = 100 mg/L
Magnesium contribution = 24 × 50/12 = 100 mg/L
Total = 200 mg/L as CaCO3
Answer: Total hardness is 200 mg/L as CaCO3.
22. DO, BOD, COD and Turbidity
Study route: CE
DO is oxygen present in water.
BOD estimates biological oxygen demand over a defined test. COD measures oxidation demand using a specified chemical procedure.
A common BOD5 convention uses five-day incubation, but protocol and corrections remain part of the result.

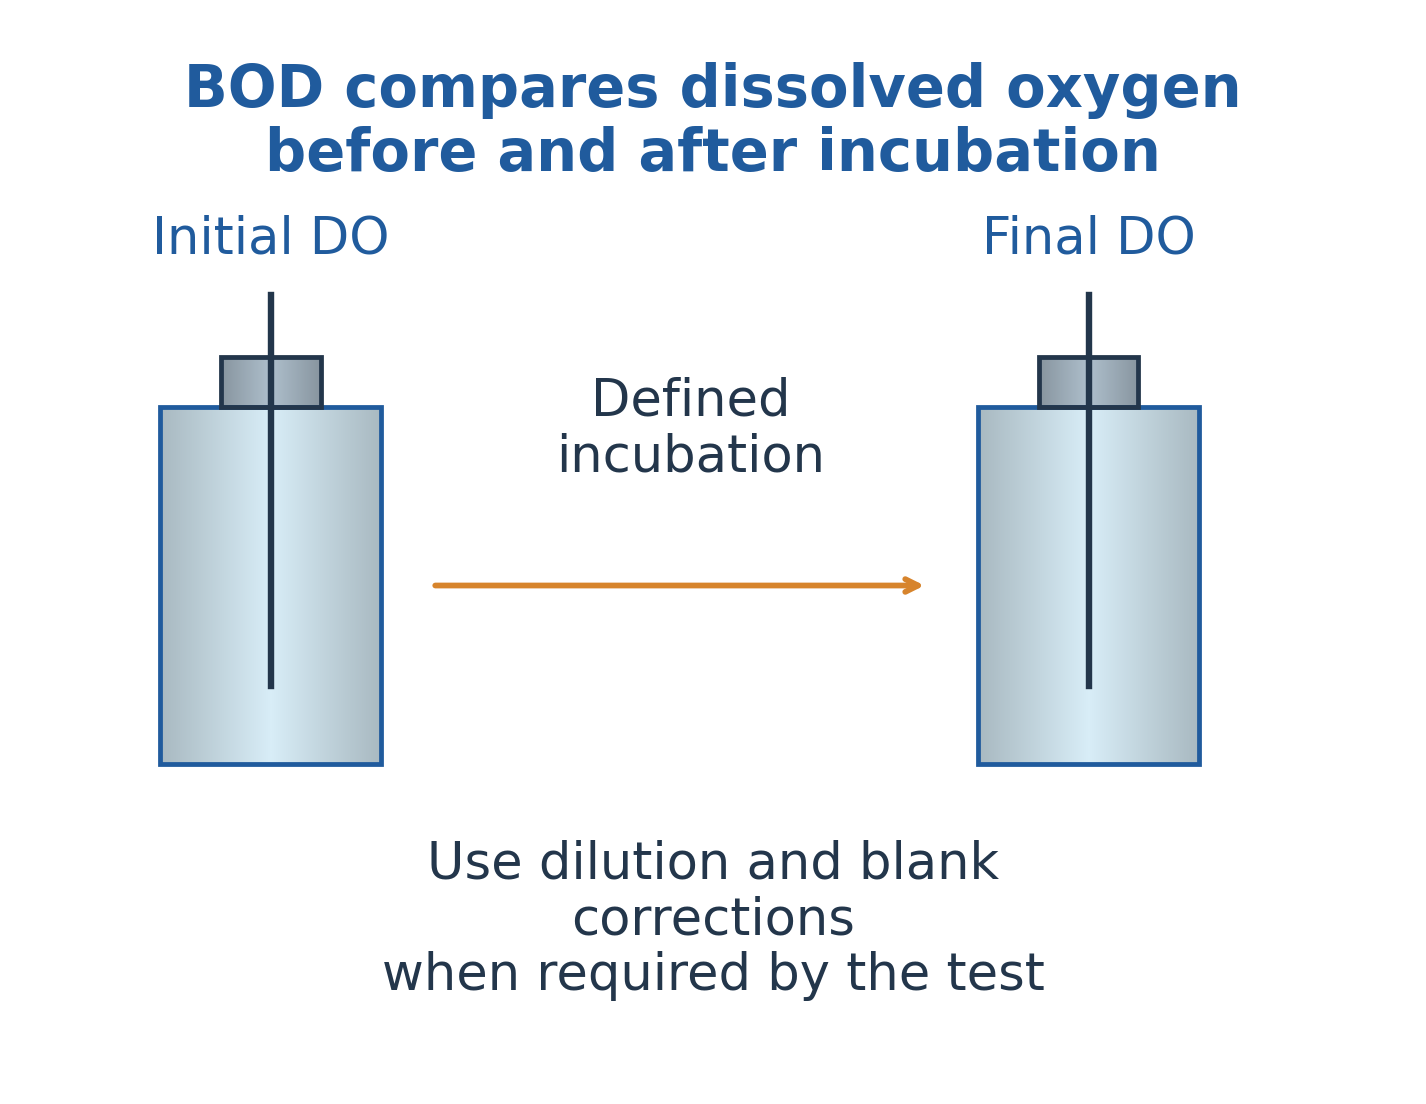


Turbidity concerns light scattering by suspended matter.
It can affect treatment but is not every dissolved contaminant’s concentration.
DO, BOD, COD and turbidity do not independently prove pathogen absence.
Worked Problem 3.22: Dilution BOD
Problem: Initial DO is 8.0 mg/L and final DO 3.0 mg/L, with sample fraction 0.10 and no supplied correction.
Solution:
BOD = (8.0 – 3.0)/0.10
BOD = 50 mg/L
Answer: BOD is 50 mg/L under the stated test.
23. Coagulation, Flocculation, Sedimentation and Filtration
Study route: CE
Coagulation destabilizes fine colloids through suitable chemical and electrostatic changes.
Flocculation uses gentler mixing to develop larger aggregates.
Sedimentation removes settleable material. Filtration captures suitable remaining fractions.
These stages perform different functions.

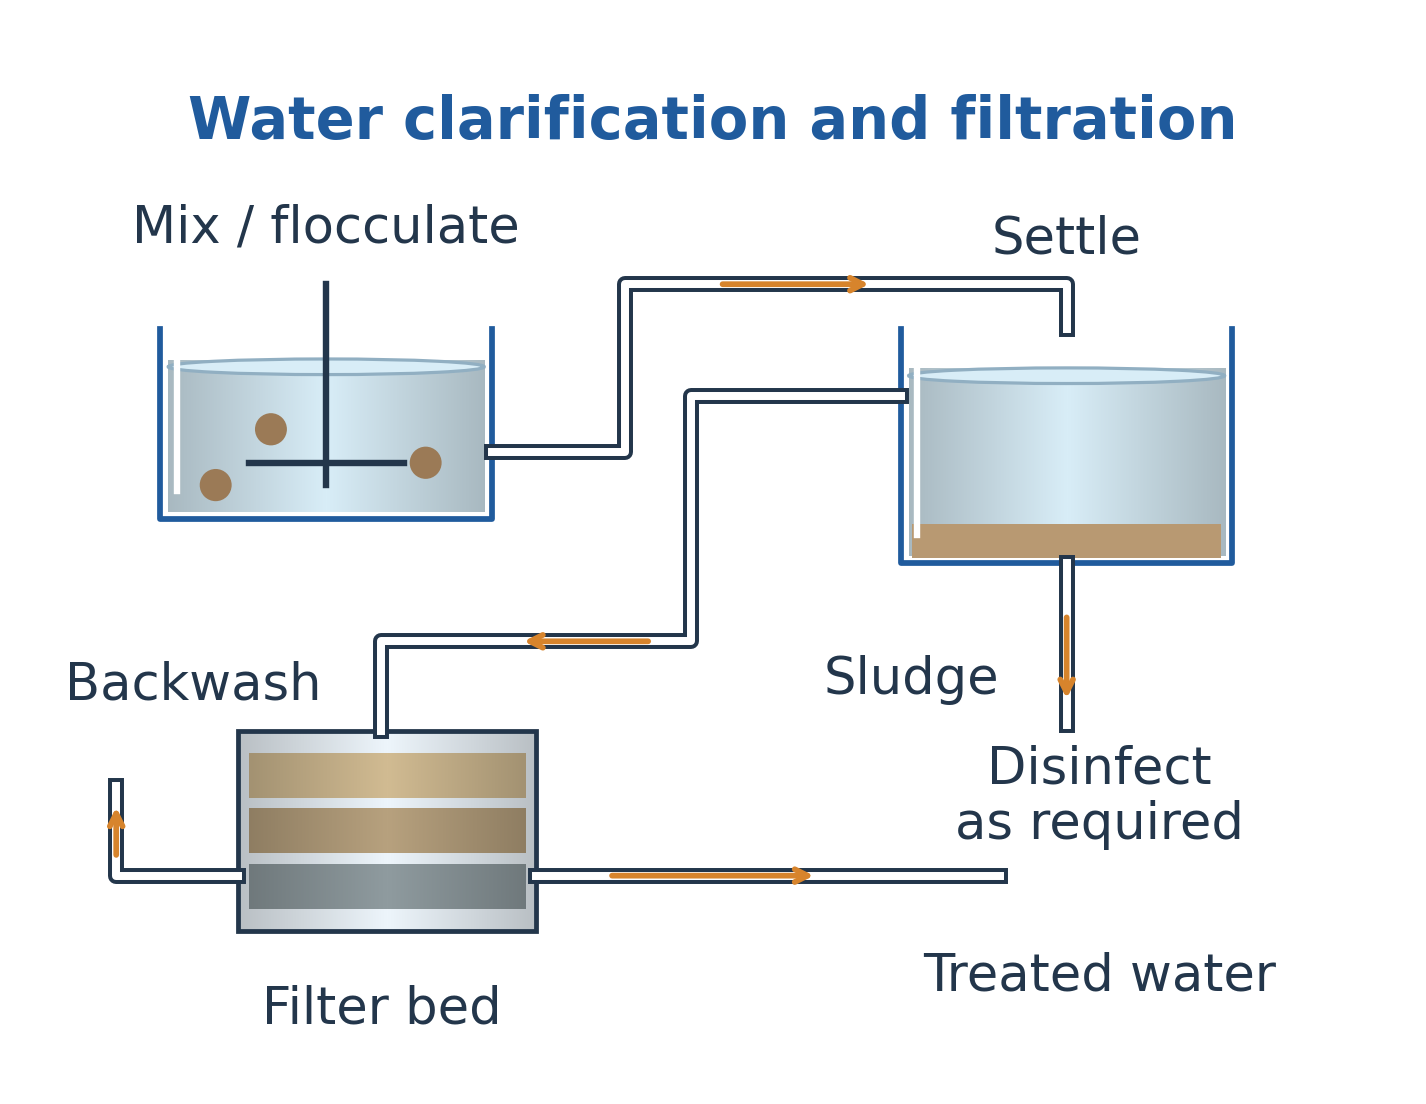

The process diagram should show chemical addition, mixing, floc formation, settling, filtering and residual outlets.
Excessive shear can break flocs.
A filter is not complete dissolved-ion removal.
Sludge and backwash retain removed material and require management.
Clarification can support later disinfection without independently establishing complete water suitability.
24. Disinfection: Chlorination, UV and Ozonation
Study route: CE
Chlorination creates reactive chlorine species including HOCl and OCl-, with proportions depending on pH.
Demand, contact conditions, temperature and turbidity affect performance.
UV damages susceptible organisms through radiation exposure and does not leave a continuing chemical residual.
Ozone is a strong oxidant generated and applied in an appropriate process.


Nominal dose is not the same as effective exposure.
Clear appearance does not prove disinfection.
Pretreatment can reduce shielding or demand.
| Method | Main distinction |
|---|---|
| Chlorination | Reactive chlorine, demand and residual |
| UV | Radiation exposure without chemical residual |
| Ozone | Generated oxidant and suitable contact |
Worked Problem 3.23: Chlorine Dose
Problem: Demand is 1.8 mg/L and the simplified target residual is 0.5 mg/L at the specified contact time.
Solution:
Dose = Demand + Residual
Dose = 1.8 + 0.5 = 2.3 mg/L
Answer: Required dose in the supplied balance is 2.3 mg/L.
This alone does not establish microbial inactivation.
25. Wastewater Treatment and Load Balances
Study route: CE
A treatment train can include screening, grit removal, primary settling, biological conversion, clarification and required polishing.
Aerobic biomass converts suitable biodegradable material and produces residual biomass.
Nutrient removal can require additional functions.
A diagram should show both liquid and solids paths.

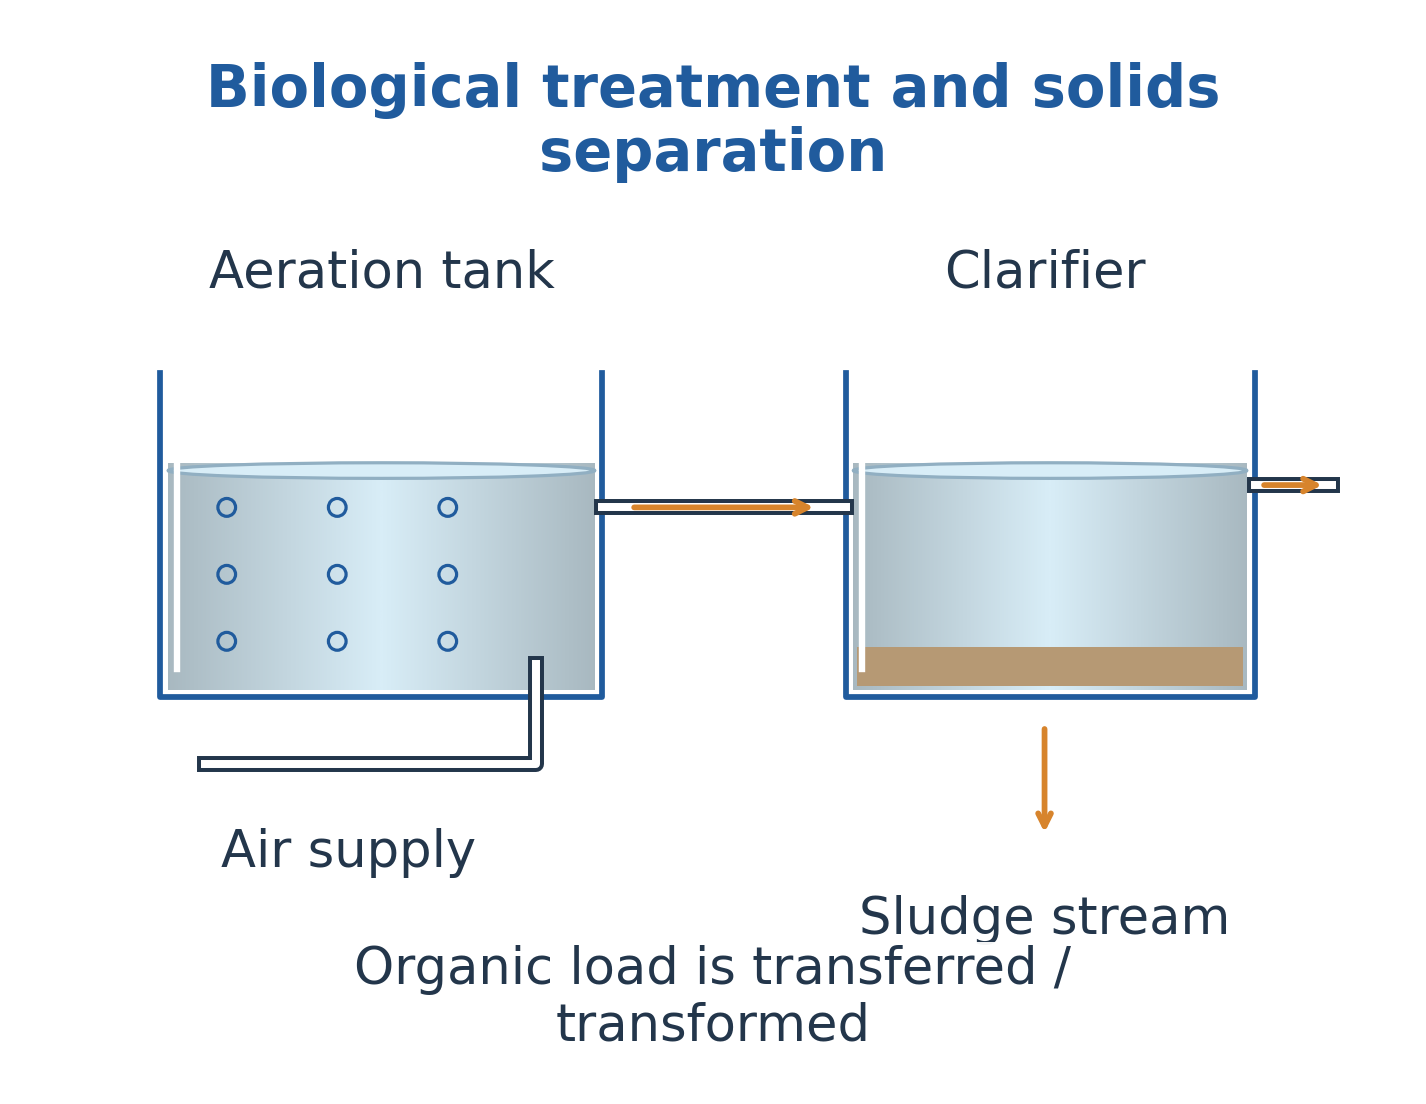
Concentration removal = 100(Cin – Cout)/Cin
Mass-load comparison additionally needs flow.
Load = Flow × Concentration
Lower concentration can partly reflect dilution.
Low BOD does not independently establish removal of pathogens, salts, metals or every toxic compound.
Worked Problem 3.24: Removal Efficiency
Problem: BOD decreases from 200 to 20 mg/L at unchanged flow.
Solution:
Removal = 100(200 – 20)/200
Removal = 90%
Because flow is unchanged, load reduction is also ninety percent.
Answer: Concentration and load reduction are both 90%.
26. Zeolite and Ion-Exchange Chemistry
Study route: CE and CH
Sodium-cycle softening replaces hardness cations with sodium.
Na2Z + Ca2+ -> CaZ + 2Na+
A corresponding reaction applies to magnesium.
Suitable brine regenerates exhausted capacity.
The process reduces calcium and magnesium hardness without removing every dissolved ion.

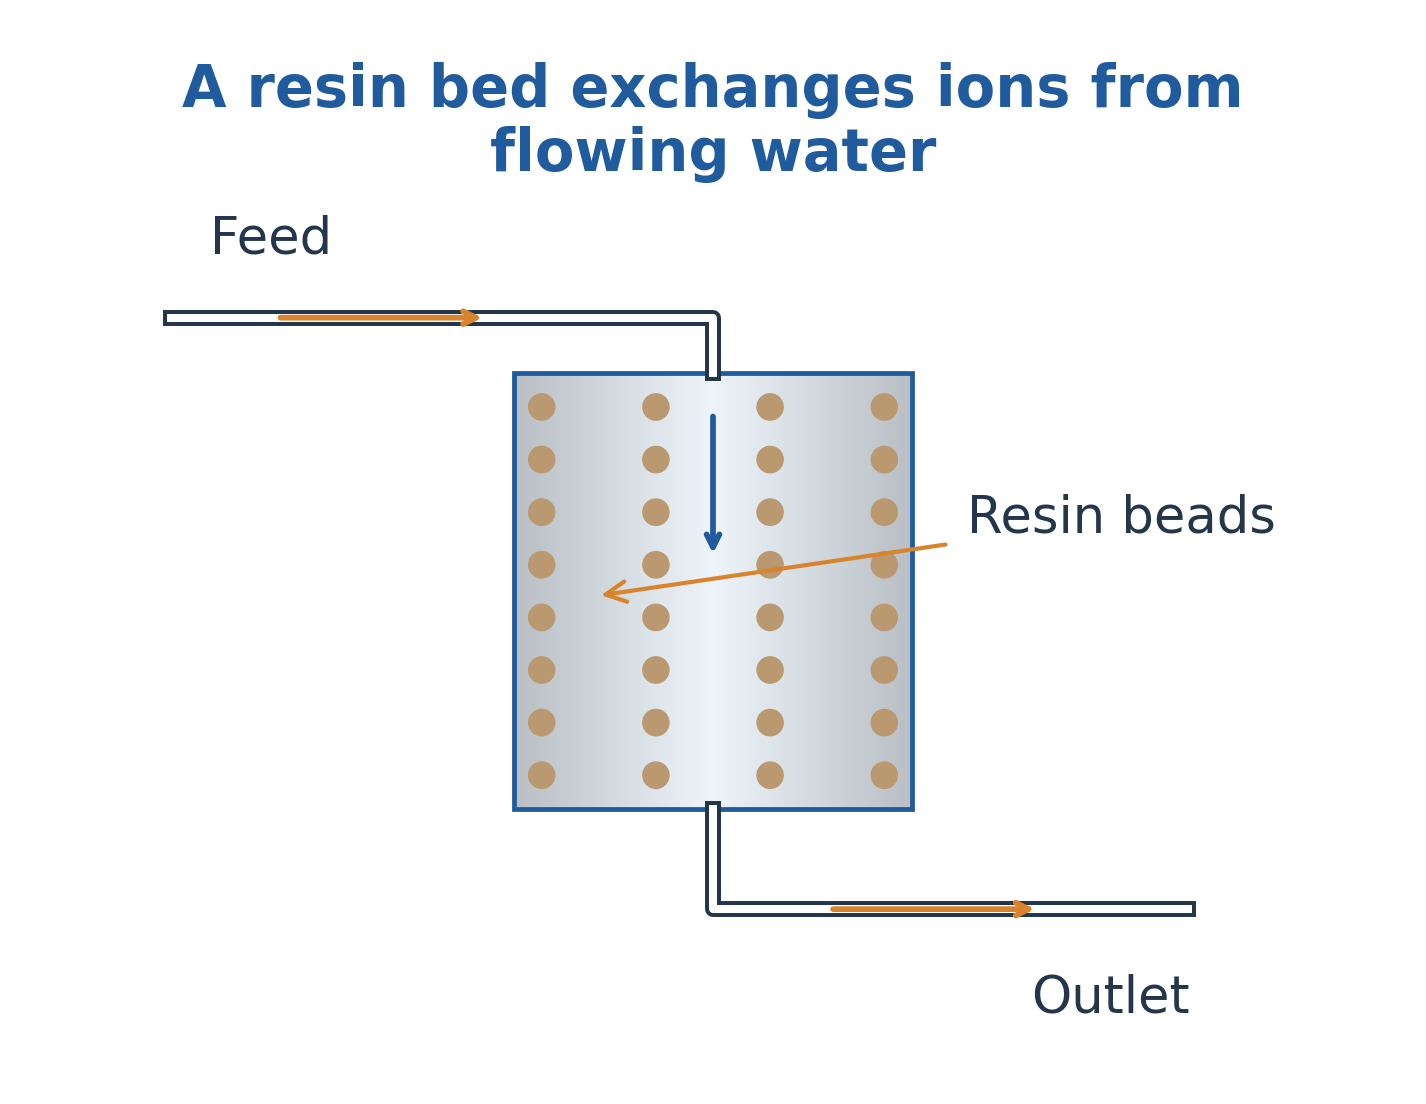

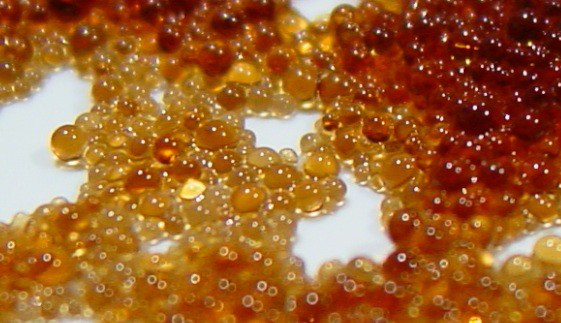
Demineralization uses H-form cation and OH-form anion resins.
Released H+ and OH- combine to form water.
Regeneration uses suitable acid and alkali separately.
Capacity requires a consistent charge or CaCO3 basis. Fouling and leakage affect practical output.
A Sensible Treatment Sequence
Identify whether the target is hardness, particles, microorganisms or broader dissolved ions.
Clarification, disinfection and ion exchange address different problems.
Sodium softening releases sodium while retaining hardness ions.
H/OH exchange supports broader ionic removal.
Regeneration transfers retained constituents to another stream. Include brine, spent regenerant and sludge rather than implying disappearance.
Worked Problem 3.25: Charge Capacity
Problem: Usable resin capacity is two equivalents. Feed hardness demand is 0.004 eq/L.
Solution:
Volume = Capacity / Demand
Volume = 2/0.004 = 500 L
Answer: Ideal treated volume is 500 L.
Worked Problem 3.26: CaCO3-Basis Capacity
Problem: Capacity is 2.0 kg as CaCO3 and feed hardness is 200 mg/L as CaCO3.
Solution:
Capacity = 2,000,000 mg
Volume = 2,000,000/200 = 10,000 L
Answer: Ideal service volume is 10 m³.
Breakthrough and incomplete regeneration can reduce practical service.
27. Catalysis, Mechanisms and Selectivity
Study route: CH
A catalyst changes reaction rate through an alternative pathway and is regenerated in the ideal cycle.
Homogeneous catalysis shares the relevant phase with reactants. Heterogeneous catalysis operates at an interface.
Catalysts do not change the equilibrium constant of the same reaction at fixed temperature.


Heterogeneous operation can involve transport, adsorption, reaction and desorption.
Conversion describes consumption of a reactant. Selectivity describes product distribution.
High conversion can coexist with poor desired selectivity.
State stoichiometry and denominator before comparing yield.
Worked Problem 3.27: Conversion, Selectivity and Yield
Problem: Feed is 100 mol A. Sixty react, and forty-five moles desired product form with one-to-one stoichiometry.
Solution:
Conversion = 60/100 = 60%
Selectivity on reacted A = 45/60 = 75%
Yield on feed = 45/100 = 45%
Answer: Conversion 60%, selectivity 75%, desired yield 45%.
28. Industrial Catalysts, Deactivation and Regeneration
Study route: CH
Zeolites provide porous frameworks and tunable acid sites.
Metal oxides and supported metals provide different acid-base, redox or hydrogenation functions.
Supports influence dispersion, access and stability and need not be chemically irrelevant.

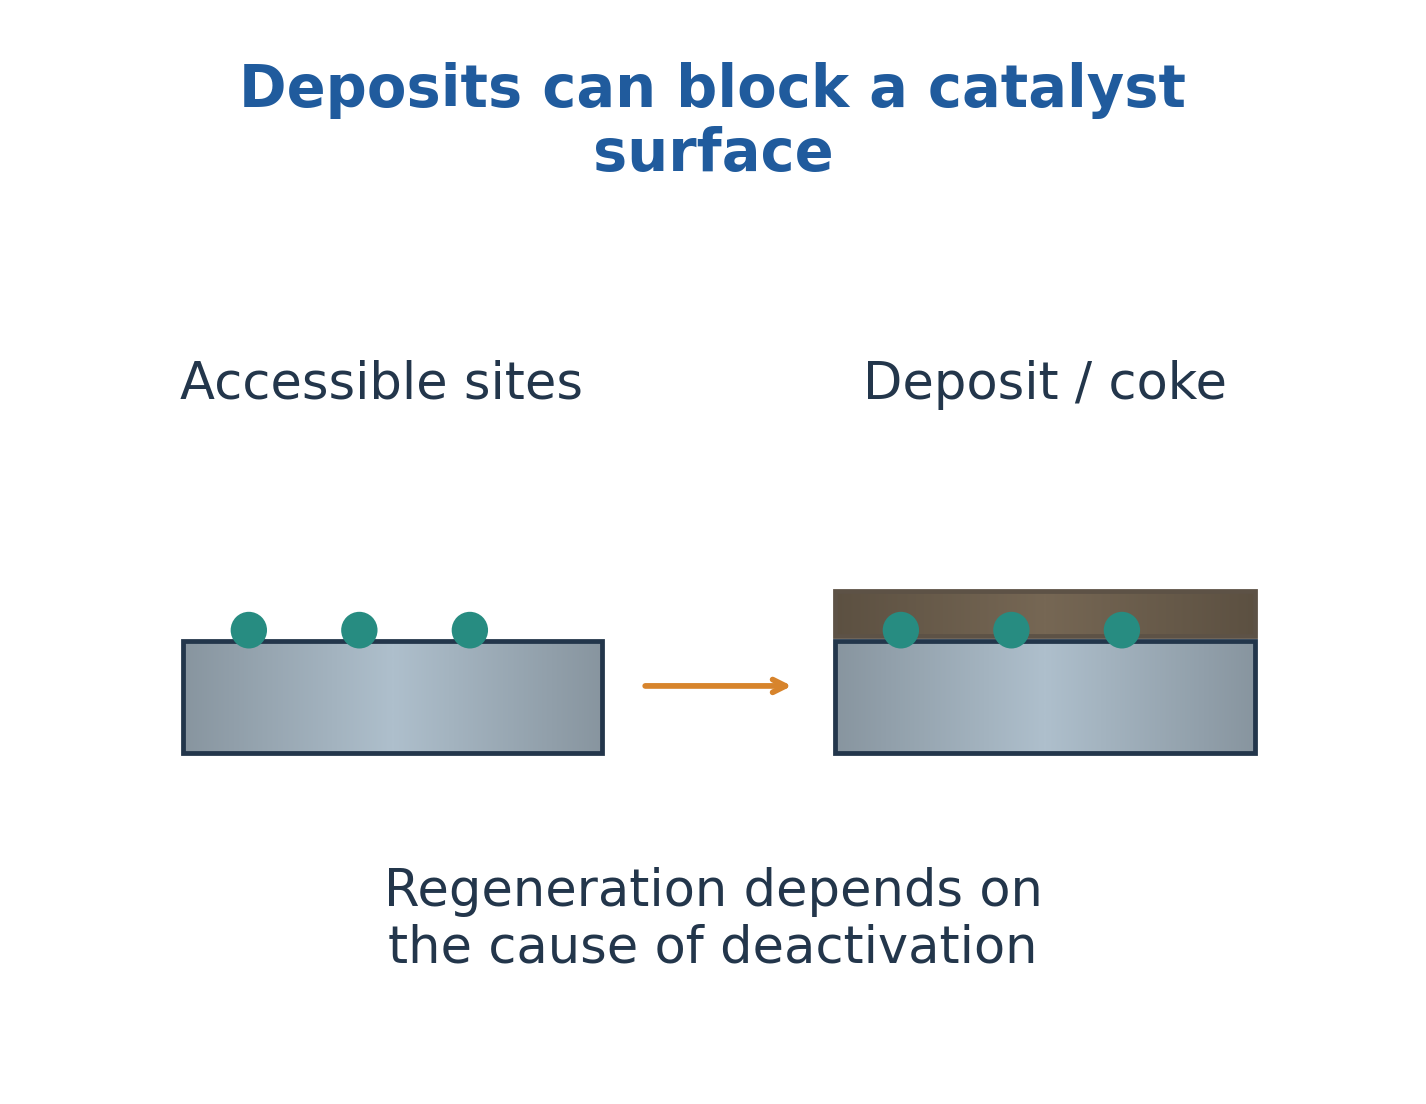
Poisoning, coking, sintering, leaching and structural changes reduce performance through different mechanisms.
Regeneration may remove deposits or restore a chemical state, but irreversible damage can remain.
A lower observed rate can also reflect transport limitation.
Identify the cause before choosing regeneration.
Worked Problem 3.28: Retained Activity
Problem: Matched rates are eighty initially and sixty after service.
Solution:
Relative activity = 60/80 = 0.75
Answer: Activity retention is 75%.
The rate change alone does not identify a unique deactivation mechanism.
29. Adsorption and the Langmuir Model
Study route: CH
Adsorption is accumulation at a surface. Absorption is uptake into a bulk phase.
Physisorption involves relatively weak interactions and can support multilayers.
Chemisorption involves stronger specific bonding and is often represented through limited reactive sites.
Accessibility, temperature and chemical identity affect uptake.

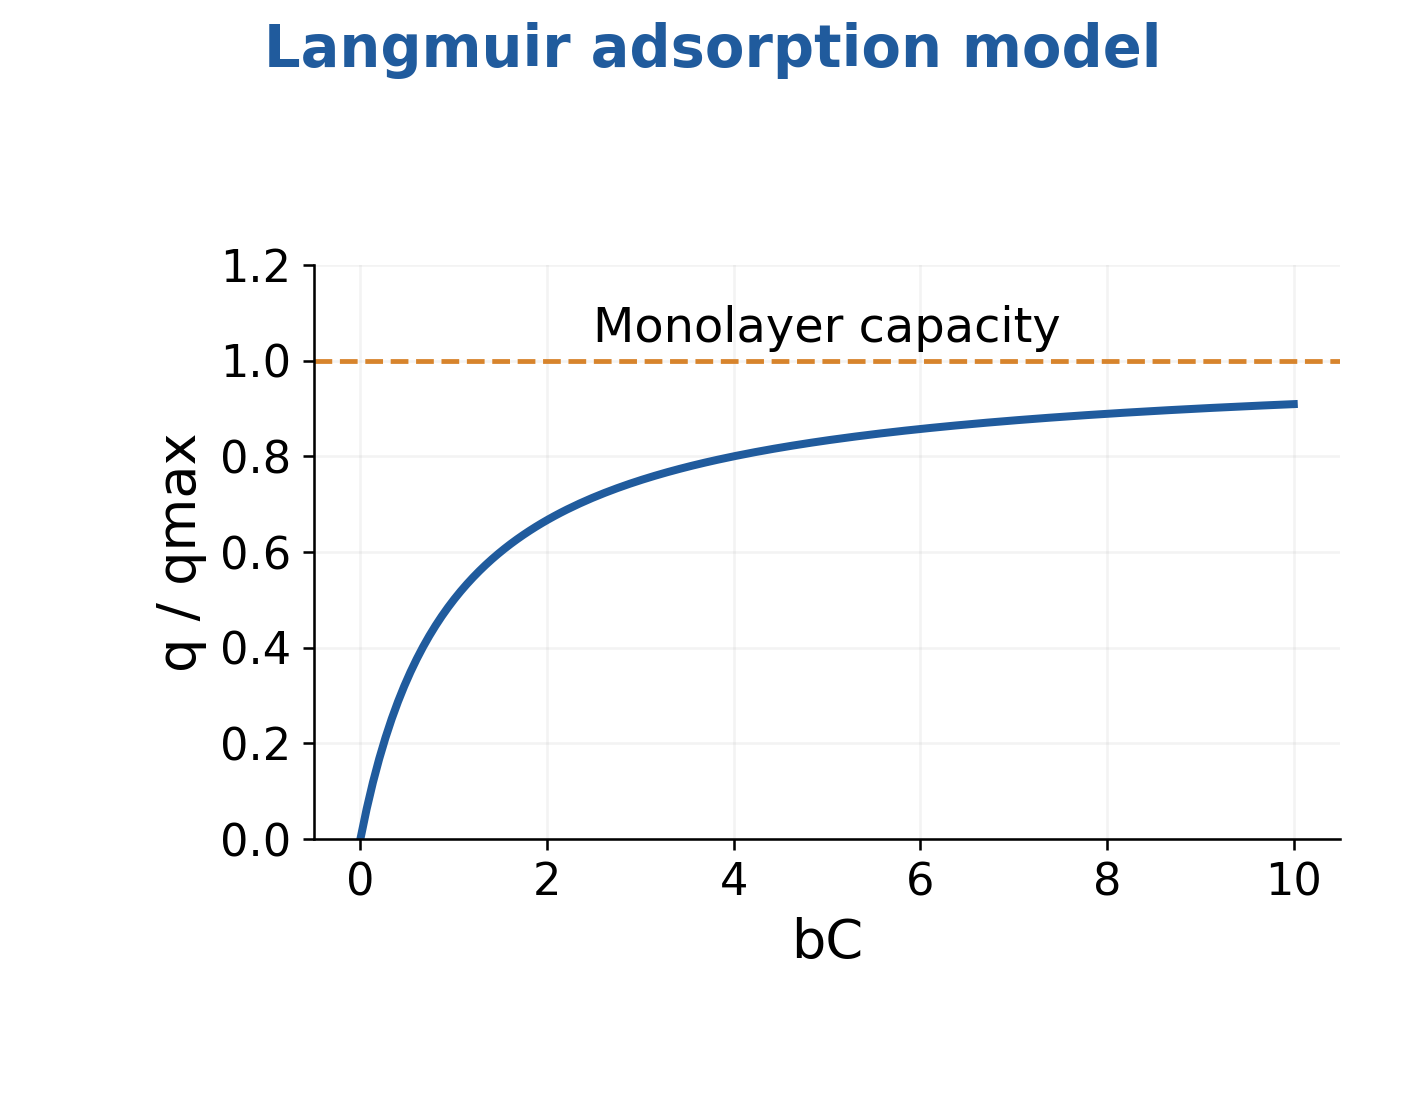
q = qmax bC/(1 + bC)
The assumptions include equivalent independent sites and monolayer occupancy.
At bC = 1:
q = qmax/2
A fitted curve does not uniquely prove microscopic mechanism.
Worked Problem 3.29: Langmuir Loading
Problem: qmax = 100 mg/g, b = 0.20 L/mg and C = 5 mg/L.
Solution:
bC = 0.20 × 5 = 1
q = 100 × 1/(1 + 1) = 50 mg/g
Answer: Loading is 50 mg/g, half the supplied saturation value.
30. Freundlich, BET and Surface Area
Study route: CH
The Freundlich relation is empirical:
q = K C^(1/n)
It applies over a declared fitted interval.
Unlike Langmuir, indefinite extrapolation does not enforce finite saturation.
Units depend on the selected exponent and concentration convention.

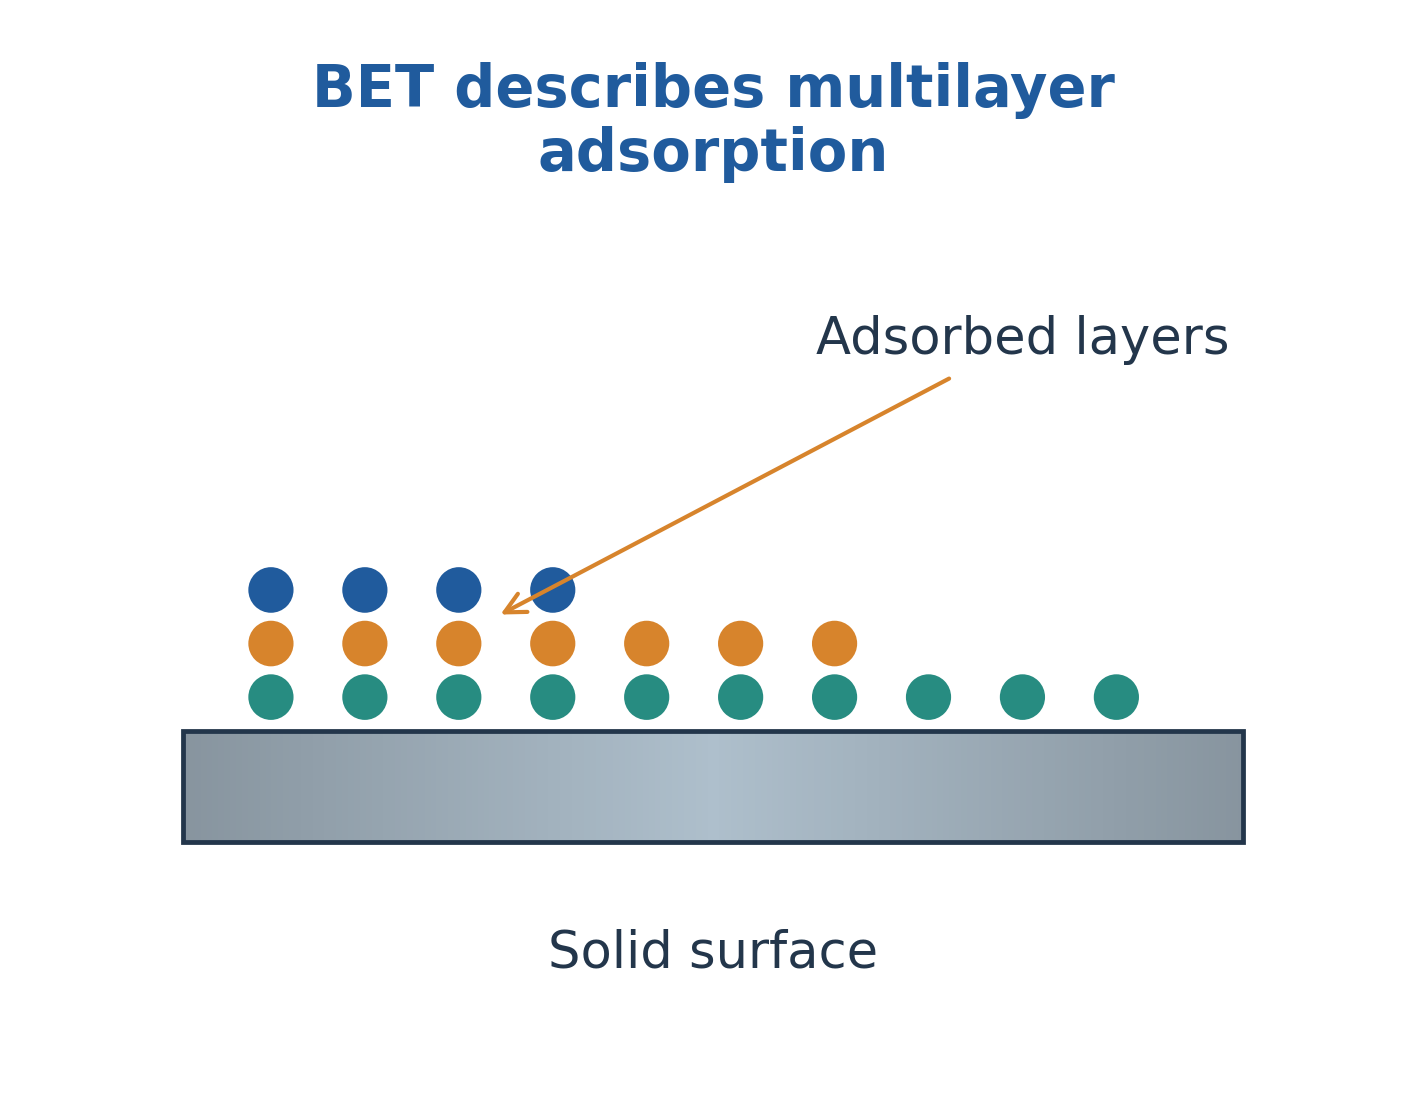
A conventional BET form is:
P/[v(P0 – P)] = 1/(vm Cb) + (Cb – 1)P/(vm Cb P0)
vm is monolayer-equivalent volume and Cb is the BET constant.
Monolayer amount and molecular cross-sectional area support accessible-area estimation.
Preparation, pore access and fitting interval influence interpretation.
Worked Problem 3.30: Freundlich Loading
Problem: K = 2 in consistent units, 1/n = 0.5 and C = 9.
Solution:
q = 2 × 9^0.5
q = 2 × 3 = 6
Answer: Loading is 6 in the matching supplied units.
The empirical relation does not impose finite qmax at arbitrarily high concentration.
31. Chromatographic Separation
Study route: CH
Chromatography separates components through different interactions with stationary and mobile phases.
Adsorption, partition, ion exchange and size exclusion are distinct mechanisms.
Retention depends on both affinity and transport conditions.
Retention time is not a universal substance constant.


Resolution describes separation between peaks.
Purity and recovery describe collected material and require their own measurements.
Strong retention alone does not establish pure recovery.
Flow, solvent, temperature and loading affect peak shape.
Worked Problem 3.31: Resolution
Problem: Retention times are five and seven minutes. Baseline widths are 0.8 and 1.2 minutes.
Solution:
Rs = 2(t2 – t1)/(w1 + w2)
Rs = 2(7 – 5)/(0.8 + 1.2)
Rs = 4/2 = 2.0
Answer: Resolution is 2.0 using the supplied baseline-width convention.
32. Membrane Separation
Study route: CH
Membranes separate through size exclusion, solution-diffusion, charge effects or selective sorption.
Microfiltration and ultrafiltration address appropriate larger species.
Nanofiltration and reverse osmosis can reject smaller solutes according to chemistry and conditions.
Ion-selective membranes involve more than geometric sieving.

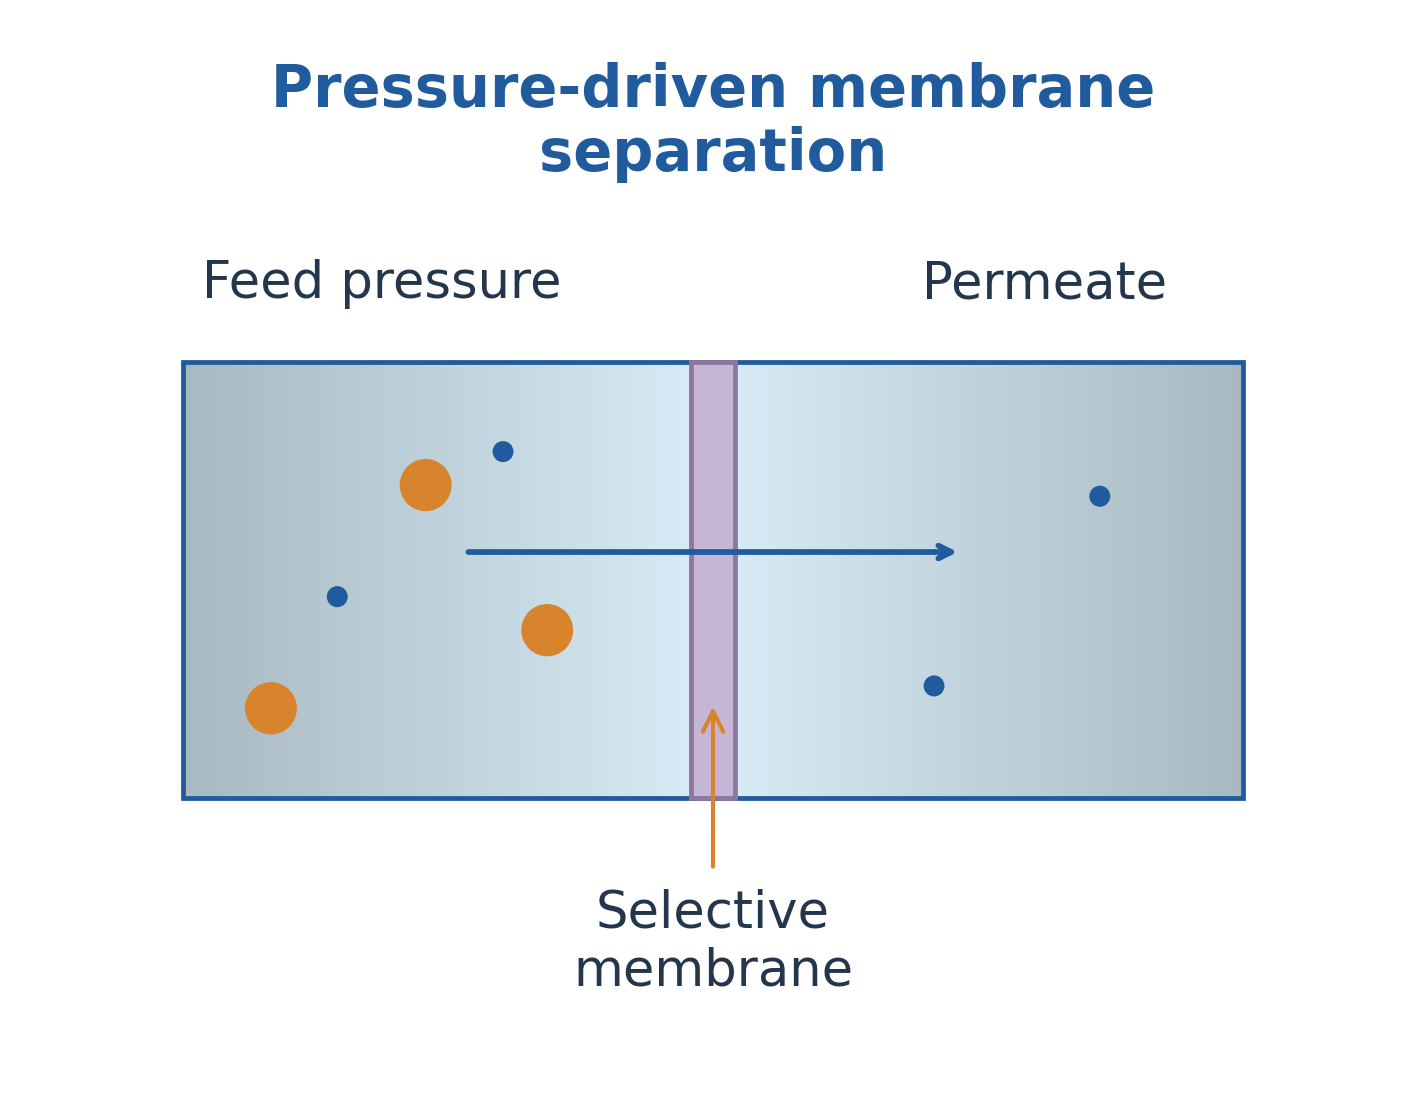
Rejection = 1 – Cp/Cf
Recovery = Permeate flow / Feed flow
Fouling, degradation and concentration polarization affect performance.
A membrane can concentrate a contaminant in retentate. Both streams belong in balances.
Worked Problem 3.32: Rejection
Problem: Feed concentration is 100 mg/L and permeate is 5 mg/L.
Solution:
Rejection = 1 – 5/100 = 0.95
Answer: Rejection is 95%, not ninety-five percent water recovery.
Separating Conversion from Separation
Catalytic reaction changes chemical identity through a pathway.
Adsorption transfers a constituent preferentially to a surface.
Chromatography distributes components repeatedly between phases.
A membrane divides streams according to transport selectivity.
A lower outlet concentration does not automatically establish chemical destruction. Include all products and residual streams.
33. Enzyme Classification and Nomenclature
Study route: BT
Enzymes catalyse biological reactions. Most are proteins, while catalytic RNA is an important exception.
The EC system classifies reaction chemistry rather than only organism or industrial use.
The main groups presented here are oxidoreductases, transferases, hydrolases, lyases, isomerases, ligases and translocases.

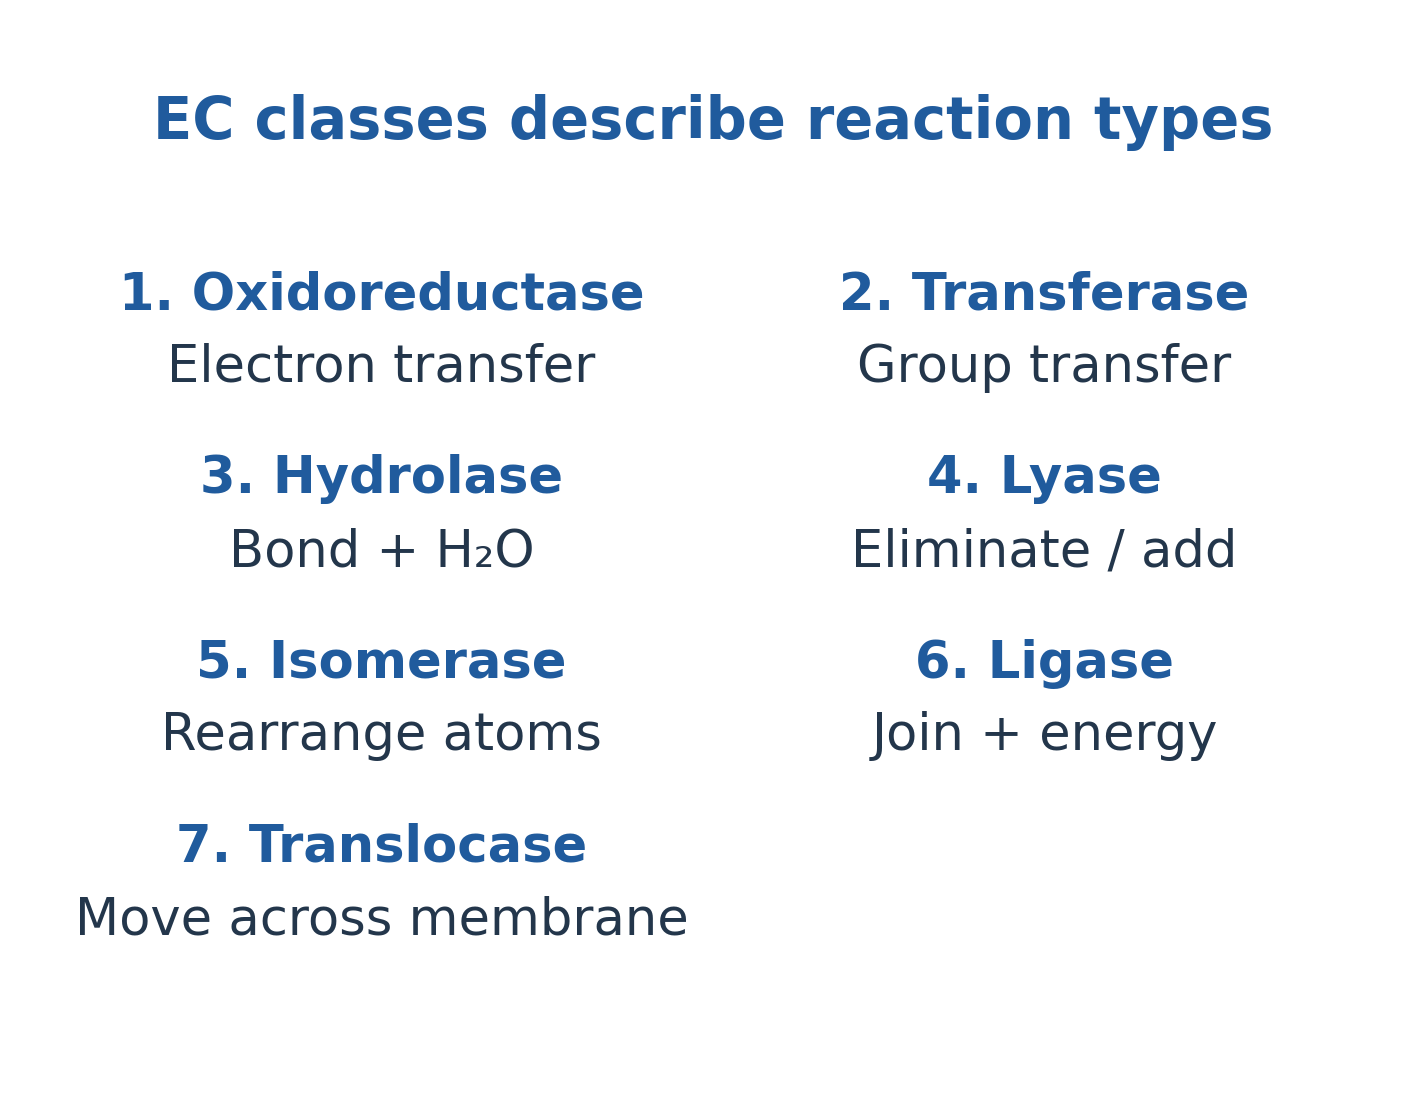
A four-part EC number locates a reaction within a hierarchy.
Common names based on substrate or application can need fuller reaction descriptions.
Identify the transformation before assigning the class.
Similar applications do not prove identical mechanisms or specificity.
| Class | Reaction family |
|---|---|
| EC 1 | Oxidoreductases |
| EC 2 | Transferases |
| EC 3 | Hydrolases |
| EC 4 | Lyases |
| EC 5 | Isomerases |
| EC 6 | Ligases |
| EC 7 | Translocases |
Worked Problem 3.33: Reaction Classification
Problem: One enzyme hydrolyses a peptide bond. Another couples ion translocation to a reaction.
Solution:
Peptide hydrolysis belongs to the hydrolase family.
A defined coupled transport reaction can belong to translocases.
Answer: EC 3 for peptide hydrolysis and EC 7 where the defined transport reaction fits that family.
34. Active-Site Chemistry and Catalytic Mechanisms
Study route: BT
An active site positions substrates and supports productive chemistry.
Acid-base catalysis transfers protons.
Covalent catalysis forms temporary enzyme-associated intermediates.
Metal ions can assist positioning, charge stabilization or redox.
Mechanism depends on the particular enzyme and reaction.

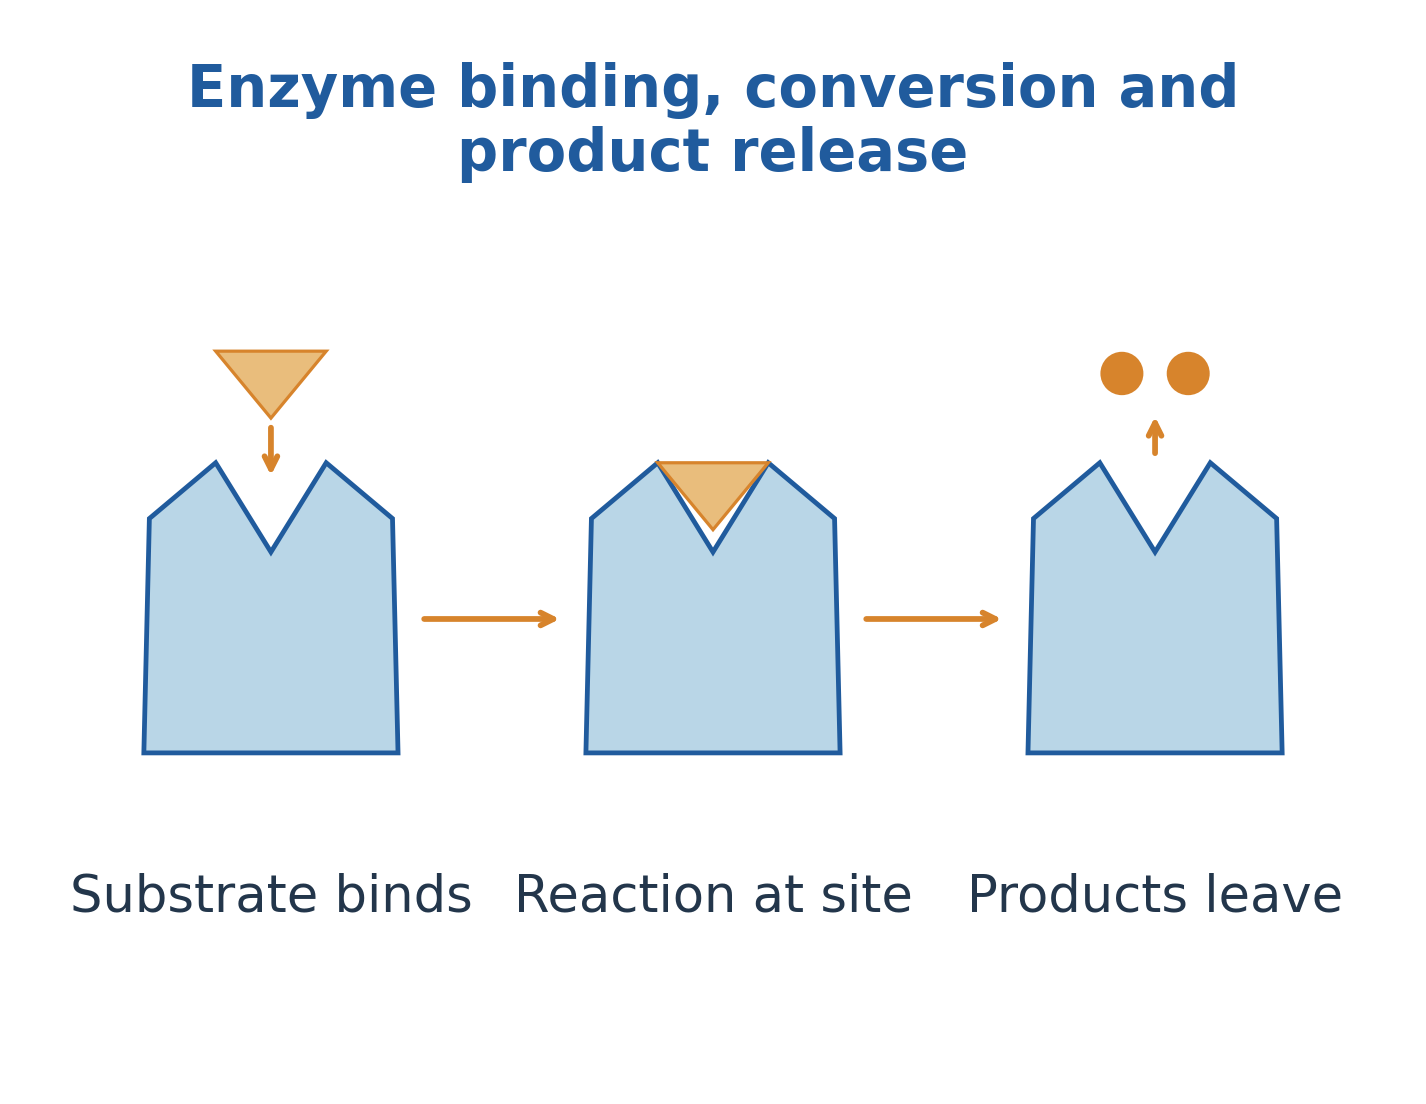

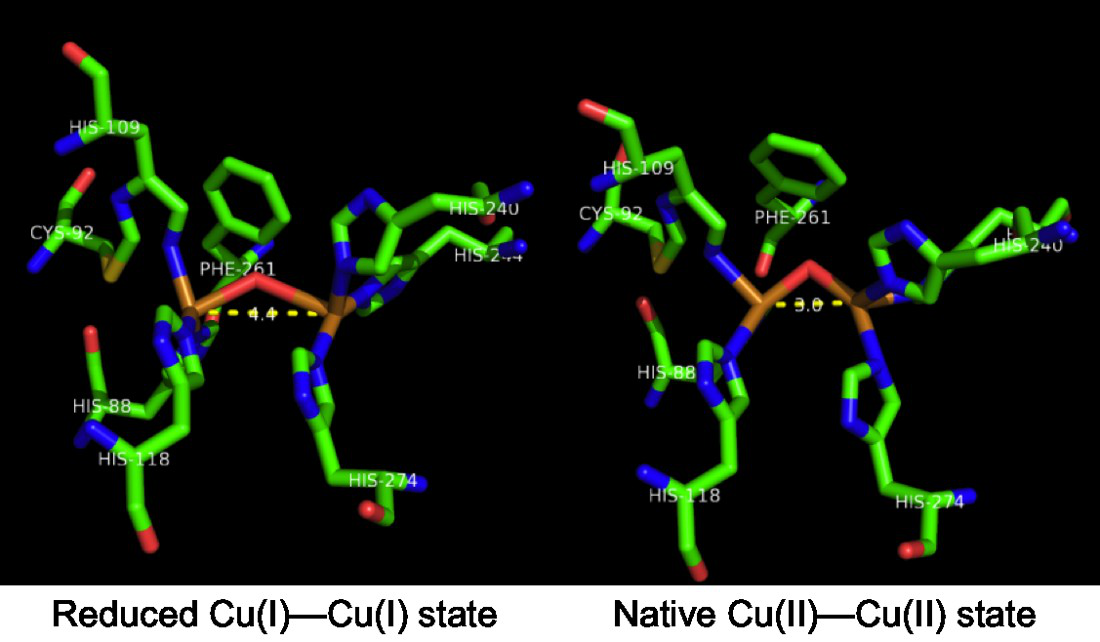
Induced fit describes conformational adjustment associated with binding.
Transition-state stabilization can lower the effective barrier.
Overly stable unproductive binding can hinder turnover or product release.
Catalysis changes approach rates rather than equilibrium.
pH, temperature, cofactors, inhibitors and active fraction influence assays.
35. Michaelis-Menten Kinetics
Study route: BT
For a simple steady-state initial-rate mechanism:
E + S <-> ES -> E + P
v = Vmax[S]/(Km + [S])
Vmax = kcat[E]total
For this mechanism:
Km = (k-1 + kcat)/k1
Km equals a binding dissociation constant only under additional conditions.

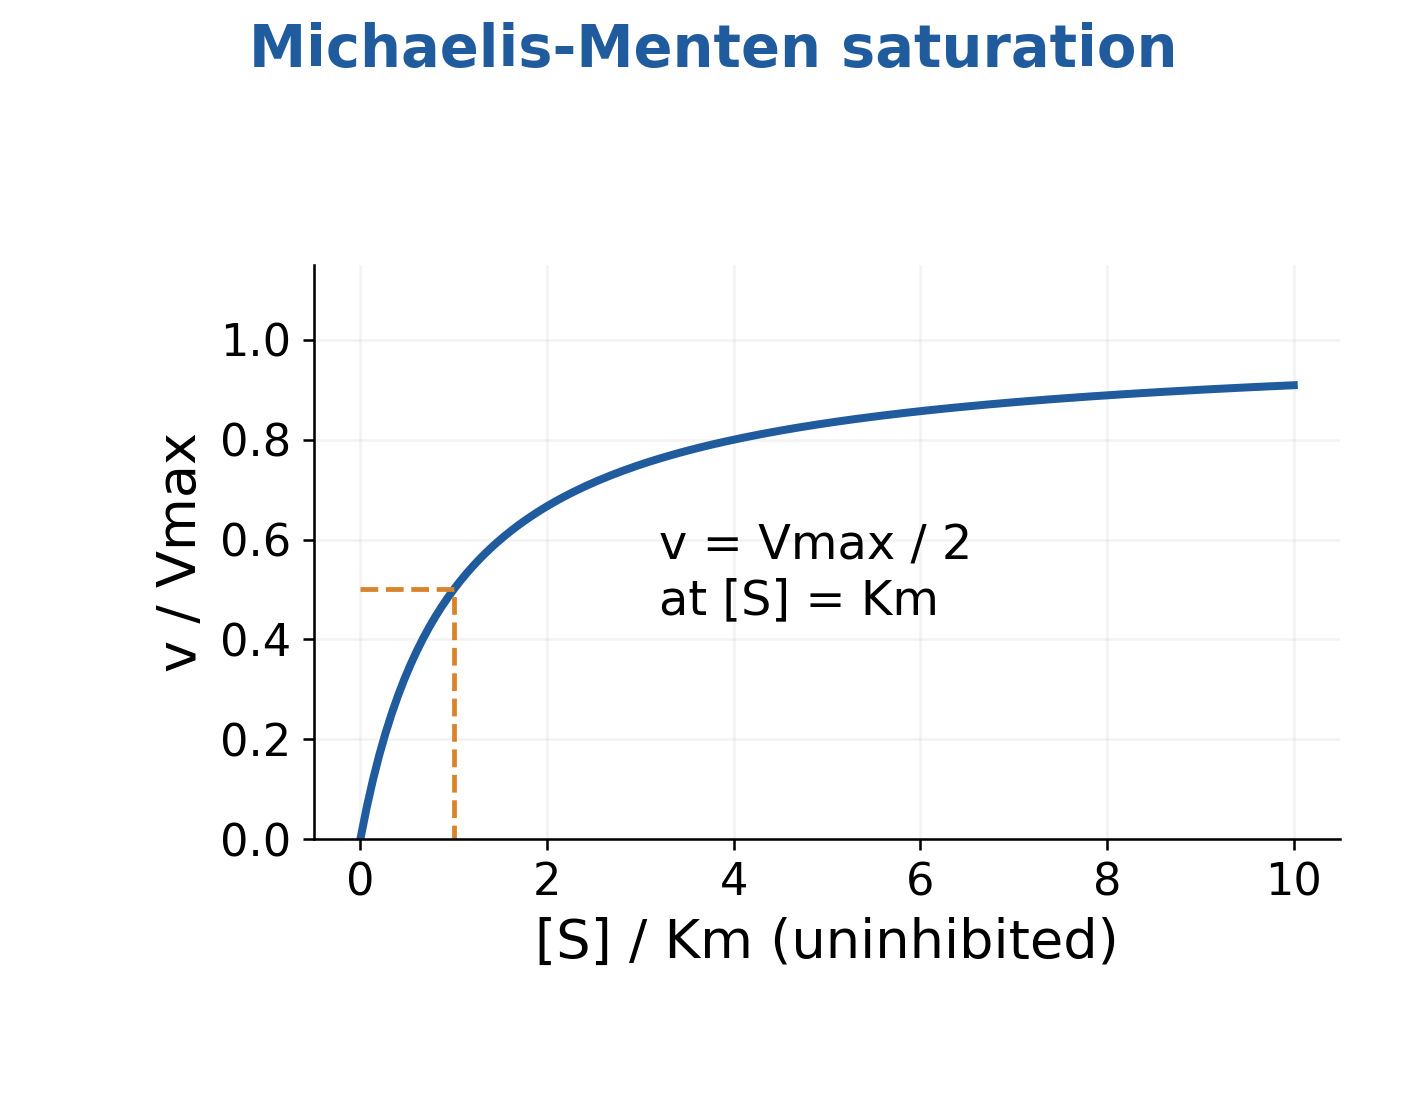
Low-substrate rate is approximately proportional to substrate. High-substrate rate approaches saturation.
kcat is turnover per defined active site.
Initial-rate, steady-state and product-control assumptions matter.
Reciprocal plots can amplify measurement errors. Parameters retain their model and units.
Worked Problem 3.34: Initial Rate
Problem: Vmax = 100 micromol/min, Km = 2 mM and substrate = 6 mM.
Solution:
v = 100 × 6/(2 + 6)
v = 600/8 = 75 micromol/min
Answer: Initial rate is 75 micromol/min.
Worked Problem 3.35: Turnover Number
Problem: Vmax = 12 micromol/min and active-site amount is 0.20 micromol.
Solution:
kcat = 12/0.20 = 60 min^-1
kcat = 1 s^-1
Answer: Turnover number is 1 s^-1.
36. Inhibition and Allosteric Regulation
Study route: BT
Ideal competitive inhibition raises apparent Km while leaving Vmax unchanged.
Pure noncompetitive inhibition lowers Vmax without changing Km.
Mixed inhibition is more general and can change both.
Ideal uncompetitive inhibition lowers Km and Vmax by the same factor.


Allosteric regulation connects binding or state change at one region with activity elsewhere.
It can produce cooperative or non-Michaelis-Menten behaviour.
Irreversible loss of active enzyme is a different time-dependent mechanism.
Do not classify every off-active-site interaction as pure noncompetitive inhibition.
Worked Problem 3.36: Competitive Inhibitor
Problem: An inhibitor doubles apparent Km from two to four mM. Vmax remains 100 micromol/min. Substrate is six mM.
Solution:
v = 100 × 6/(4 + 6)
v = 60 micromol/min
Answer: Rate is 60 micromol/min, compared with uninhibited 75 micromol/min.
37. Immobilized Enzymes and Bioprocess Use
Study route: BT
Immobilization attaches or confines enzyme on or within a support.
Methods include adsorption, covalent attachment, entrapment and suitable encapsulation.
It can simplify separation and reuse while changing stability and accessibility.

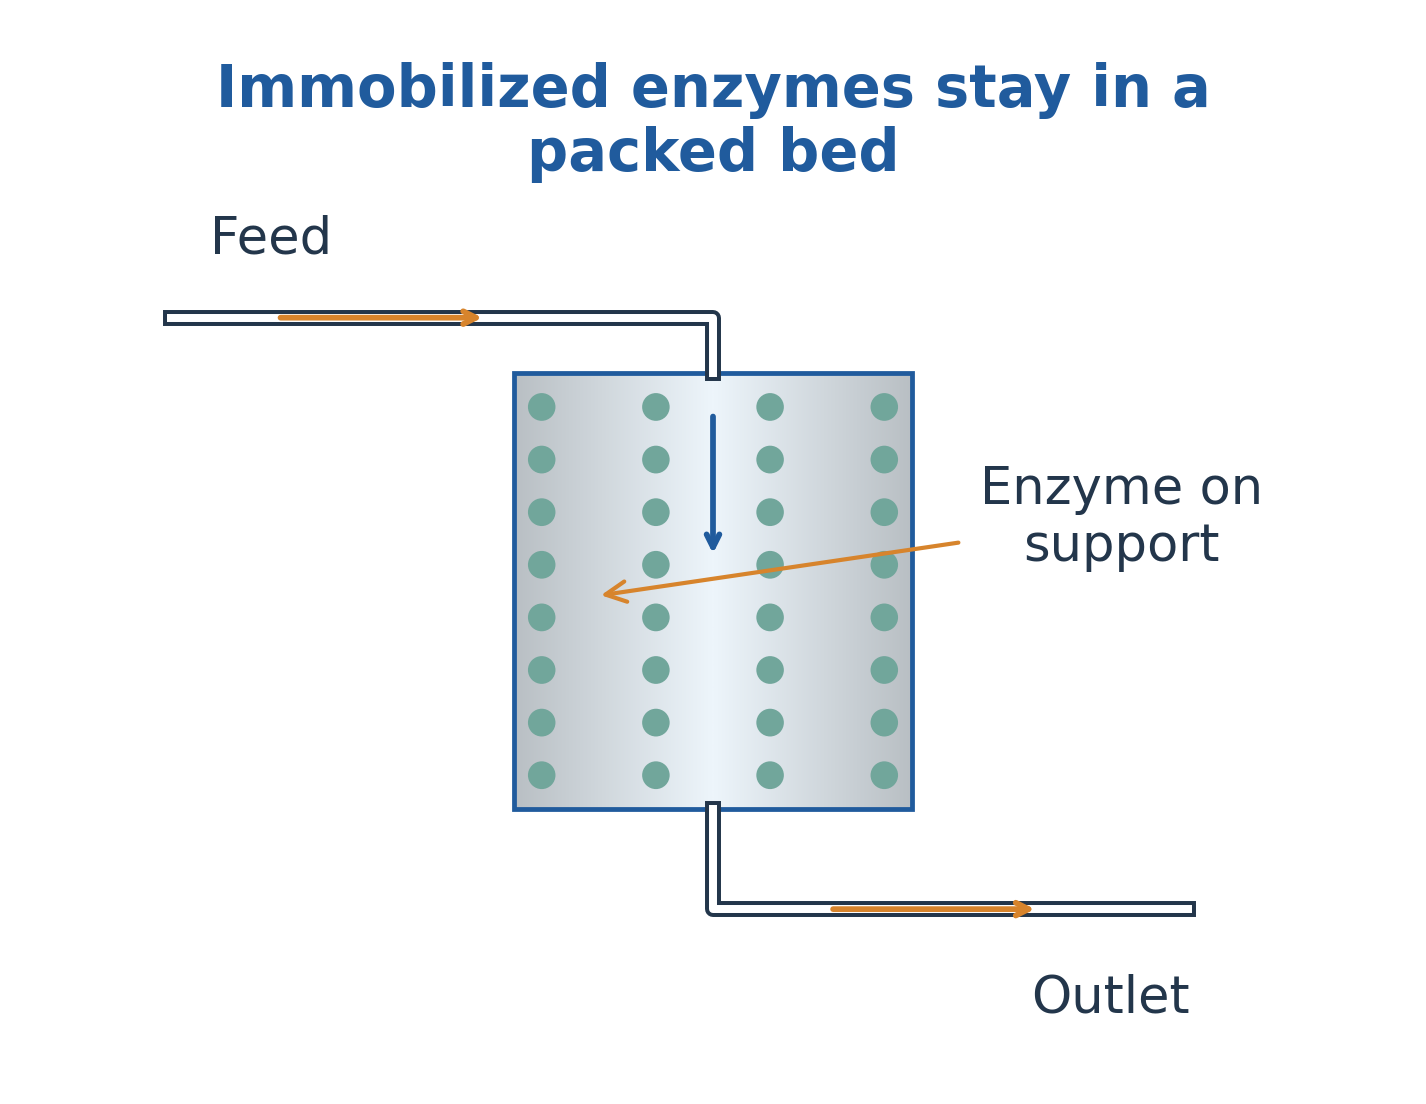
Diffusion through supports and boundary layers can reduce observed rate even when intrinsic chemistry is unchanged.
Leaching, fouling and mechanical damage limit reuse.
Compare active loading, retained activity, recovery and mass transfer.
Immobilization does not automatically make an enzyme faster or indefinitely reusable.
Worked Problem 3.37: Activity Recovery
Problem: Soluble preparation has one hundred activity units. Immobilized preparation gives seventy under the stated assay.
Solution:
Activity recovery = 70/100 × 100
Activity recovery = 70%
Answer: Recovery is 70%.
Protein attachment yield can differ from activity recovery.
38. Industrial Enzymes and Enzyme Engineering
Study route: BT
Proteases act on suitable peptide bonds. Amylases act on appropriate starch linkages.
Lipases catalyse lipid-ester transformations. Cellulases act on cellulose.
Specificity and operating windows depend on the actual enzyme.
A preparation that removes an impurity can damage a valuable substrate under unsuitable conditions.

Engineering can change sequence or expression to improve measured activity, stability or selectivity.
Directed evolution and rational methods use different design routes.
Screening and verification are essential.
A favourable assay result may not transfer unchanged to another substrate or process matrix.
Worked Problem 3.38: Productivity
Problem: Twenty-four mmol product form in two hours using three grams preparation.
Solution:
Productivity = 24/(2 × 3)
Productivity = 4 mmol/(g h)
Answer: Average mass-specific productivity is 4 mmol/(g h).
This is not kcat without active-site amount and the relevant kinetic conditions.
39. Nitrogenous Fertilizer Chemistry
Study route: AG
Nitrogenous fertilizers include urea, ammonium nitrate and ammonia-based sources.
Urea hydrolysis produces ammonium-related species. Aerobic nitrification can subsequently form nitrate.
Volatilization, leaching and denitrification can divert nitrogen from crop uptake.
Form, placement, moisture and soil conditions affect pathways.

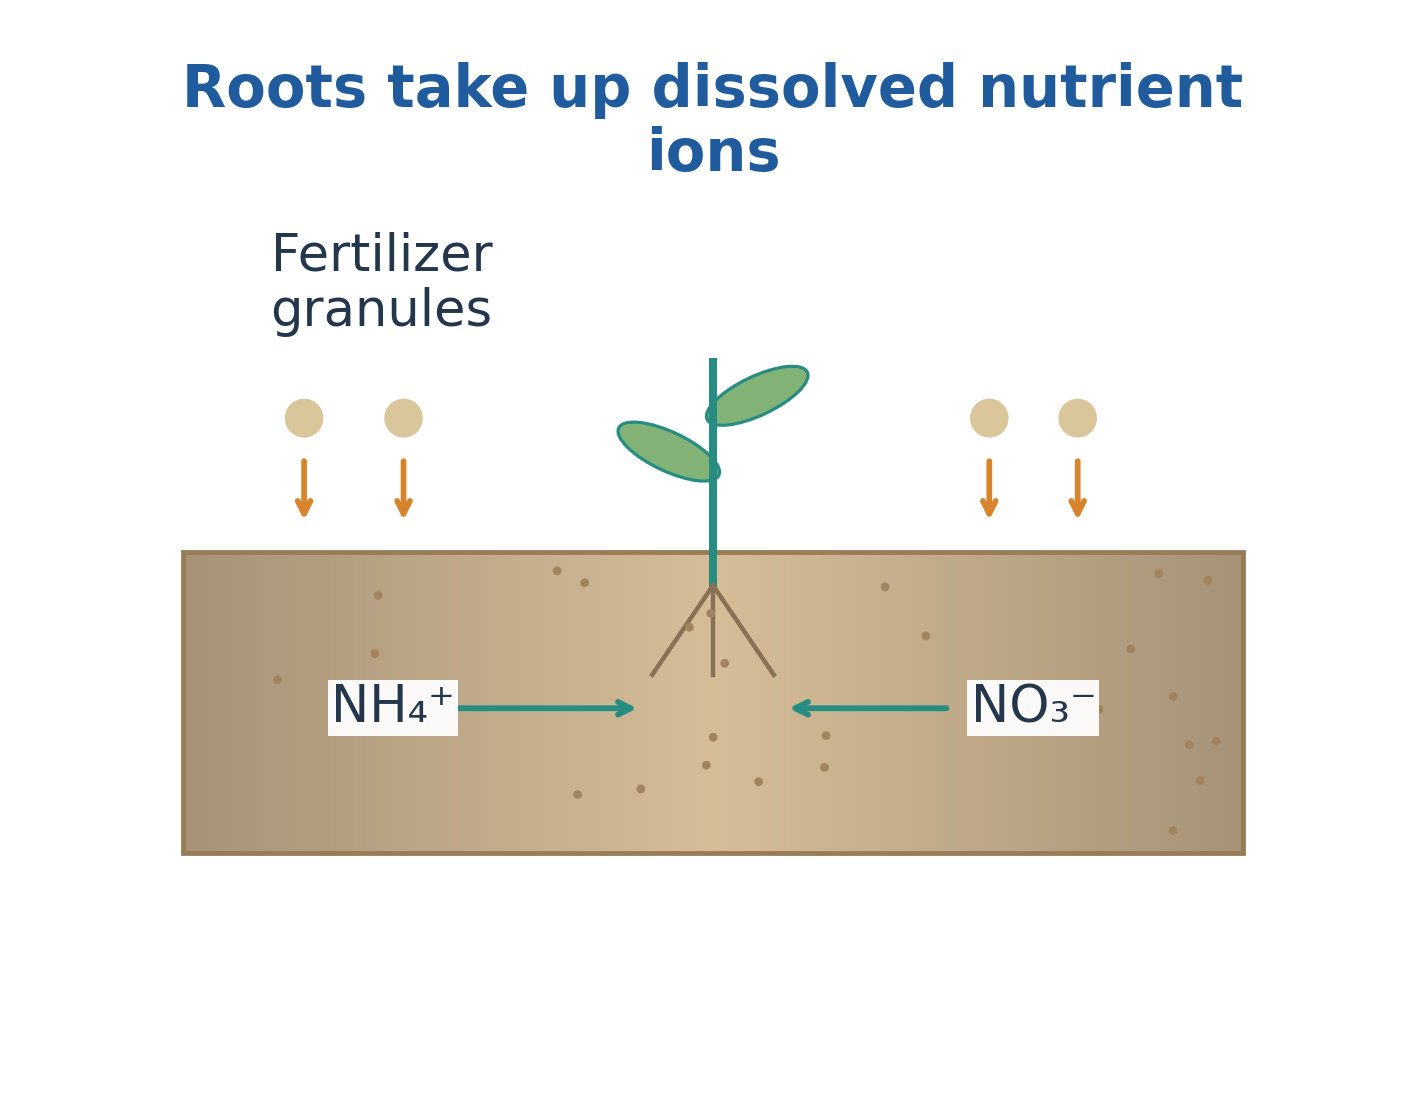
Nitrogen percentage is an inventory, not an automatically equal recovery fraction.
Calculate product dose from required nutrient and grade, then keep soil supply and recovery corrections separate.
No product provides unlimited usable nitrogen independent of crop and soil.
Worked Problem 3.39: Nitrogen Dose
Problem: Supply forty-six kilograms nitrogen using a fertilizer with forty-six percent N, without recovery correction.
Solution:
Product mass = Required N / N fraction
Product mass = 46/0.46 = 100 kg
Answer: Required product is 100 kg.
A field recommendation needs additional soil and crop information.
40. Phosphatic, Potassic and Release-Controlled Fertilizers
Study route: AG
Superphosphate and DAP are phosphatic sources.
Potassic products commonly supply potassium as chloride or sulfate.
Micronutrient products supply essential small quantities such as zinc, iron or boron.
Availability depends on chemical form, pH, sorption and precipitation.

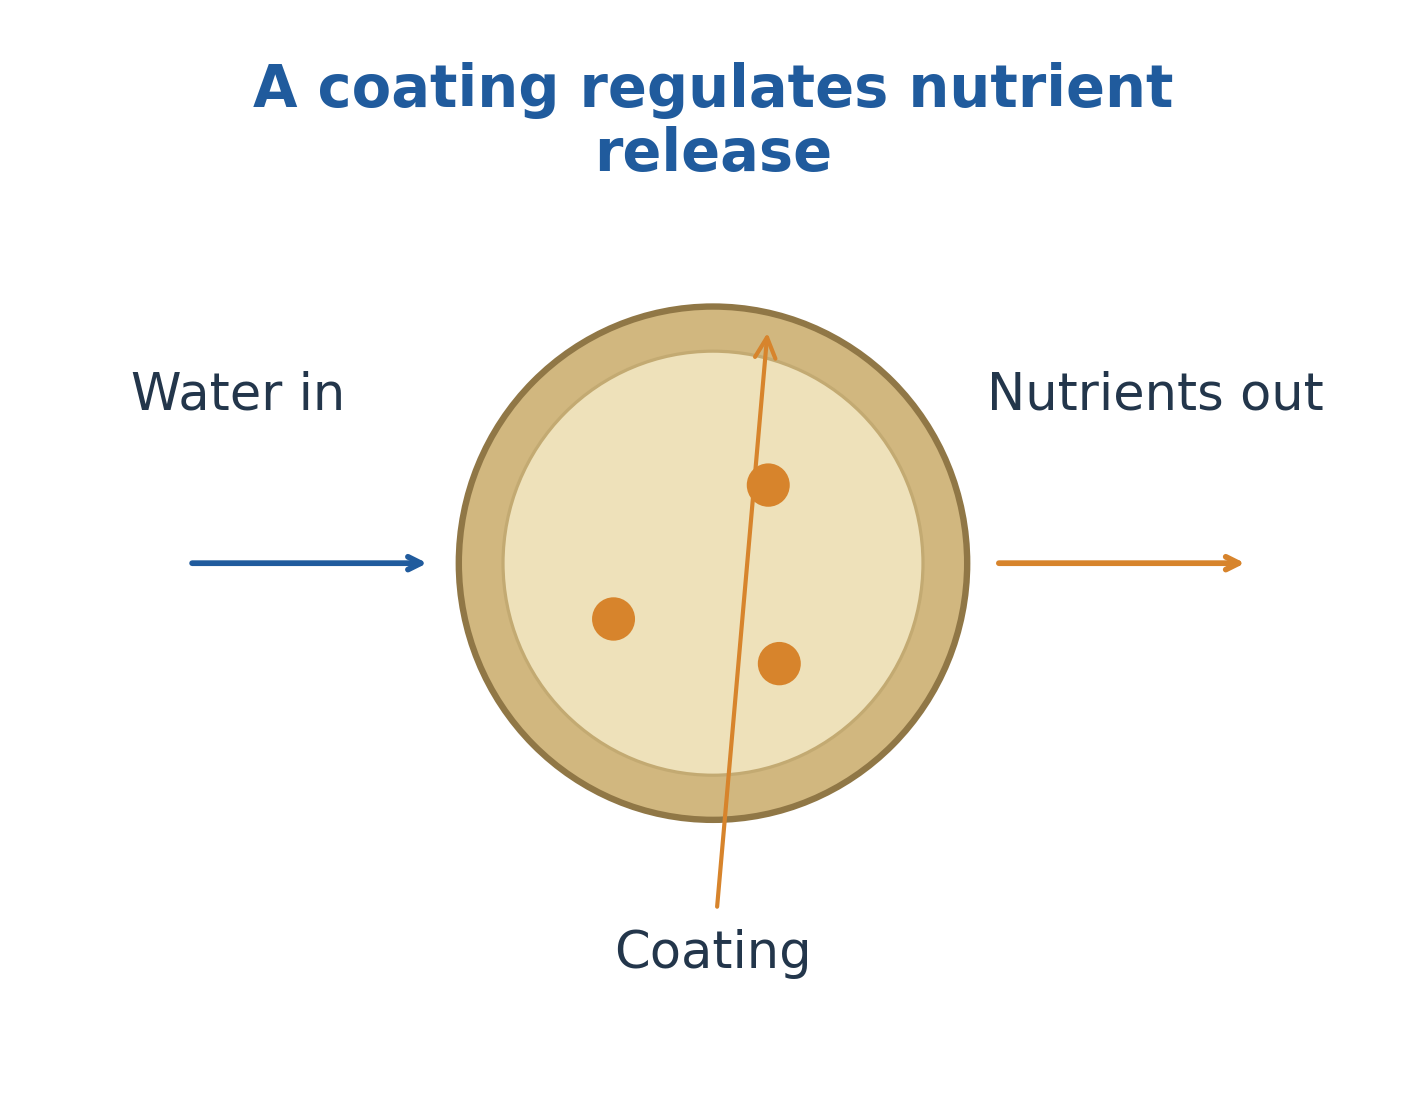

Slow release can involve gradual dissolution or transformation.
Controlled-release systems use engineered barriers or other mechanisms affected by moisture, temperature and integrity.
Grades conventionally express N, P2O5 equivalent and K2O equivalent rather than elemental P and K.
Convert before comparing nutrient inventories.
Worked Problem 3.40: DAP Basis
Problem: A supplied product is 18-46-0. Find material supplying forty-six kilograms P2O5 equivalent and accompanying nitrogen.
Solution:
Product = 46/0.46 = 100 kg
Nitrogen = 100 × 0.18 = 18 kg
Elemental P ≈ 46 × 0.4364 = 20.1 kg
Answer: Product 100 kg, accompanying nitrogen 18 kg, and elemental phosphorus approximately 20.1 kg.
Worked Problem 3.41: Released Fraction
Problem: A preparation contains eighty grams nutrient and releases twenty grams during the stated test.
Solution:
Released fraction = 20/80 = 25%
Remaining amount = 80 – 20 = 60 g
Answer: 25% released, with 60 g remaining.
One cumulative point does not establish a constant release rate.
41. Pesticide Classes and Chemical Families
Study route: AG
Pesticides can be classified by target or chemical family.
Insecticide, herbicide and fungicide describe target functions.
Organochlorine, organophosphate and pyrethroid describe chemical families.
A target category is not one unique structure.

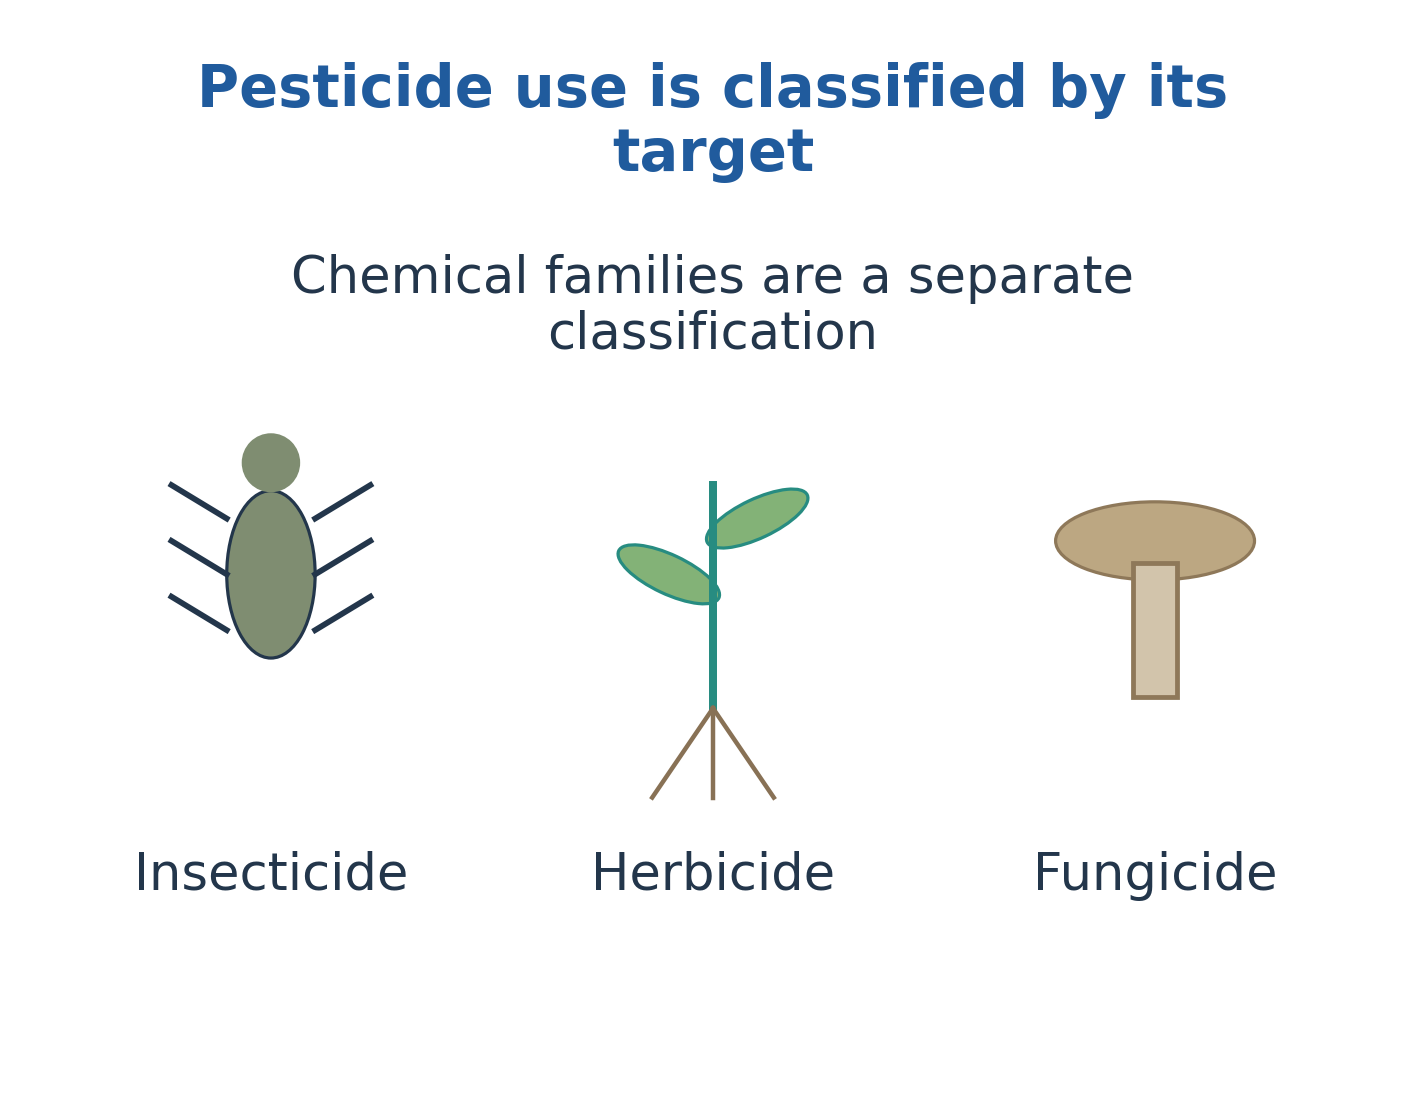
Activity, non-target effects and persistence depend on the actual ingredient, formulation, exposure and environment.
A family name alone does not establish identical properties for all members.
Natural origin also does not guarantee harmlessness.
Worked Problem 3.42: Classification Basis
Problem: Is every herbicide an organophosphate?
Solution:
Herbicide identifies the target function.
Organophosphate identifies a chemical family.
Answer: No. Target, chemistry and mechanism must be stated separately.
42. Pesticide Degradation, Transport and Persistence
Study route: AG
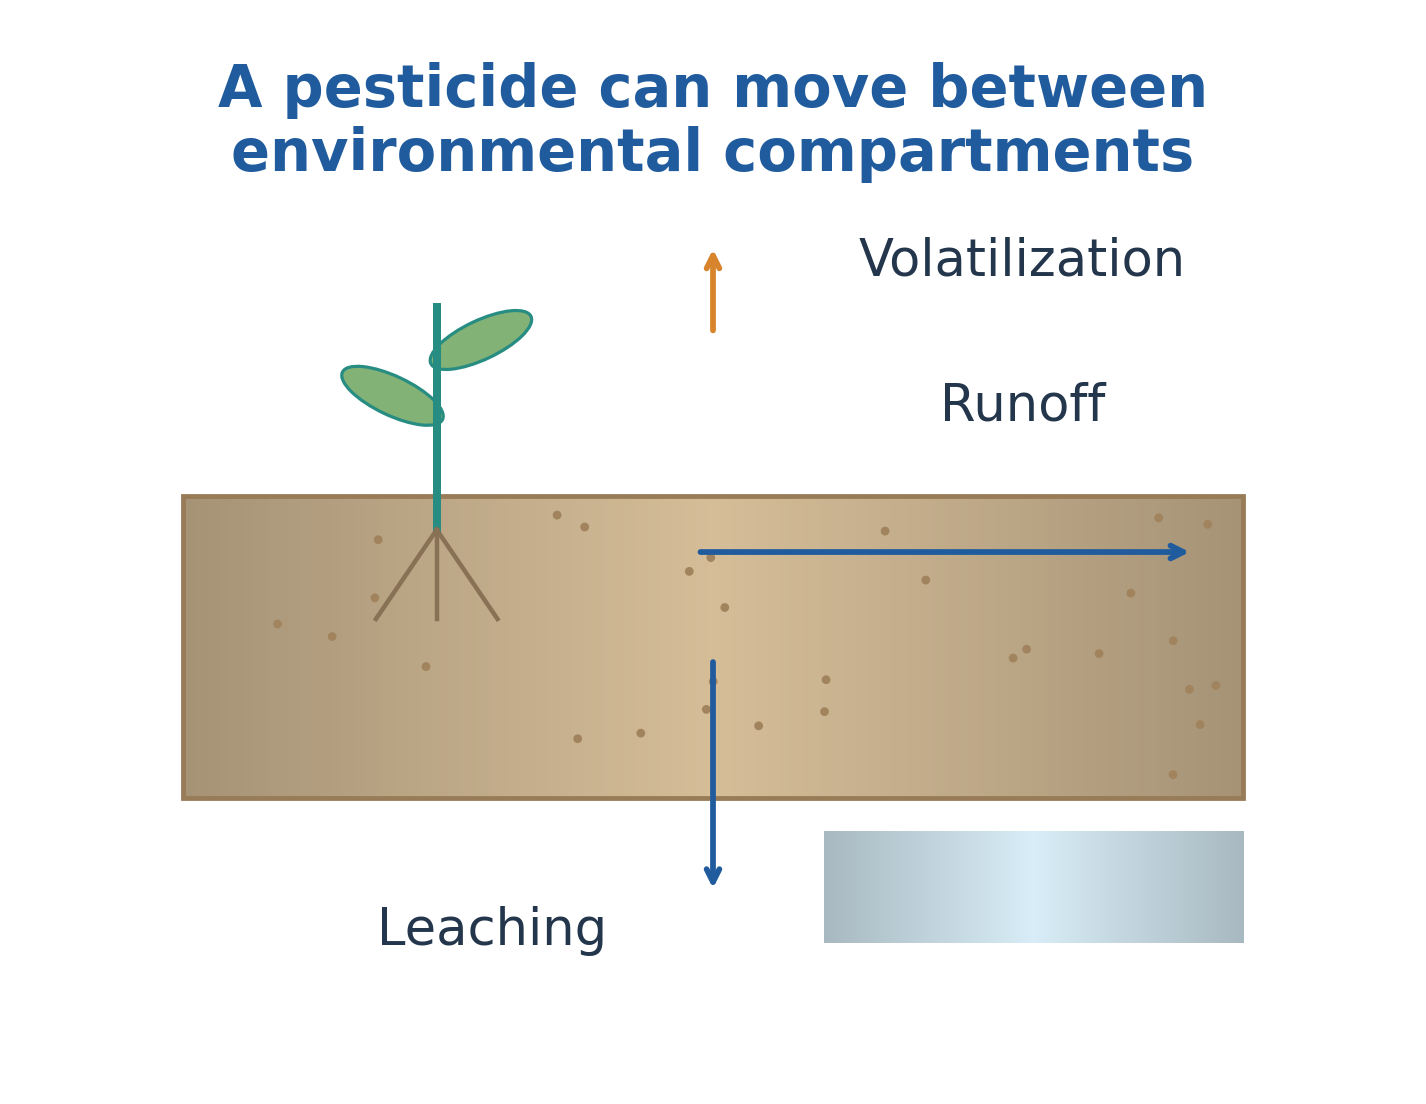
Hydrolysis, photolysis, oxidation and microbial reactions can transform pesticide molecules.
Sorption can reduce immediate dissolved mobility while retaining material in soil or sediment.
Volatilization, runoff and leaching move chemicals between compartments.
Movement is not the same as degradation.

For first-order loss:
C = C0 exp(-kt)
Half-life = ln 2/k
Environmental half-life depends on light, temperature, pH, moisture and biology.
Parent disappearance does not establish mineralization or harmless products.
Worked Problem 3.43: Half-Life
Problem: Half-life is ten days. Find remaining fraction after thirty days.
Solution:
Number of half-lives = 30/10 = 3
Remaining fraction = (1/2)^3 = 0.125
Answer: 12.5% remains under the supplied first-order model.
43. Environmental Effects of Excess Agrochemicals
Study route: AG
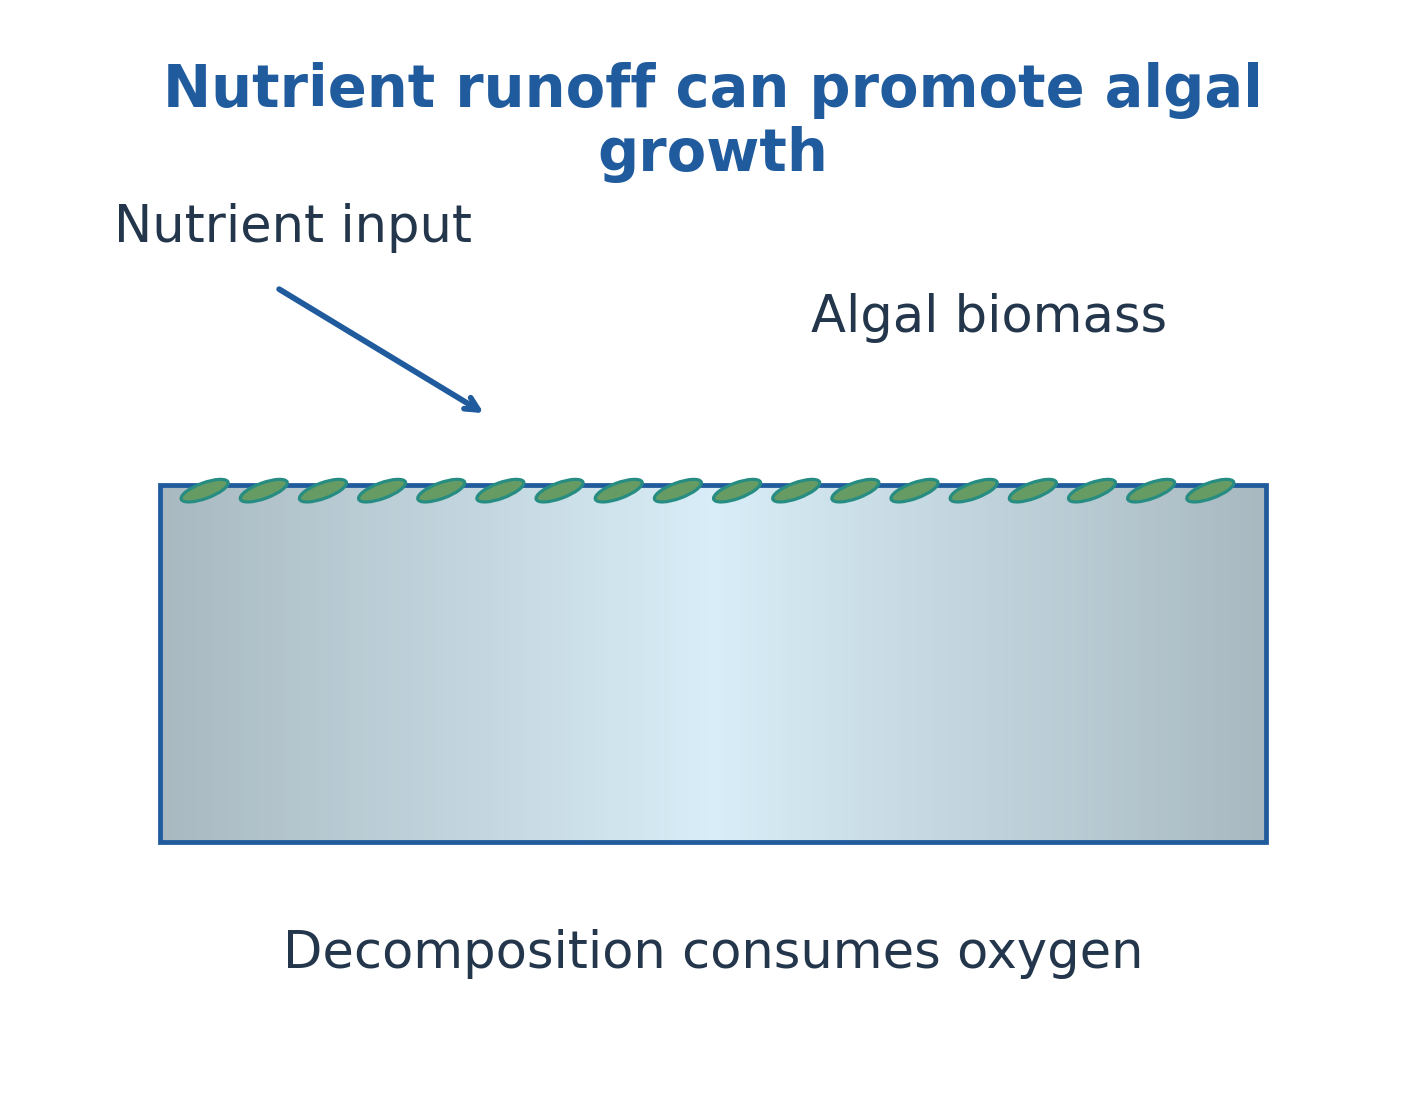
Excess nutrients can promote eutrophication and subsequent oxygen depletion.
Unsuitable nitrogen management can increase losses to water and air.
Excess pesticide exposure can affect beneficial organisms, contaminate soil or water and favour resistance selection.
Acute toxicity, nutrient deficiency and long-term accumulation are different questions.

Management uses soil and crop need, representative monitoring, targeted intervention and loss control.
Integrated approaches combine suitable biological, cultural and chemical methods.
A temporary crop response or clear sample does not establish every environmental outcome.
Worked Problem 3.44: Nutrient Balance
Problem: Input is one hundred kilograms nutrient, crop uptake fifty-five kilograms and retained soil inventory twenty-five kilograms.
Solution:
Unaccounted amount = 100 – 55 – 25
Unaccounted amount = 20 kg
Fraction = 20/100 = 20%
Answer: 20 kg, or 20%, is unaccounted.
It cannot all be called nitrate leaching without pathway measurements.
44. Desizing
Study route: TX
Size protects warp yarn during weaving but can obstruct later wet processing.
Desizing removes it through chemistry matched to the size.
Suitable amylases hydrolyse starch-based size. Synthetic size can require other removal conditions.
Identify fibre, size and processing history first.


Enzyme specificity, pH, temperature and time affect removal.
Wetting and washing remove soluble fragments.
Reaction without adequate removal can leave residues.
Desizing, scouring and bleaching address different material fractions.
Worked Problem 3.45: Desizing Efficiency
Problem: Initial removable size is eight grams and two grams remain.
Solution:
Removed size = 8 – 2 = 6 g
Efficiency = 6/8 × 100 = 75%
Answer: Size removal is 75%.
The six grams removed enter a process stream.
45. Scouring and Bleaching
Study route: TX
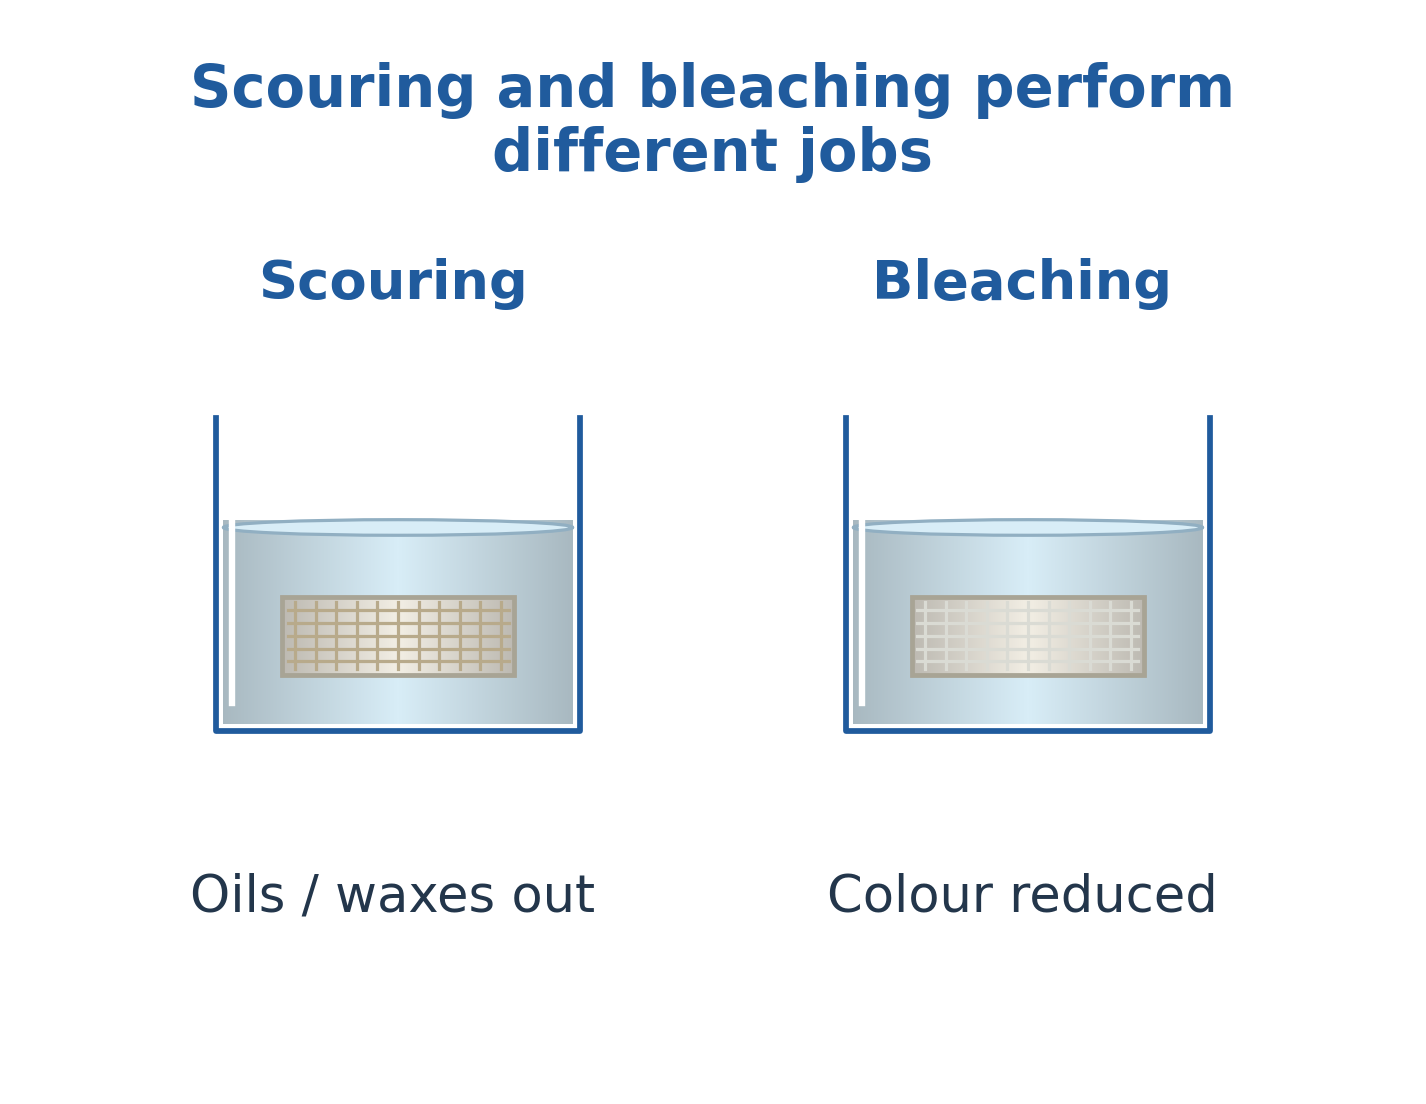
Scouring removes waxes, oils and other impurities to improve wetting.
Alkaline chemistry can saponify suitable esters, while surfactants help wetting, emulsification and removal.
Fibre sensitivity matters. Conditions appropriate for cellulose can damage protein fibres.


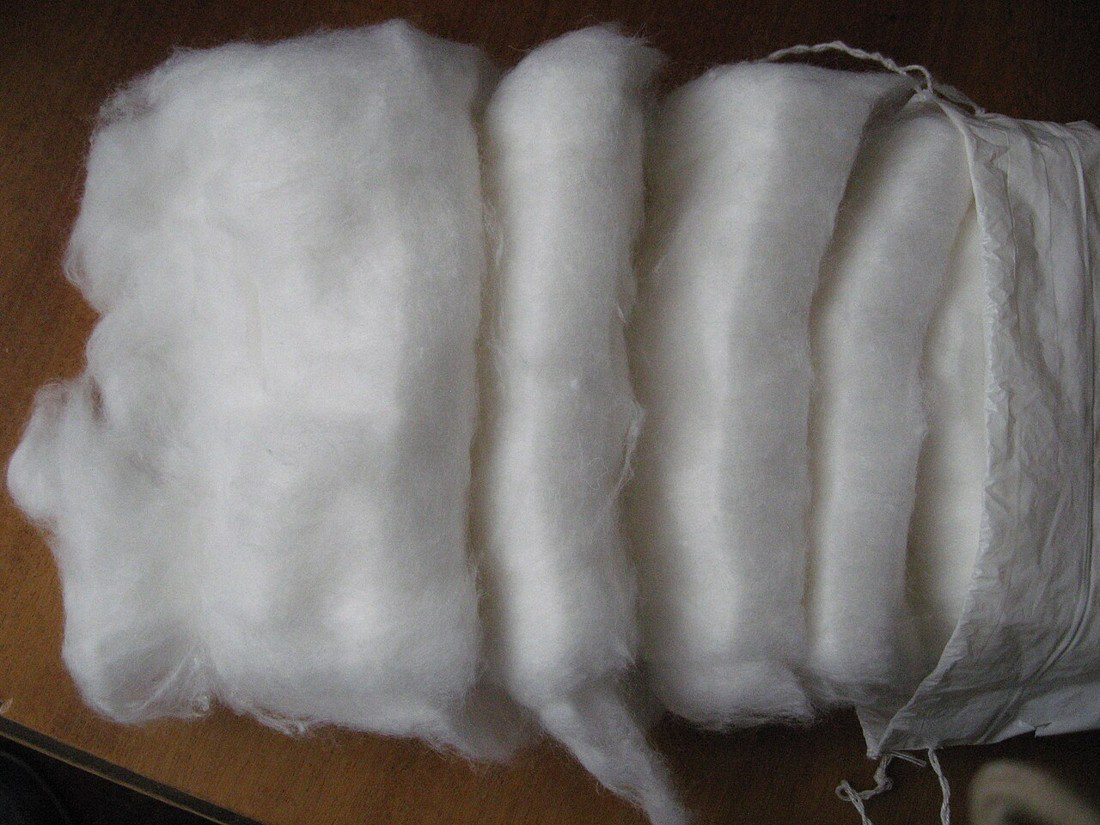
Bleaching reduces natural colour through controlled oxidation or reduction.
Peroxide systems require suitable pH, stabilization and metal-contamination control.
Excess treatment can damage fibres.
Absorbency, whiteness and strength retention are separate outcomes.
Worked Problem 3.46: Selecting the Operation
Problem: Cotton wets poorly but has little colour. Will bleaching alone necessarily solve the problem?
Solution:
Poor wetting can arise from hydrophobic impurities.
Scouring and washing address those fractions, while bleaching mainly addresses colour.
Answer: No. Select suitable scouring rather than assuming bleaching solves every preparation defect.
46. Direct, Reactive, Acid and Basic Dyes
Study route: TX
Direct dyes associate with suitable cellulose mainly through noncovalent interactions.
Reactive dyes form covalent links under appropriate fixation conditions, while competing hydrolysis can reduce useful fixation.
Acid dyes commonly interact with protonated sites on protein fibres or nylon.
Basic dyes suit appropriate anionic sites, including selected acrylic systems.

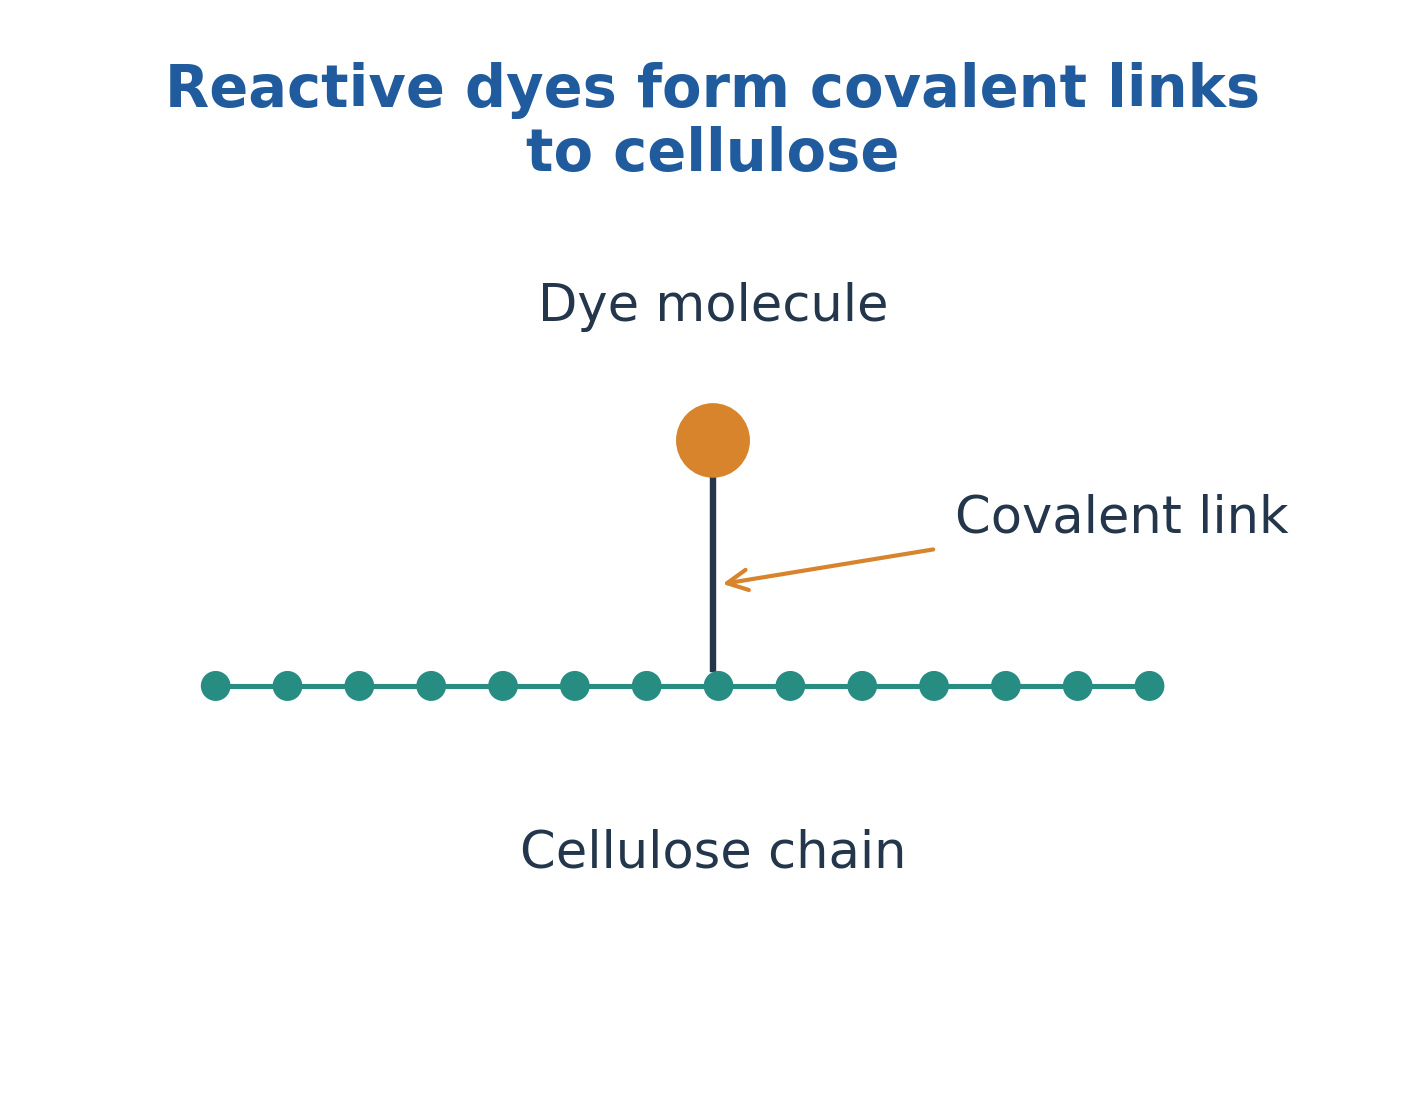
Charge, groups, accessibility and conditions determine compatibility.
Bath exhaustion is not durable fixation.
Transferred but unfixed colour can leave during washing.
Define initial, transferred and retained amounts before reporting percentages.
Worked Problem 3.47: Exhaustion
Problem: Initial bath dye is ten grams and 2.5 grams remain, with no other loss.
Solution:
Transferred dye = 10 – 2.5 = 7.5 g
Exhaustion = 7.5/10 × 100 = 75%
Answer: Exhaustion is 75%, not automatically seventy-five percent fixation.
Worked Problem 3.48: Exhaustion and Wash Fastness
Problem: Why can high reactive-dye exhaustion coexist with poor wash fastness?
Solution:
Transferred material can include unfixed or hydrolysed dye.
Durable retention requires suitable fixation and after-washing.
Answer: Transfer and durable bonding are different processes.
47. Vat and Disperse Dyes
Study route: TX
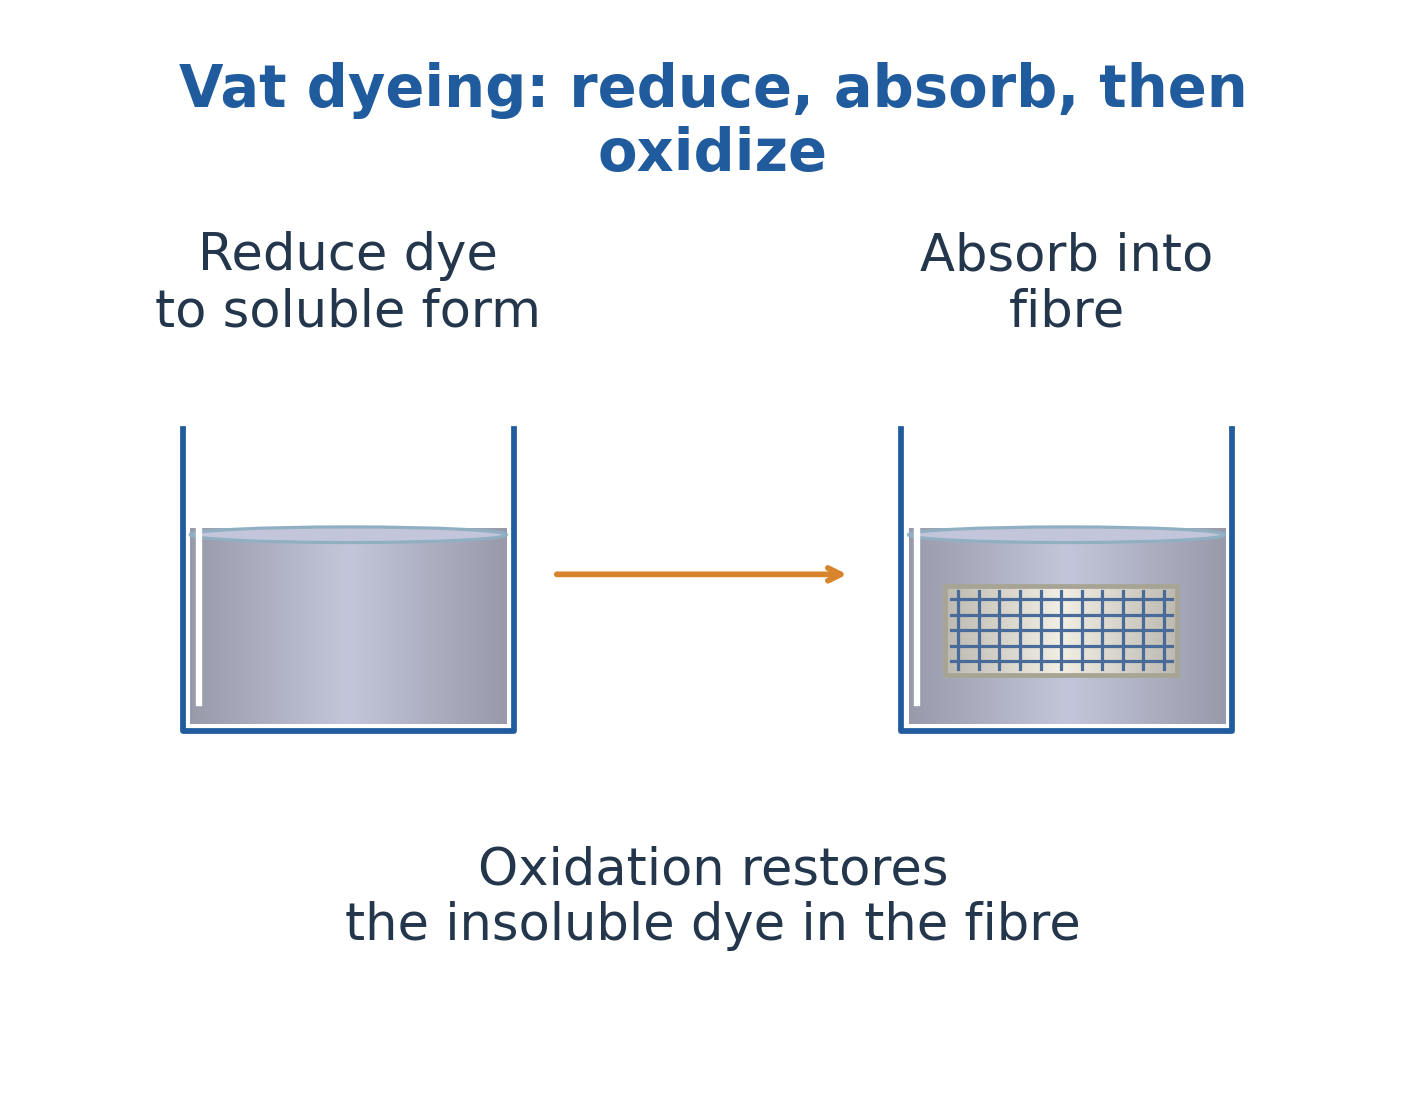
Vat dyes are reduced to a more soluble leuco form, transferred into fibre and reoxidized toward a less-soluble colourant.
Reduction, transport and oxidation are separate stages.
The mechanism is not simply dissolution of an unchanged insoluble pigment.

Disperse dyes have low water solubility and partition into suitable hydrophobic fibres such as polyester.
Morphology and dye-fibre interactions affect transport.
Hydrogen bonding, ionic attraction, nonpolar interactions and covalent reaction contribute differently across classes.
Do not assign one universal dyeing bond.
48. Printing Pastes, Fixation and After-Treatment
Study route: TX
Printing localizes colour using a paste containing colourant, thickener and appropriate auxiliaries.
Thickener controls distribution and pattern definition.
Fixation depends on the dye-fibre system and can use suitable heat, steam or reaction conditions.

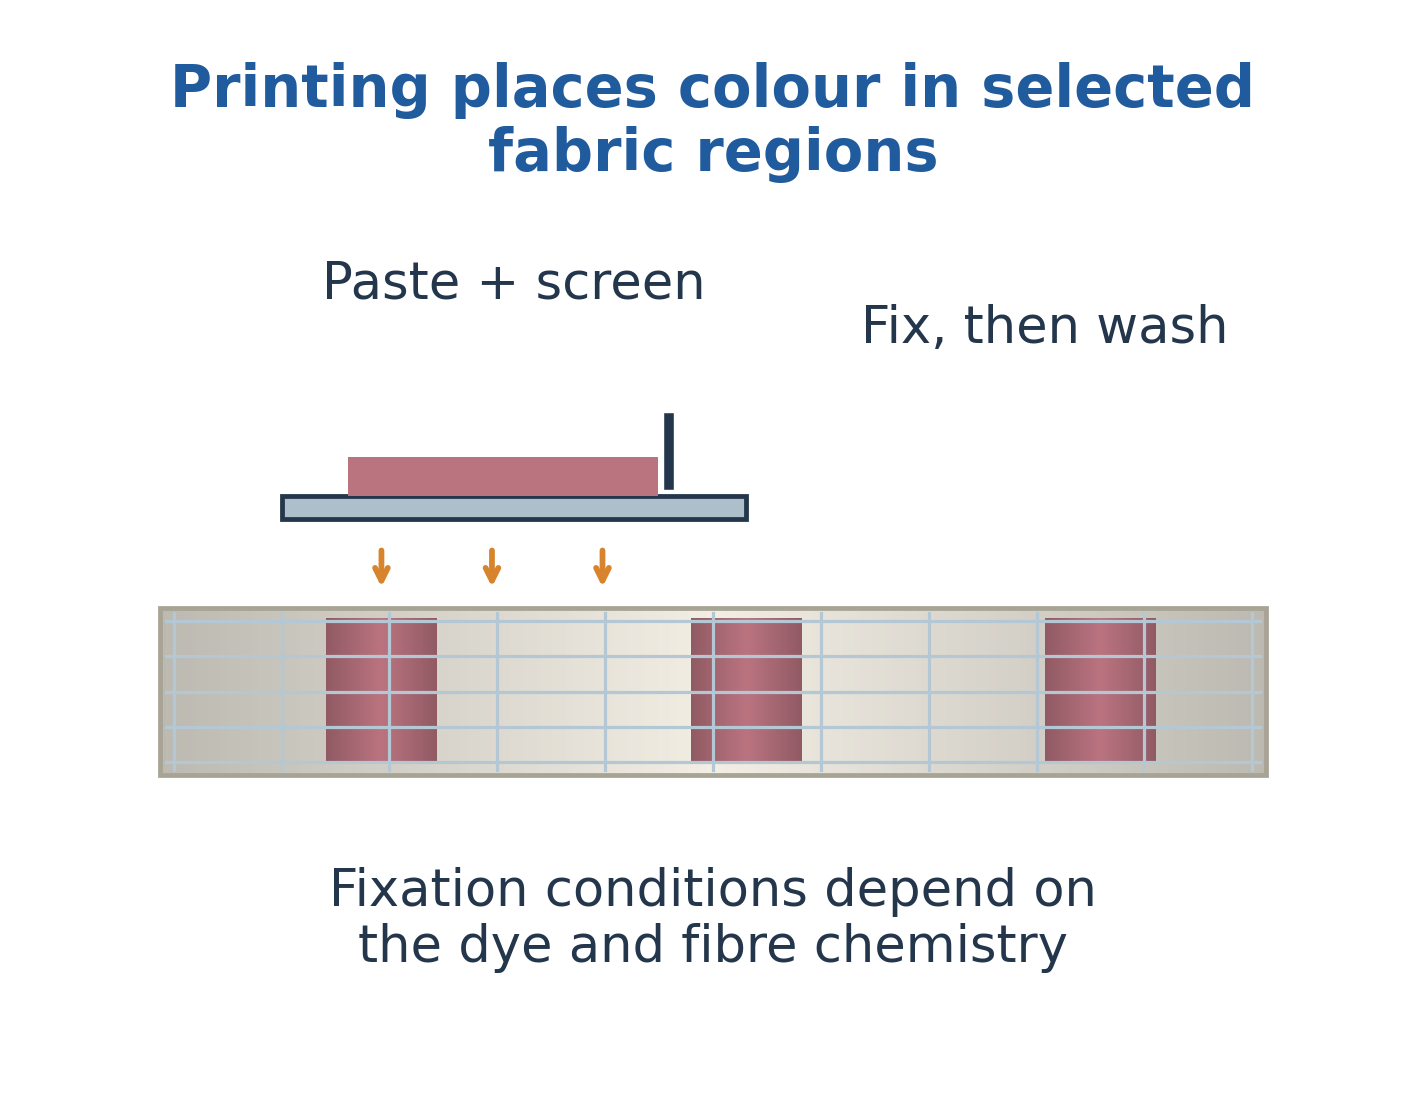
After-treatment removes thickener, unfixed colour and residual chemicals.
A sharp initial pattern does not establish wash durability.
Exhaustion, fixation and retained colour need stated denominators.
Worked Problem 3.49: Two Fixation Bases
Problem: Ten grams dye are supplied, 7.5 grams transfer and six grams remain after washing.
Solution:
Initial-basis fixation = 6/10 × 100 = 60%
Exhausted-basis fixation = 6/7.5 × 100 = 80%
Answer: Fixation is 60% of initial dye or 80% of exhausted dye.
49. Water and Effluent Chemistry in Wet Processing
Study route: TX
Water hardness can affect auxiliaries, precipitation and shade uniformity.
Effluent can contain colour, salts, surfactants, organic load and process-specific constituents.
Equalization and pH control can prepare a more consistent feed.
Different biological and chemical operations address different targets.

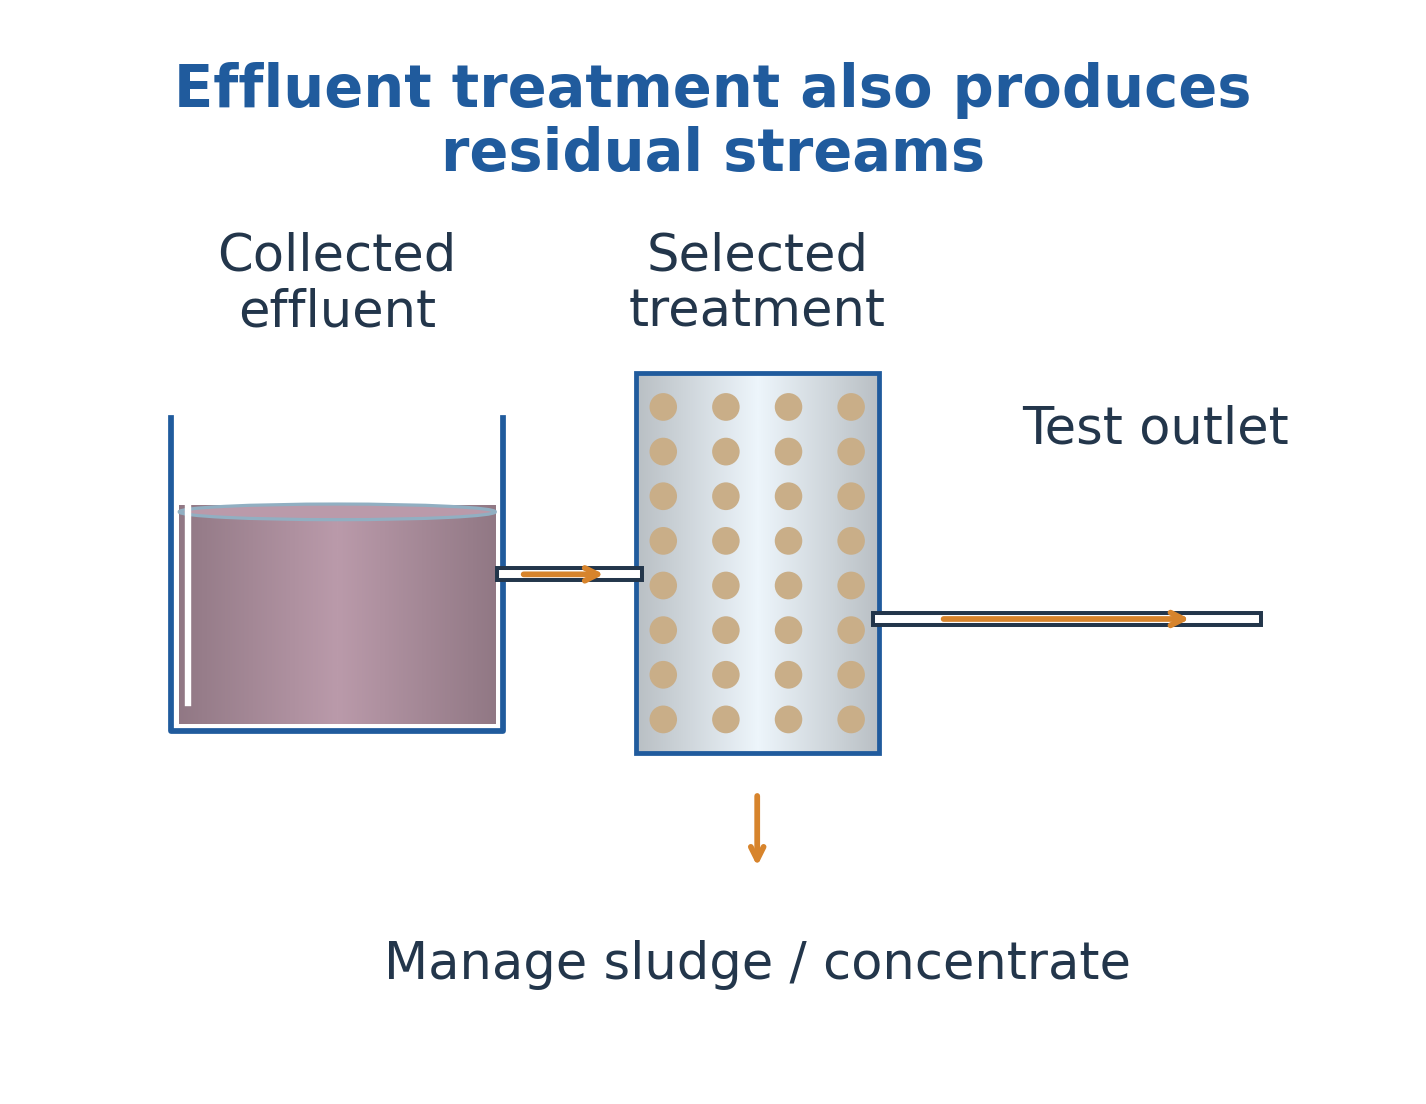
Colour removal does not prove COD removal.
Filtration does not necessarily remove dissolved salts.
Treatment may combine solids separation, biological conversion, oxidation, adsorption and polishing.
Use actual inventory and measured properties to connect textile quality with environmental performance.
Worked Problem 3.50: COD Load
Problem: Flow is 20 m³/day and COD is 500 mg/L.
Solution:
500 mg/L = 0.500 kg/m³
Daily load = 20 × 0.500
Daily load = 10 kg/day
Answer: COD load is 10 kg/day.
Dilution alone can lower concentration without reducing mass load.
Closing a Dye Balance
Let initial dye be D0 and remaining bath dye be Db.
Exhaustion = (D0 – Db)/D0
Suppose initial dye is one hundred grams, thirty remain in bath and fifty remain durably after washing.
Exhaustion = 70%
Initial-basis fixation = 50%
Exhausted-basis fixation = 50/70 × 100 = 71.4%
Twenty grams transferred but not retained must be assigned to wash water or another outlet.
If volume changes, calculate mass from concentration and volume rather than comparing concentrations alone.
50. Integrated Explanations and Application Connections
50.1 Follow a Chemical Measurement from Sample to Result
A chemical measurement begins before the sensor produces a number. The sample must represent the intended place, material and time.
Preparation can dilute a target, remove a particulate fraction or alter its chemical form. The recognition layer responds to what actually reaches its surface.
The transducer converts the interaction into a signal. Calibration assigns a chemical interpretation under specified conditions.
A correct electronic reading cannot recover an unrecorded change made during sampling or preparation.
For y = b + mC, use C = (y-b)/m. Offset and sensitivity must remain separate.
A large slope does not prove that only the target causes the response. Interferents can generate substantial signals.
Closely grouped repeated measurements demonstrate precision, while a shared offset can still cause bias.
Validation should challenge the complete method. Blanks assess background, additions test recovery and independent references can reveal disagreement.
Temperature, salts, humidity, pH and fouling can change response.
Report quantity, units, range and preparation basis together.
50.2 Compare Electrical and Optical Sensor Signals
Amperometry follows reaction current under suitable potential control.
The working surface reacts, the reference defines potential and the counter carries balancing current.
Current depends on reaction and transport. A supplied molar reaction rate gives current through electron stoichiometry, but concentration needs an additional valid relation.
Potentiometry measures potential with minimal current. Ideal response is logarithmic in activity, not universally linear in concentration.
Optical absorbance also uses a logarithm but measures another interaction.
Half the reference intensity gives transmittance 0.5 and absorbance approximately 0.301.
Always identify current, potential, resistance, intensity or frequency first. Then explain the chemical cause and calibration.
A MEMS platform can contain different sensing principles. Platform size and fabrication do not establish universal chemical specificity.
50.3 Biosensors and Tags Need Complete Measurement Chains
Biological recognition is useful but is not the complete measurement.
Enzyme sensors need suitable conversion. Immunosensors need signal generation after binding. DNA sensors need sequence recognition connected to a readout.
Immobilization can retain recognition material while changing access and activity.
The presence of a biological receptor does not alone establish reliable quantification in another matrix.
DNA directionality illustrates this requirement. ATGC pairs with an antiparallel TACG, while its partner written in its own five-prime direction is GCAT.
Omitting direction can make an otherwise correct base list ambiguous.
Responsive RFID adds another chain. Communication needs antenna, substrate and electronics. Chemical measurement needs a calibrated film response.
Changing capacitance can shift resonance, but distance and alignment also change read behaviour.
A successful tag read and a valid concentration result are different outcomes.
50.4 Validate Pattern Recognition Independently
An electronic nose combines partially selective channels.
Baseline correction, normalization and temporal or steady features support comparison.
A classifier acts on those features. Correct classifier arithmetic does not validate the original sampling or chemistry.
A sample can be nearer to one centroid while still far from every known class.
A rejection threshold prevents forced classification within the stated model.
Independent validation should represent humidity, temperature, concentration and matrix variation.
Training observations alone can conceal poor performance on new conditions.
Drift can change features without changing sample identity.
A classification is not automatically a calibrated concentration for every constituent.
Define whether output means identification, grouping, alarm or quantification. Match validation and decision rules to that purpose.
50.5 Select Dielectrics Using More Than Permittivity
High relative permittivity increases ideal capacitance for fixed geometry.
Useful components also need acceptable leakage, loss and breakdown.
These concern polarization, unwanted conduction, dissipation and failure through different processes.
Frequency matters because polarization mechanisms respond on different timescales.
At fixed voltage, energy increases with C. At fixed charge, energy decreases with C.
These statements are consistent because the circuit boundary differs.
A source can exchange energy during a voltage-maintained change. An isolated fixed-charge model has another constraint.
Piezoelectric and ferroelectric behaviour impose structural requirements beyond ordinary dielectric polarization.
Composition, symmetry, domains, processing and temperature influence response.
Charge sensitivity does not determine voltage without capacitance and circuit conditions.
50.6 Distinguish Modulation, Emission and Guidance
LCDs control transmission. Their liquid-crystal orientation changes the response between polarizers.
The backlight or environment supplies the incident light.
A diagram should follow light and polarization through the device instead of calling every display an electrical lamp.
LEDs generate photons through suitable electrically produced excitations.
Electronic structure influences energy, while losses and extraction influence delivered output.
Phosphors add an excitation-conversion role. They are different from the injecting junction even when combined.
Optical fibres guide light through index structure.
Numerical aperture describes acceptance, not attenuation or total communication capacity.
Faraday rotation adds a magnetic-optical interaction used for nonreciprocal functions.
Identify whether the task is transmission, modulation, emission, conversion or guidance before selecting materials and measurements.
50.7 Compare Magnetic Properties for the Required Duty
Repeated-flux cores and permanent magnets need different properties.
Remanence, coercivity, permeability and saturation answer different questions.
A high value of one quantity does not establish every application.
Ferrite resistivity can help reduce eddy-current effects, but frequency response depends on composition, geometry and operating state.
Rare-earth magnets offer strong retained fields with additional temperature and corrosion constraints.
Material family is not a universal rating.
Energy per cycle multiplied by frequency gives average power.
A whole-core total loss cannot be assigned entirely to hysteresis without separating contributions.
Loop area can represent energy per cycle per volume, so boundary and volume factors must be stated.
50.8 Match Lubricant Tests with Contact Conditions
Hydrodynamic, boundary and mixed regimes depend on load, speed and geometry.
Dynamic viscosity describes shear resistance; kinematic viscosity includes density.
Both need temperature.
High viscosity can support a film in one situation and increase drag or impair delivery in another.
Viscosity index does not replace viscosity at service temperature.
Flash, fire and pour points are distinct standardized observations, not one universal operating range.
Oxidation and contamination create additional requirements.
Additives must match the failure process. Solid lubricants need environmental compatibility.
Grease contains a fluid and thickening system rather than being a universal solid oil.
Explain regime, delivery, surface interaction and contamination before selecting a formulation.
50.9 Separate Fuel Energy from Ignition Quality
HCV and LCV differ through treatment of water-condensation heat.
Hydrogen and initial moisture need consistent bases.
A neat subtraction using mismatched dry and as-received values can be chemically wrong.
Useful output first requires efficiency correction before calculating fuel amount.
Gas volume and volumetric heating value need matching conditions.
Gross biogas thermal power is not automatically electrical output.
Octane and cetane describe engine ignition behaviour.
Reference equivalence does not state commercial composition.
Proximate fixed carbon differs from ultimate elemental carbon.
A complete fuel assessment separates basis, energy, ignition, residues and equipment requirements.
50.10 Account for Biofuel Process Outputs
Biodiesel formation changes oil or fat into ester products with a glycerol-containing co-product.
Bioethanol uses another feed-conversion and recovery route.
Renewable origin does not remove processing energy and material requirements.
Anaerobic digestion includes several biological stages, suitable conditions, collection and digestate management.
Not every wet-feed component becomes methane.
Gas composition and impurities affect downstream equipment.
Start energy calculations with combustible-constituent quantity.
Multiply gas volume by methane fraction, then by the matched heating value.
Useful output needs device efficiency and auxiliaries.
Retain feed moisture and digestate in the wider material balance even when only gas energy is requested.
50.11 Choose Water Tests Before Treatment
Hardness, alkalinity, pH and oxygen tests represent different properties.
Clear water can have dissolved salts or substantial demand.
No single measurement identifies every necessary treatment.
Equivalent conversion permits calcium and magnesium comparison.
Adding bare masses ignores charge-to-mass differences.
CaCO3 reporting does not imply all material is physically calcium carbonate.
Dilution BOD uses corrected bottle oxygen change divided by sample fraction.
It is not the original DO value.
COD follows another procedure.
Select the measurement matching the process target, then verify whether the chosen treatment addresses it.
50.12 Follow Water and Residual Streams
Coagulation changes stability. Flocculation grows aggregates. Settling and filtration separate selected material.
They are not interchangeable operations.
Excess shear can damage flocs, and clarification does not establish dissolved-ion removal.
Chlorine demand, UV transmission and ozone contact create different disinfection constraints.
Nominal dose is not the same as verified outcome.
Pretreatment can support later stages.
Biological treatment creates biomass. Ion exchange creates regenerant streams. Membranes create retentate.
Include sludge, backwash and concentrates.
Lower concentration can reflect dilution, so use loads where flow changes.
Cleaner main water does not make the removed inventory disappear.
50.13 Separate Softening from Demineralization
Sodium softening retains calcium and magnesium while releasing sodium.
It does not remove every salt or create sodium-free water.
Regeneration transfers retained constituents to brine.
H/OH demineralization uses different exchange forms.
Capacity and demand must use one consistent charge or CaCO3 basis.
A charge capacity cannot be divided directly by an unrelated bare ion mass.
Practical service ends according to breakthrough specification, not only theoretical site inventory.
Fouling and leakage affect output.
Explain exchange form, target, usable capacity, regeneration and outlet verification.
50.14 Connect Catalytic Rate with Selectivity
Catalysis changes pathways, not equilibrium for the same reaction at fixed conditions.
Surface operation includes transport, adsorption, reaction and desorption.
More area does not prove proportional output if access or another step limits rate.
Conversion, selectivity and yield need different denominators.
Sixty percent conversion and seventy-five percent desired selectivity can give forty-five percent feed yield for the stated one-to-one case.
The values are consistent rather than contradictory.
Poisoning, coke, sintering and leaching require different diagnoses.
Supports influence access and stability.
Regeneration can fail to reverse structural damage.
Compare matched rates and transport conditions before assigning a decline to intrinsic activity.
50.15 Keep Adsorption Models within Their Range
Adsorption is a surface process. Useful loading depends on accessibility, identity and environment.
Nominal area alone does not establish uptake during a finite contact time.
Retain preparation and concentration conventions with the result.
Langmuir approaches finite qmax under its assumptions.
At bC = 1, half-loading provides an arithmetic check.
Freundlich is empirical and does not impose the same saturation.
A good fit does not uniquely prove microscopic mechanism.
BET area is based on suitable gas adsorption and a fitting interval.
That area is not automatically accessible to every larger liquid-phase reactant.
Connect the estimated area with application conditions before predicting catalytic activity or removal.
50.16 Separate Resolution, Rejection and Recovery
Chromatography uses repeated interaction with stationary and mobile phases.
Retention time depends on the system.
Strong retention alone does not guarantee useful purity or recovery.
Resolution formulas use defined width conventions.
A value based on baseline widths cannot be calculated with half-height widths unchanged.
Collected fractions and remaining material need a balance.
Membrane rejection compares concentrations. Recovery compares flows.
High rejection is not the same as high water recovery.
Contaminants can remain in retentate.
Separation redistributes material, while conversion changes identity. An integrated system may do both, but the claims must distinguish them.
50.17 Interpret Enzyme Parameters with Their Mechanism
Enzyme names and applications do not replace reaction descriptions.
Active sites can support proton transfer, covalent intermediates, metals and positioning.
Binding, conversion and release all matter.
For the simple model, half Vmax occurs at Km.
Km combines binding and catalytic steps rather than always being a dissociation constant.
Vmax depends on active-site amount, and kcat requires consistent molar units.
Inhibition patterns need the stated model.
Competitive, pure noncompetitive and uncompetitive cases have different ideal parameter changes.
Mixed and allosteric behaviour are more general.
Do not classify every off-active-site interaction by name alone.
50.18 Evaluate Immobilization at Process Scale
Immobilization can improve retention and separation while changing access and conformation.
Support diffusion can lower observed rate without changing intrinsic chemistry.
Bound protein does not automatically equal active catalyst.
Attachment yield and activity recovery have different numerators.
Reuse depends on leaching, fouling, strength and operating cycles.
A preparation is not indefinitely stable merely because it remains attached.
Engineering benefits must be verified in the actual substrate and matrix.
Mass-specific productivity is not kcat.
Connect sequence change, active preparation, assay and product-quality outcome before claiming improved process performance.
50.19 Follow Agrochemical Inventories and Fate
Grade gives nutrient inventory, while crop recovery gives fate.
Hydrolysis, nitrification, volatilization and uptake are different pathways.
A dose calculation is not a complete field recommendation.
N-P2O5-K2O reporting requires conversion for elemental balances.
Controlled release needs an interval and receiving conditions.
One cumulative result does not demonstrate constant delivery or perfect crop matching.
Target category and chemical family remain separate.
Sorption and movement can lower one sampled concentration without chemical destruction.
Parent transformation does not prove harmless products.
Follow compartments and measured outlets rather than assigning unaccounted material to one pathway.
50.20 Close Textile Chemical and Water Balances
Desizing, scouring and bleaching remove different targets.
A white fabric can still wet poorly. Good absorbency does not alone establish retained strength.
Match fibre and impurity chemistry, then wash out products.
Dyeing includes transfer and fixation.
High exhaustion is not automatically durable retention.
Different fixation percentages can all be correct when denominators differ.
Transferred but unretained dye belongs to another stream.
Printing adds localization and rheology, while fixation secures colour.
Effluent contains constituents requiring different treatment functions.
COD multiplied by flow gives load; dilution alone does not remove mass.
Include sludge, adsorbent and concentrate when relevant.
51. Formula Revision
| Topic | Formula and condition |
|---|---|
| Linear calibration | C = (y – b)/m |
| Optical absorbance | A = log10(I0/I) |
| Beer-Lambert relation | A = epsilon l c in the stated range |
| Ideal potentiometry | E = E0 + RT ln(a)/(zF), using the stated convention |
| Ideal capacitance | C = epsilon0 epsilon_r A/d |
| Fixed-voltage energy | U = CV²/2 |
| Kinematic viscosity | nu = mu/rho |
| Heating-value conversion | LCV = HCV – (9wH + wM)Lv |
| Hardness equivalent | Ion mg/L × 50/Equivalent weight |
| Dilution BOD | Corrected DO decrease / Sample fraction |
| Langmuir | q = qmax bC/(1 + bC) |
| Freundlich | q = K C^(1/n) |
| Membrane rejection | 1 – Cp/Cf |
| Membrane recovery | Permeate flow / Feed flow |
| Michaelis-Menten | v = Vmax S/(Km + S) |
| Turnover number | kcat = Vmax/Active-site amount |
| First-order decay | Ct = C0 exp(-kt) |
| Half-life | ln 2/k |
| Nutrient dose | Required nutrient / Nutrient fraction |
| Initial-basis fixation | Retained dye / Initial dye |
| Effluent load | Flow × Concentration |
Useful Conversions
- One kWh equals 3.6 MJ.
- One kW equals one kJ/s.
- Ion meq/L equals ion mg/L divided by numerical equivalent weight.
- Elemental P ≈ 0.4364 × P2O5 equivalent.
- Elemental K ≈ 0.8301 × K2O equivalent.
- Mass, mole, volume and charge fractions require their own bases.
52. Answered Examination Checks
CSE: Can Sensitivity Prove Selectivity?
No. A large slope does not show discrimination against interfering species.
Test matrix effects, recovery, blanks and drift.
An electronic nose is valid only within a suitably evaluated sampling and model domain.
EE/ECE: Are All Dielectrics Piezoelectric?
No. Dielectric polarization is broader than piezoelectric coupling.
Symmetry and structure determine permitted coupling.
Ferroelectricity additionally includes switchable spontaneous polarization under suitable conditions.
ME: Are Octane and Cetane Energy Ratings?
No. Octane concerns knock resistance and cetane concerns compression-ignition quality.
Heating value measures energy per quantity of fuel.
The ratings cannot replace one another.
CE: Does Sodium Softening Remove Every Salt?
No. Calcium and magnesium are exchanged for sodium.
Hardness falls while dissolved ions remain.
Demineralization, clarification and disinfection address different targets.
CH: Does a Catalyst Change Equilibrium?
A catalyst changes the kinetic route but not the equilibrium constant of the same reaction at fixed temperature.
Transport and deactivation must be distinguished from intrinsic rate.
BT: Is Km Always a Dissociation Constant?
No. In the simple mechanism, Km combines binding and catalytic constants.
Equality with a binding dissociation constant needs additional assumptions.
AG: Is Fertilizer Grade Elemental N-P-K?
Conventionally it reports N, P2O5 equivalent and K2O equivalent.
Convert before comparing elemental inventories.
Release, crop uptake and environmental loss remain separate quantities.
TX: Does Exhaustion Equal Permanent Fixation?
No. Exhaustion measures departure from the bath.
Some transferred colour remains unfixed and leaves during washing.
Fixation and after-treatment determine durable retention.