
Course: Environment & Sustainability
University: AKTU
Programme: B.Tech First Year | Semester I & II
Course Codes: AAC101 / AAC201
Unit: IV – Climate Change and Sustainable Development
Common Streams: CSE, EE, ECE, CE, ME, BT, CH, TX & AG
Website: www.notesgallery.com
Unit IV Introduction
Climate Change and Sustainable Development explains the greenhouse effect, the causes and impacts of climate change, and practical responses. It connects personal choices with infrastructure, energy and the wider needs of society.
The unit introduces carbon-footprint estimates, sustainable development and all 17 United Nations Sustainable Development Goals. Solar, wind and biomass are covered at awareness level, with clear examples and limitations rather than advanced plant-design calculations.
These Environment and Sustainability Unit 4 Notes include the unit’s explanations, tables, examples, calculations, illustrations, activities and examination questions.
Syllabus Coverage
| Topic | PDF Pages |
|---|---|
| Weather, climate and global warming | 2 |
| Greenhouse effect and causes | 3–4 |
| Climate impacts and local risk | 5–6 |
| Mitigation and adaptation | 7 |
| Carbon footprint: concept and estimates | 8–10 |
| Reducing a personal footprint | 11 |
| Sustainable development and decisions | 12–13 |
| Overview of all 17 SDGs | 14–16 |
| Solar, wind and biomass awareness | 17–19 |
| Revision and exam questions | 20 |
Shared scope: Common to all nine listed streams. Illustrations are conceptual; numerical examples use clearly stated assumptions.
How to Use This Unit
Read the concept, identify its mechanism and connect it to an appropriate local example. Use the coverage table to locate a topic, then finish with the revision questions.
Learning Outcomes
- Distinguish weather, climate, global warming and climate change.
- Explain the natural and enhanced greenhouse effect.
- Describe major causes, impacts and practical responses.
- Calculate a simple footprint using stated activity data and illustrative factors.
- Explain sustainable development and identify all 17 SDGs.
- Compare solar, wind and biomass at awareness level.
- Plan a justified personal or campus action without overstating its result.
Key Vocabulary
| Term | Meaning |
|---|---|
| Greenhouse gas | Gas that absorbs and emits infrared radiation |
| Mitigation | Action to reduce emissions or enhance removals |
| Adaptation | Adjustment to climate effects and risks |
| Carbon footprint | Estimated greenhouse-gas emissions within a defined boundary |
| CO₂e | A common unit for comparing greenhouse gases using a stated metric |
| Sustainability | Meeting needs while protecting ecological and social capacity |
| SDGs | Seventeen connected global development goals |
Study Approach
Connect each concept to a cause, a practical example and a justified response. Read diagram labels and arrow directions before memorising the figure.
Use this approach throughout these Environment and Sustainability Unit 4 Notes.
1. Weather, Climate and Warming
1.1 Weather and Climate
Weather describes short-term atmospheric conditions such as today’s temperature, rain or wind. Climate describes the statistical pattern of conditions over longer periods, including averages, variability and extremes. Climate is not simply the temperature on one particular day.
| Point | Weather | Climate |
|---|---|---|
| Timescale | Short-term conditions | Long-term patterns and distributions |
| Example | A heavy shower this afternoon | Seasonal rainfall pattern and its variability |
| Evidence | Observations at a time and place | Consistent records over suitable periods |
| What one event shows | The event occurred | Not by itself a long-term climate trend |
1.2 Global Warming
Global warming is the long-term increase in Earth’s average surface temperature. A global average does not mean every place warms equally or that cold days disappear. Local weather continues to vary around a changing background.
1.3 Climate Change
Climate change is broader: persistent changes in climate conditions, including temperature, rainfall patterns, extremes and related ocean or ice conditions. Global warming is a central part of current climate change, but the terms are not exact synonyms.
A useful analogy
A change in a student’s long-term average marks does not mean every test result changes in the same way. Similarly, a changing climate does not make every day identical or every region respond equally.
1.4 Reading Climate Evidence
Patterns need records
A reliable analysis uses consistent observations, appropriate periods and methods that account for variation. One unusually hot day is not sufficient to establish the size of long-term warming. Multiple lines of evidence help distinguish persistent change from short-term fluctuations.
Local and global questions differ
A local heatwave affects a particular area and period. Global mean temperature summarises conditions over the planet. Both are useful, but one cannot be substituted directly for the other. Define the geographic boundary and time period when describing a trend.
Common misconceptions
| Claim | Correction |
|---|---|
| A cold day disproves warming | Short-term local variability can occur during long-term global warming |
| Every flood has one cause | Rainfall, drainage, land use, exposure and other factors can combine |
| Climate is only temperature | Rainfall, variability and extremes also matter |
| An image proves a trend | Images need dates, comparable conditions and broader evidence |
1.5 Cause and Attribution
Explaining a particular event involves more than noting that the climate is warming. Event attribution studies assess how influences change the probability or intensity of an event. A basic awareness answer should avoid claiming that climate change is the sole cause of every local incident.
Exam answer pattern
Define each term, state its timescale and give one example. Then explain why an individual weather event and a long-term climate trend require different evidence.
2. The Greenhouse Effect
2.1 Natural Mechanism
Sunlight supplies energy to Earth. The surface and atmosphere reflect some incoming energy and absorb the rest. The warmed surface emits infrared radiation. Greenhouse gases absorb and emit infrared radiation, affecting how energy moves between the surface, atmosphere and space.

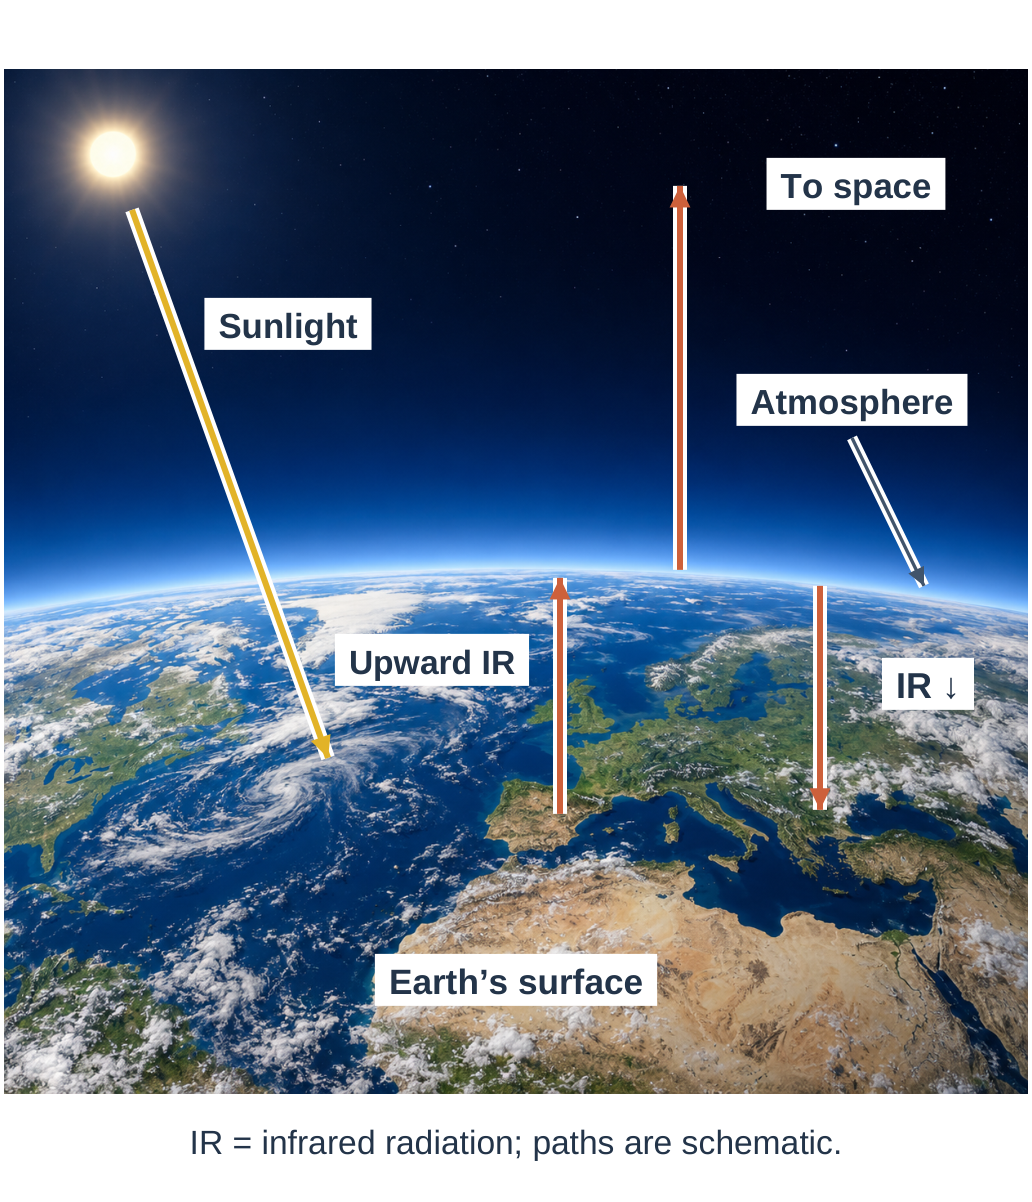
Diagram labels:
- Sunlight.
- Upward IR.
- IR directed downwards.
- To space.
- Atmosphere.
- Earth’s surface.
Diagram note: IR = infrared radiation; paths are schematic.
2.2 Why It Matters
The natural greenhouse effect helps maintain temperatures suitable for life. The problem is not the existence of greenhouse gases, but the additional warming caused by increasing their concentrations and altering the planet’s energy balance.
2.3 Enhanced Greenhouse Effect
More greenhouse gases
Increasing concentrations of long-lived greenhouse gases change the flow of outgoing infrared energy. The climate system warms until a new energy balance is approached. The effect is not simply sunlight being trapped under a visible layer of smoke.
Absorption and emission
Greenhouse gases do not merely reflect infrared like a mirror. They absorb and emit radiation, including downward emission towards the surface and upward emission towards space. A simple diagram shows selected energy paths and should not be read as a scale drawing of atmospheric layers.
| Concept | Meaning |
|---|---|
| Incoming sunlight | Mainly shorter-wavelength energy from the Sun |
| Outgoing infrared | Longer-wavelength radiation emitted by the warmed Earth system |
| Natural effect | Atmospheric processes that keep the surface warmer than without greenhouse gases |
| Enhanced effect | Additional influence from increased greenhouse-gas concentrations |
2.4 Water Vapour Feedback
Water vapour is a greenhouse gas. Its atmospheric amount responds strongly to temperature, so it acts as an important feedback that can amplify warming initiated by other influences. This does not mean human emissions of long-lived gases are unimportant.
Self-check
Is the greenhouse effect the same as ozone-layer depletion?
No. The greenhouse effect concerns infrared energy and temperature. Stratospheric ozone depletion concerns reduced protection from ultraviolet radiation. The processes can interact but are not the same explanation.
Diagram rule
Label sunlight and infrared separately. Describe arrows as radiation pathways, not streams of carbon dioxide. Never draw greenhouse gases as a physical roof surrounding Earth.
3. Causes of Current Climate Change
| Gas / Activity | Awareness-Level Connection |
|---|---|
| Carbon dioxide — CO₂ | Fossil-fuel use, some industrial processes and land-use change add CO₂ |
| Methane — CH₄ | Sources include fuel-system losses, some agriculture and waste decomposition |
| Nitrous oxide — N₂O | Agricultural soils and other processes can release N₂O |
| Fluorinated gases | Certain refrigeration and industrial systems use potent greenhouse gases |
| Land-use change | Can release stored carbon and change vegetation, soil and surface properties |
3.1 Energy and Materials
Burning coal, petroleum products and natural gas transfers carbon from geological stocks into the atmosphere. Some industrial processes also release greenhouse gases through reactions rather than fuel combustion alone. Energy and material choices therefore both matter.
3.2 Land and Ecosystems
Clearing vegetation can release carbon and reduce future carbon uptake. Soil disturbance can also affect stored carbon. Restoring or protecting ecosystems can provide benefits, but does not make continuing fossil emissions irrelevant or guarantee permanent removal.
Do not rank by concentration alone
Different greenhouse gases have different properties and lifetimes. Their climate effect cannot be judged simply by comparing the number of molecules emitted or their current concentration.
3.3 Human Influence and Feedbacks
Human influence
The observed modern warming is primarily driven by human greenhouse-gas emissions. Natural influences affect variability, but they do not provide an adequate alternative explanation for the overall modern warming pattern. A basic answer should distinguish drivers from feedbacks and short-term fluctuations.
Feedback examples
Warming can increase atmospheric water vapour. Loss of reflective snow or ice can increase absorbed sunlight in affected regions. These responses can amplify an initial change. Feedbacks are not independent proof that the initiating emissions no longer matter.
3.4 Not Every Air Pollutant Warms Equally
Air pollution and climate change overlap, but the agents have different effects. Carbon dioxide is central to long-term warming; fine particles and other pollutants have varied atmospheric effects and health concerns. Reducing visible smoke alone does not show that all greenhouse-gas emissions have stopped.
Worked interpretation
A vehicle switches to an electric drivetrain. Tailpipe emissions during driving are removed, but electricity generation, vehicle manufacture and battery production still have impacts. The overall comparison depends on the electricity mix, vehicle characteristics, lifetime and the service provided. Define the boundary before claiming “zero emissions”.
Useful distinctions
- Emission: Release of a gas.
- Concentration: Amount present in the atmosphere.
- Removal: Transfer out of the atmosphere into another reservoir.
- Feedback: A response that changes the initial effect.
Answer structure
Identify the activity, the gas or land change, the energy-balance mechanism and a practical response. Avoid saying only that “pollution makes the Earth hot”.
4. Impacts and Climate Risk
4.1 Impacts Vary
Climate change can affect heat conditions, rainfall patterns, water availability, sea level, ecosystems and human activities. Effects differ by region and by the level of warming. Exposure and the ability to prepare or respond influence the resulting harm.

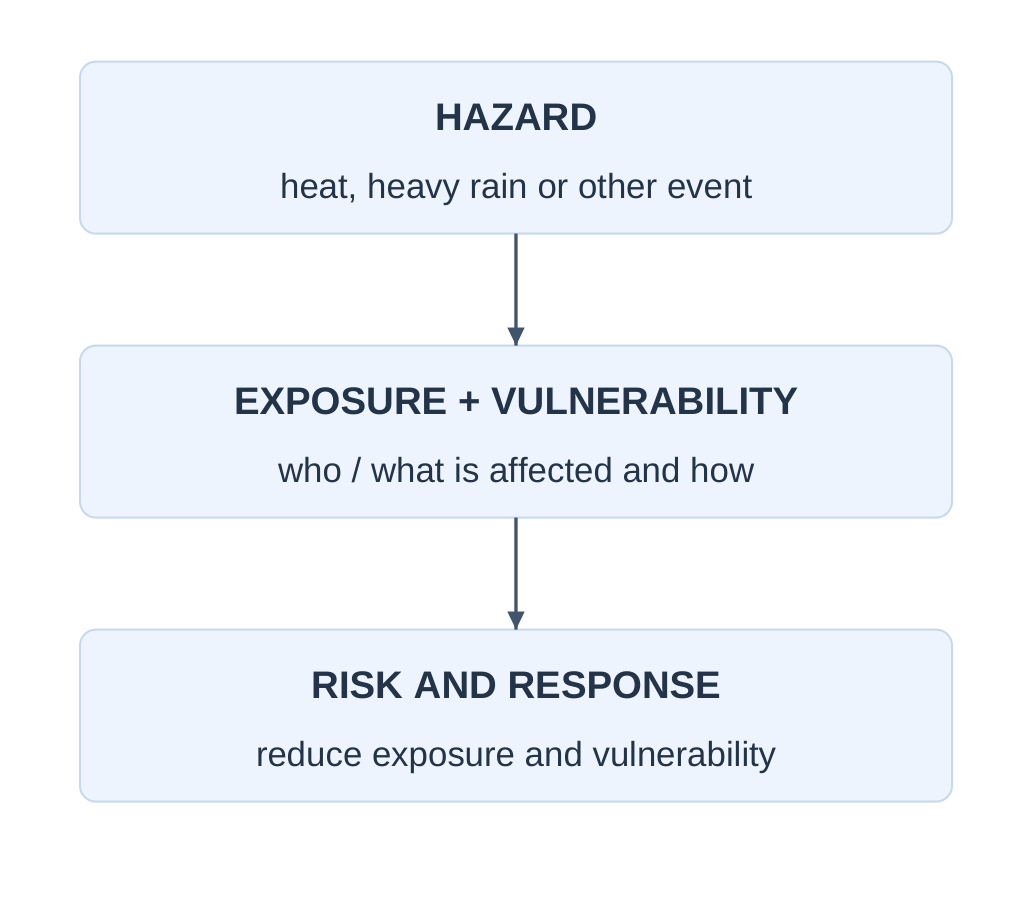
| Diagram Stage | Description |
|---|---|
| Hazard | Heat, heavy rain or other event |
| Exposure + vulnerability | Who or what is affected and how |
| Risk and response | Reduce exposure and vulnerability |
4.2 Heat and Water
More intense heat conditions can stress people, crops and infrastructure. Changes in rainfall and evaporative demand affect water management. Heavy rainfall can overwhelm drainage, while dry conditions can reduce supply. Local assessment should examine both climate and the built environment.
Hazard versus disaster
A heavy-rainfall event is a hazard. Whether it produces severe damage depends on who and what lies in its path, drainage and protection, construction and response capacity.
4.3 Connected Effects
| Area | Possible Concern |
|---|---|
| Coasts | Sea-level rise and coastal flooding or erosion risks |
| Food systems | Heat, water stress, pests and extreme events can affect production |
| Ecosystems | Shifts in habitat suitability, seasonal processes and disturbance |
| Health and services | Heat exposure and disruption of water, transport or power services |
| Livelihoods | Damage and interrupted work can affect vulnerable communities unevenly |
4.4 Unequal Vulnerability
People with limited resources, exposed housing or dependence on climate-sensitive livelihoods may face greater difficulty preparing and recovering. Sustainability therefore includes equity and access to services, rather than treating climate impacts only as a technical temperature problem.
4.5 Cascading Effects
A flooded road can interrupt access to a hospital. A power failure can affect water pumping. A damaged crop can affect income and food access. These examples show why engineering resilience considers connected services and consequences, not only the survival of one structure.
Local interpretation
If a campus experiences waterlogging, investigate rainfall, inlet capacity, blocked drains, paving and downstream conditions. Climate change can alter rainfall risks, but the local blockage may still be a practical cause that can be addressed immediately.
Avoid an absolute claim
Climate change does not imply that every place becomes drier or that every storm increases in the same way. State the relevant hazard and region, and distinguish broad understanding from a specific local prediction.
5. A Local Flood-Risk Example
5.1 Rain, Drainage and Exposure

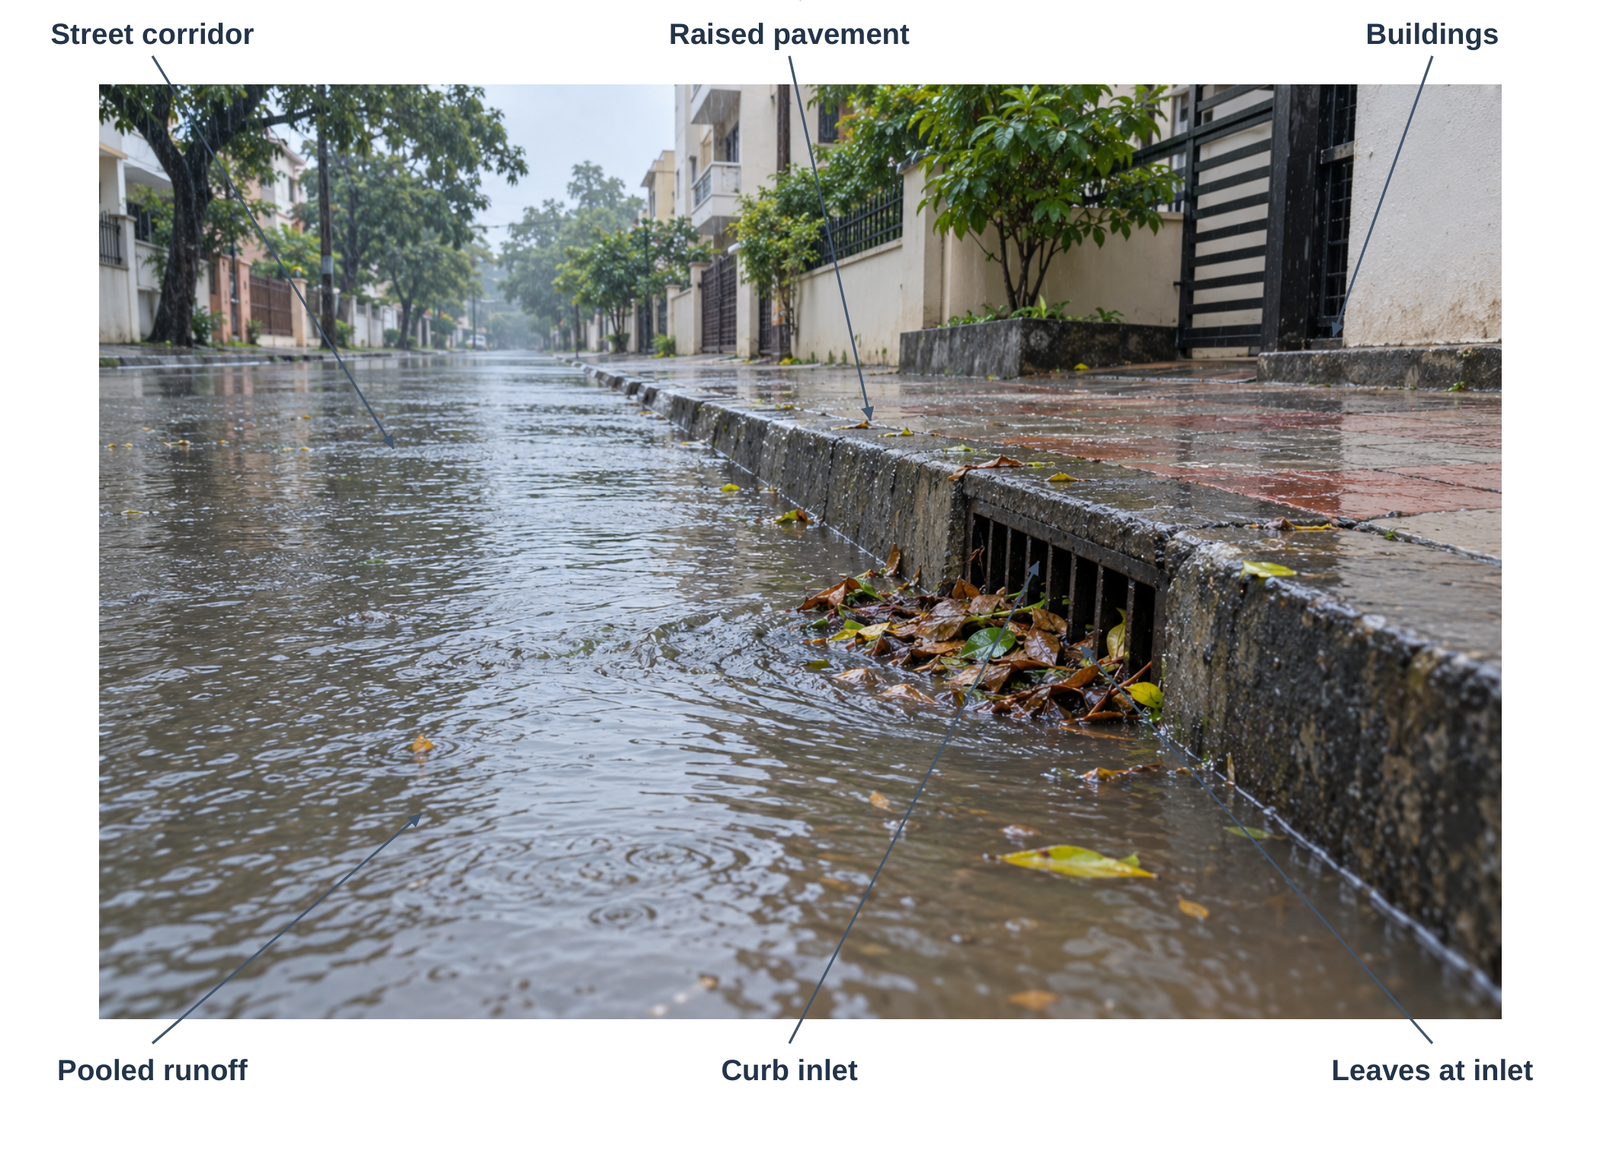
Illustration labels:
- Street corridor.
- Raised pavement.
- Buildings.
- Pooled runoff.
- Curb inlet.
- Leaves at inlet.
Identify several contributors
Heavy rain, paved surfaces, insufficient drainage, blocked inlets and downstream restrictions may combine. The photograph-like scene shows a possible local condition; it does not provide design rainfall, pipe capacity or a measured flood depth.
Reduce avoidable vulnerability
Maintain inlets and drainage through authorised staff, protect suitable permeable areas and plan access to essential services. Longer-term drainage or land-use changes need appropriate assessment rather than simply moving water towards another property.
Relate action to evidence
If leaves obstruct an inlet, arrange maintenance and check performance under comparable conditions. If waterlogging persists, investigate capacity and downstream causes. A single clean-up can address one contributor without proving that all future flood risk has been removed.
Risk communication
Describe what is observed, what might explain it and what information is missing. This supports useful action without dismissing climate risk or attributing every local fault entirely to climate change.
6. Mitigation and Adaptation
| Point | Mitigation | Adaptation |
|---|---|---|
| Main aim | Limit causes of climate change | Reduce harm from actual or expected effects |
| Example | Reduce fossil-energy demand | Improve heat protection and drainage resilience |
| Time relation | Benefits accumulate by limiting future change | Can reduce current and future vulnerability |
| Need | Essential | Essential; does not replace mitigation |
6.1 Mitigation Examples
Avoid unnecessary energy and material demand, improve efficiency, shift to suitable low-emission energy and protect carbon-storing ecosystems. The effect depends on the amount actually avoided and the full system boundary. A label such as “green” is not an emissions measurement.
6.2 Adaptation Examples
Plan for heat, improve water reliability, maintain drainage, protect critical equipment from relevant flood exposure and select infrastructure suited to changing conditions. Adaptation must reflect local hazards and users; one solution is not appropriate for every climate or site.
Both can work together
External shading can reduce cooling-energy demand and improve comfort during hot weather. An action can support mitigation and adaptation, but the two benefits should be explained separately.
6.3 Avoid Maladaptation
Meaning
A poorly chosen response can transfer risk, increase resource demand or disadvantage another group. For example, blocking local runoff without considering downstream flow can create flooding elsewhere. Adaptation requires a whole-system view and attention to equity.
6.4 Practical Campus Comparison
Installing efficient cooling may lower energy needed per unit of service, while improving shaded access routes can reduce heat exposure. Increasing cooling use without addressing building heat gain may raise total demand. Compare useful outcomes, operating needs and who benefits.
Classify the actions
| Action | Main Explanation |
|---|---|
| Replace unnecessary car trips with suitable shared transport | Mitigation through reduced transport emissions, depending on actual use |
| Maintain drainage before heavy-rain periods | Adaptation through reduced local flood vulnerability |
| Protect and appropriately restore vegetation | Potential climate, habitat and local comfort benefits; site dependent |
| Move critical equipment above assessed flood exposure | Adaptation for service continuity |
6.5 Limits Do Not Mean Inaction
No measure eliminates every risk. Explain the problem being addressed and remaining limitations. A staged plan can begin with justified maintenance and demand reduction while larger changes are assessed.
Exam answer
Define mitigation and adaptation, compare their aims, give two examples of each and explain one action that can provide both benefits. Mention local suitability and connected impacts.
Test for transferred risk
Before selecting an adaptation, ask who may face a new burden. A flood wall, additional cooling equipment or a water-supply change can affect neighbouring areas, energy demand or shared resources. Include these effects and compare alternatives instead of evaluating only the protected building or immediate user.
7. Carbon Footprint: Concept
7.1 Meaning and Boundary
A carbon footprint estimates greenhouse-gas emissions associated with an activity, person, product or organisation within a stated boundary and period. It may include several gases, not only carbon dioxide. A result is meaningful only when the included sources and methods are clear.

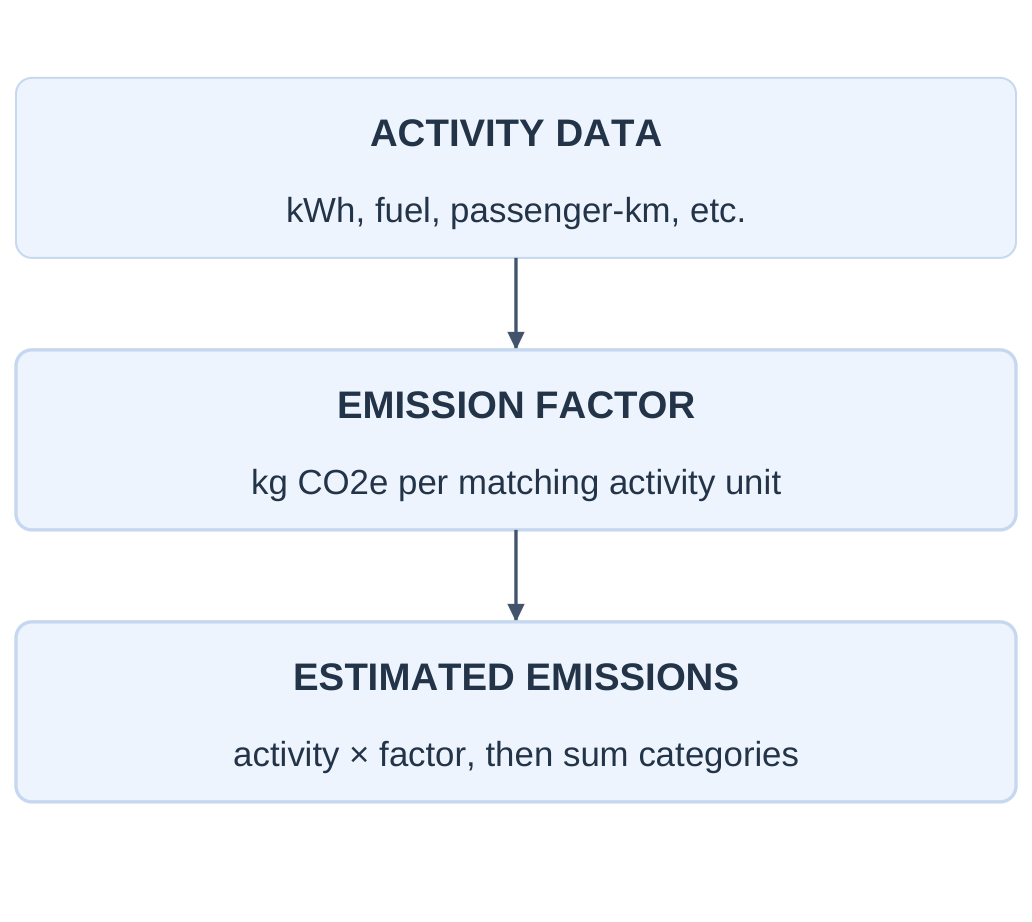
| Diagram Stage | Description |
|---|---|
| Activity data | kWh, fuel, passenger-km, etc. |
| Emission factor | kg CO₂e per matching activity unit |
| Estimated emissions | Activity × factor, then sum categories |
7.2 CO₂-Equivalent
CO₂-equivalent (CO₂e) expresses different greenhouse gases using a common comparison metric. The metric and time horizon affect the conversion. At awareness level, use factors already expressed in matching CO₂e units and state their source and assumptions when doing a real assessment.
Not a universal personal score
Two footprint totals cannot be compared fairly if one includes food and purchases while the other includes only household electricity. Compare the same categories and period.
7.3 Selecting Activity Data
| Category | Possible Data |
|---|---|
| Electricity | Metered kWh for the defined period |
| Transport | Fuel used or passenger-kilometres with a suitable factor |
| Cooking / heating | Fuel quantity with matching units |
| Purchases / food | Suitable quantities and product-specific factors where available |
| Waste | Material quantity and actual management route, if included |
7.4 Direct and Indirect Emissions
Fuel burned directly in a vehicle or building creates direct emissions within that activity boundary. Purchased electricity has generation-related emissions elsewhere. Manufacturing and supply-chain emissions may be included under a broader boundary. Define the boundary instead of assuming that off-site emissions do not count.
7.5 Data Quality
Bills, meter records and fuel receipts can improve estimates. Assumptions may still be needed for shared use or missing records. Report gaps and uncertainty. An apparently precise total is not necessarily accurate when its factors or activity data are uncertain.
Factor selection
A factor in kg CO₂e/kWh multiplies electricity in kWh. A passenger-kilometre factor multiplies passenger-kilometres, not fuel litres. Real factors depend on geography, year, technology and accounting method. The following worked examples use deliberately illustrative factors, not current official values.
Avoid double counting
If a transport category is calculated from fuel, do not also add the same trips calculated from distance unless the methods cover different sources. One activity should not enter the total twice.
8. Electricity Footprint Example
Constructed example: A household uses 120 kWh during a month. Use an illustrative electricity factor of 0.70 kg CO₂e/kWh. This factor is an arithmetic assumption, not a current official grid value.
Step-by-step solution
Step 1: Activity
120 kWh/month.
Step 2: Factor
0.70 kg CO₂e/kWh.
Step 3: Multiply
120 × 0.70 = 84 kg CO₂e/month.
Step 4: Check units
kWh × kg CO₂e/kWh = kg CO₂e.
Step 5: State the boundary
Purchased-electricity emissions under the assumed factor; other household activities are excluded.
8.1 Annualising Carefully
If the same monthly use and factor applied for all 12 months, the estimate would be:
84 × 12 = 1,008 kg CO₂e/year.
This equals 1.008 tonnes CO₂e/year.
Actual monthly use and electricity factors can vary, so multiplying one month by 12 is an assumption, not a measured annual total.
| Quantity | Value |
|---|---|
| Monthly electricity | 120 kWh |
| Illustrative factor | 0.70 kg CO₂e/kWh |
| Estimated monthly emissions | 84 kg CO₂e |
| Other categories included? | No: transport, food and purchases are outside this example |
Conversion
1 tonne = 1,000 kg.
Keep activity, factor and result units visible. Writing “84 carbon” does not identify a valid unit or boundary.
8.2 Estimating a Reduction
Suppose a justified change reduces electricity by 20 kWh during a comparable month. With the same illustrative factor:
Avoided emissions = 20 × 0.70 = 14 kg CO₂e/month.
New estimated electricity emissions:
100 × 0.70 = 70 kg CO₂e/month.
8.3 State What Caused the Change
Weather, occupancy and equipment use may change electricity demand. A before–after difference is not automatically caused entirely by one intervention. Compare equivalent conditions or record the important differences before attributing all of the reduction to the action.
Sensitivity to a factor
For 120 kWh:
- An illustrative factor of 0.50 gives 60 kg CO₂e.
- An illustrative factor of 0.80 gives 96 kg CO₂e.
The difference comes from factor selection, not electricity use. These values demonstrate sensitivity and are not an official emissions range for a particular grid.
8.4 Real Assessment
For actual reporting, use an appropriate documented factor matching the geography, period and accounting boundary. Keep the calculation reproducible. Do not replace a current factor with one remembered from another location or an old exercise.
Practice
Using the same illustrative 0.70 factor:
50 kWh gives 35 kg CO₂e.
A 10 kWh reduction gives 7 kg CO₂e avoided under that assumption.
Explain the boundary with the answer.
Interpretation
The estimate concerns a specified source of emissions. It does not represent every environmental impact, and it does not prove the household has a complete or net-zero footprint.
9. Transport and a Small Inventory
9.1 Passenger-Distance Method
Passenger-kilometres are the distance travelled by passengers. A trip of 10 km by one person is 10 passenger-km; the same trip by two people represents 20 passenger-km. A factor must already correspond to this passenger-distance basis before multiplication.
Constructed transport example
A student travels 10 km each way for 20 study days.
Distance:
10 × 2 × 20 = 400 passenger-km.
Use an illustrative factor of 0.10 kg CO₂e/passenger-km.
Estimate:
400 × 0.10 = 40 kg CO₂e for the period.
9.2 Occupancy and Boundaries
A per-vehicle factor and a per-passenger factor are not interchangeable. If a factor is already passenger-based, do not divide again by occupancy unless the method specifically requires it. Actual transport factors vary with vehicle, fuel, occupancy and the included life-cycle stages.
Fuel alternative
A fuel-based estimate multiplies fuel quantity by a matching factor. Do not add it to a distance-based estimate for the same trips; that would count the same travel twice.
9.3 Shared Household Electricity
If 84 kg CO₂e is allocated equally among four residents for the exercise, each receives 21 kg CO₂e. Equal allocation is a stated assumption, not proof that everyone used the same amount. Other allocation methods may suit other purposes.
9.4 Combining Matching Categories
| Illustrative Category | kg CO₂e / Period |
|---|---|
| Allocated household electricity | 21 |
| Student commuting | 40 |
| Selected cooking-fuel share | 9 |
| Total of included categories | 70 |
The 9 kg cooking entry is an assumed exercise value. All entries cover the same period. The total is 70 kg CO₂e for the included categories; food production, other purchases and additional travel are not included. Label it a partial footprint.
9.5 Compare Like with Like
If the next month has fewer travel days, a lower total may reflect attendance rather than a transport improvement. Report both the total and an appropriate activity measure, such as emissions per study day, when useful. Do not hide increased total emissions behind a favourable ratio.
Worked percentage change
Under comparable boundaries, a footprint falls from 70 to 56 kg CO₂e.
Reduction = 70 − 56 = 14 kg CO₂e.
Percentage = 14 ÷ 70 × 100 = 20%.
State whether this is estimated, what changed and which categories remain excluded.
Inventory checklist
Same period; non-overlapping categories; matching units; suitable factors; clear allocation; stated exclusions; honest uncertainty. A small transparent inventory is preferable to a complete-looking total built from unrelated assumptions.
Allocation is a choice
Suppose four residents share an electricity total but one room also serves a small business. Equal allocation might be convenient but may not represent use fairly. For a real assessment, select a justified method and keep it consistent. Changing the allocation rule between periods can change an apparent personal footprint without changing household emissions.
10. Reducing a Personal Footprint
10.1 Start with a Baseline
List the main activities included in your estimate and identify the largest justified opportunities. A small measured improvement in a major category can matter more than an attractive action with very little effect. Maintain essential services and consider practical access and cost.
| Area | Possible Action |
|---|---|
| Travel | Combine trips and use suitable walking, cycling, shared or public transport options |
| Electricity | Avoid unnecessary operating hours; use efficient suitable equipment |
| Buildings | Improve appropriate shading, ventilation and maintenance |
| Materials | Avoid unnecessary purchases; repair and extend useful product life |
| Food / waste | Reduce avoidable food waste and use suitable management routes |
10.2 Avoid Burden Shifting
An action can reduce one emission source while increasing another. For example, a new device has manufacturing impacts as well as operating performance. Compare the service provided and the relevant life-cycle stages before making an absolute claim.
Behaviour and systems
Personal action is useful, but transport access, building design, electricity systems and institutional choices shape what people can do. A balanced answer includes both individual and collective measures.
10.3 A Simple Awareness Activity
Step 1: Choose a period and boundary, such as commuting and allocated electricity for one month.
Step 2: Record activity data and identify factors and assumptions.
Step 3: Calculate each category and the partial total.
Step 4: Select one feasible reduction action.
Step 5: Repeat under comparable conditions.
Step 6: Report the change and limitations.
10.4 Reductions and Offsets Differ
A reduction prevents or lowers emissions within an activity. An offset claim depends on a separate project and accounting rules. Planting a sapling does not instantly cancel a known quantity of emissions, and future carbon storage is not automatically permanent or additional.
10.5 A Reasoned Example
If a student replaces a set of avoidable solo trips with a suitable shared option, compare the actual passenger-distance and appropriate factors. Do not assume that changing the name of the travel mode guarantees a specific saving regardless of occupancy, route and other conditions.
Good report wording
“Within the stated two-category boundary, estimated emissions decreased under the listed assumptions. The comparison excludes purchases and food, and attendance differed by two days.”
This is more useful than claiming a complete “carbon-neutral lifestyle” from a small activity log.
Memory cue
Define, record, multiply, sum, reduce and verify. State assumptions before interpreting the total.
Prioritise with evidence
If most included emissions come from travel, a transport change may be worth evaluating before a small lighting change. The conclusion depends on the actual data and feasible alternatives. Do not use this example as a universal ranking: another person’s heating, electricity or purchasing pattern may produce a different priority.
11. Sustainable Development
11.1 Basic Idea
Sustainable development seeks to meet present needs while preserving the ability of future generations to meet their needs. It links environmental protection, social well-being and economic viability. Development should improve life without undermining the ecological and social foundations that support it.

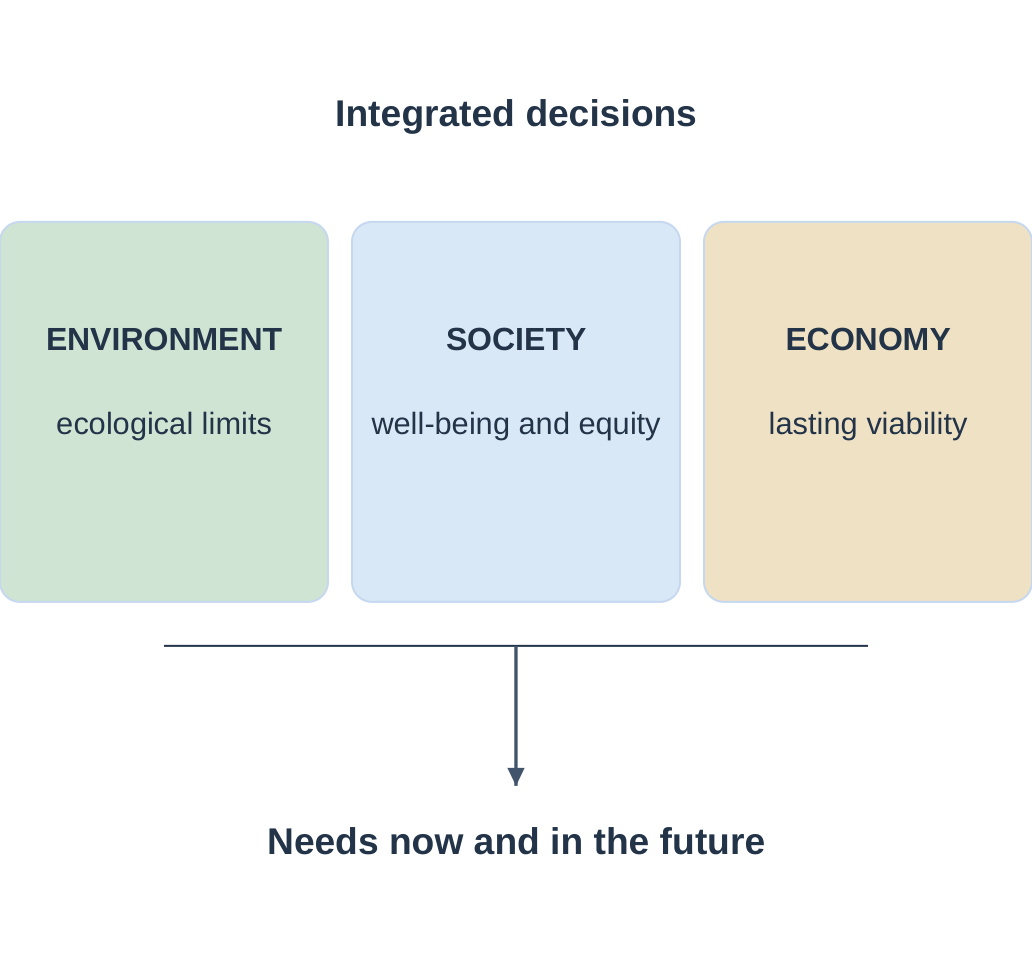
| Diagram Component | Description |
|---|---|
| Environment | Ecological limits |
| Society | Well-being and equity |
| Economy | Lasting viability |
Diagram message: Integrated decisions consider needs now and in the future.
11.2 Needs and Limits
Essential needs include safe water, food, shelter, health, education and meaningful opportunities. Ecological limits concern resource renewal, pollution loads, habitat and other system capacities. A plan should consider both rather than treating environmental protection as a separate activity added after development.
Future generations
A project can appear inexpensive today while passing resource depletion, pollution or maintenance burdens to future users. Sustainable planning makes those longer-term consequences visible.
11.3 Why Sustainability Is Needed
Resource and pollution pressures
Wasteful resource use and poorly managed releases can damage the systems supporting people and economies. Avoiding unnecessary demand, improving efficiency and protecting ecosystems can reduce these pressures while maintaining useful services.
Equity and participation
People experience benefits and harms differently. A cleaner facility that remains inaccessible or transfers pollution to a poorer neighbourhood is not a complete sustainability success. Include affected users and consider who pays, who benefits and who bears risk.
Economic durability
A solution must be operable and maintainable with available skills and resources. A low purchase price can be misleading if repairs, energy use or premature replacement create high lifetime costs. Economic viability should be considered together with environmental and social performance.
| Question | What It Checks |
|---|---|
| Does it reduce relevant environmental damage? | Resource use, releases and ecosystem effects |
| Does it serve people fairly? | Access, health, participation and distribution |
| Can it function over time? | Maintenance, operating cost and useful life |
| What happens later? | Replacement, recovery and future burdens |
Example
A water-saving fixture should provide suitable service, be accessible to users, reduce actual avoidable demand and have maintainable parts. A device that users bypass because it fails to work may save little, despite a favourable brochure.
12. Making Sustainable Choices

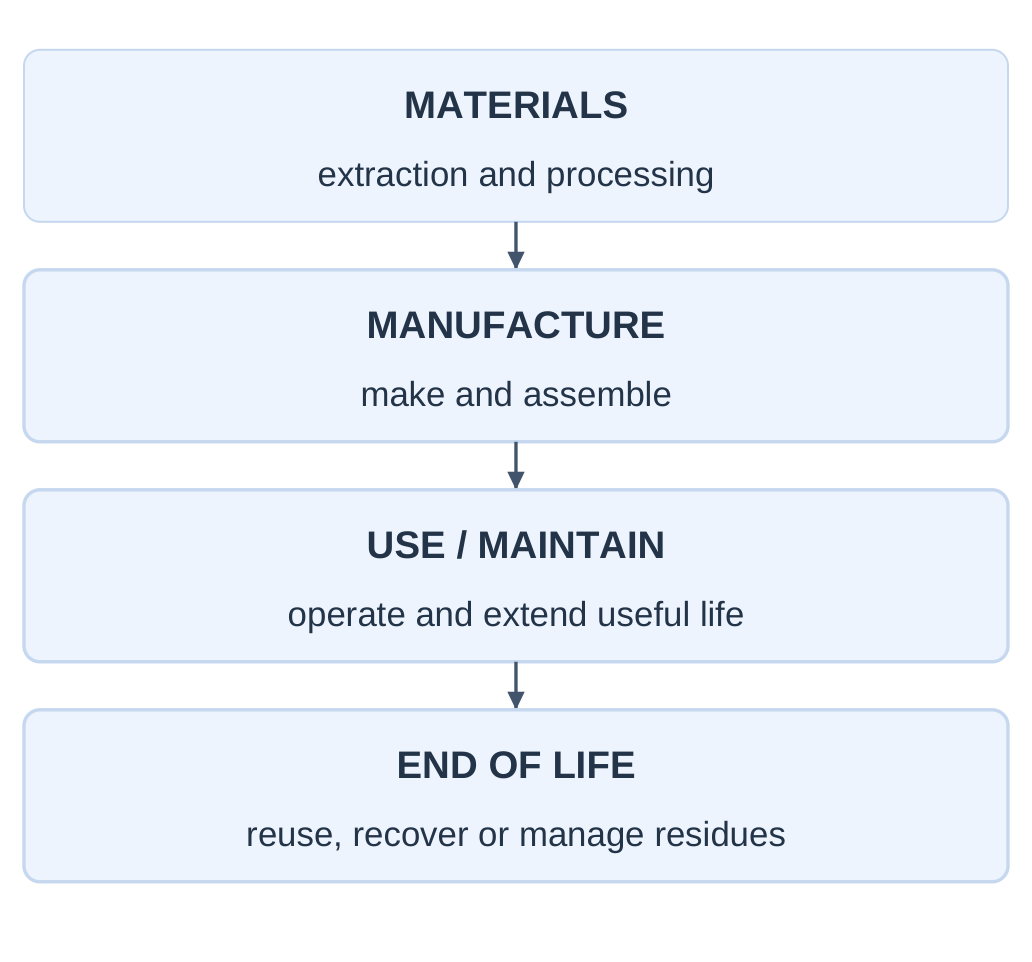
| Stage | Diagram Description |
|---|---|
| Materials | Extraction and processing |
| Manufacture | Make and assemble |
| Use / maintain | Operate and extend useful life |
| End of life | Reuse, recover or manage residues |
12.1 Compare the Same Service
Compare options that provide a similar useful function over a suitable period. One durable item used many times should not be compared with one single-use item as though both provided the same number of service cycles. Include cleaning, repair and operating needs where relevant.
12.2 Avoid a Single-Indicator Verdict
Carbon footprint is one useful measure, but water demand, land, toxicity, accessibility and cost can also matter. An option with lower emissions can still have another serious impact. State the indicators and trade-offs instead of declaring a universal winner from one number.
Sustainable design
A design decision is stronger when it prevents a problem at the start than when it merely adds a waste-treatment step later. Keep the whole life cycle and intended service in view.
12.3 Worked Decision Cases
Case 1: replacing a serviceable product
A new product is advertised as efficient. Compare its expected operating savings, manufacturing impacts, durability, repairability and the condition of the existing item. Immediate replacement is not automatically best, nor is keeping every old item indefinitely.
Case 2: water-efficient landscaping
A landscape plan should consider local climate, available water, habitat and maintenance. Appropriate existing vegetation may be worth protecting. A high-water ornamental design can increase demand even if it looks green in a photograph.
Case 3: a reusable container
Consider whether the container is suitable, how often it is used, how it is cleaned and whether it replaces disposable purchases. Owning several unused “sustainable” containers does not itself demonstrate a resource saving.
A compact decision framework
| Step | Question |
|---|---|
| Need | What useful service is required? |
| Options | Can demand be avoided or reduced first? |
| Impacts | What changes across the life cycle? |
| People | Who gains, pays or faces risk? |
| Operation | Who maintains it and for how long? |
| Verification | How will actual performance be checked? |
Evidence over appearance
A green colour, leaf symbol or attractive rendering is not proof of sustainability. Explain the mechanism and use suitable indicators to evaluate the actual outcome.
13. The SDGs: Overview
13.1 Meaning
The United Nations Sustainable Development Goals are 17 connected goals within the 2030 Agenda, adopted in 2015. They cover human well-being, prosperity, environmental protection and cooperation. The overview below uses the official short titles with plain-language explanations and local examples.
Goals 1–3: basic well-being
| Goal | Main Idea | Local Connection |
|---|---|---|
| 1. No Poverty | Reduce deprivation and strengthen access to essential opportunities | Inclusive services and affordable access |
| 2. Zero Hunger | Improve food security, nutrition and sustainable food systems | Reduce avoidable food waste; support sound food management |
| 3. Good Health and Well-being | Promote health and well-being across life stages | Cleaner surroundings and reliable water and sanitation |
Connections between goals
Food, water, energy, health and income interact. For example, unreliable water can affect sanitation and study time. An engineering project can support several goals, but naming several goal numbers does not prove that all their outcomes have been achieved.
Goals are not a checklist of slogans
Targets and indicators make the agenda more specific. This unit requires an overview, so understand the direction and connections rather than memorising every target number.
13.2 Goals 4–6
| Goal | Main Idea | Local Connection |
|---|---|---|
| 4. Quality Education | Support inclusive learning and useful skills | Accessible learning spaces and environmental awareness |
| 5. Gender Equality | Address unequal opportunities, participation and treatment | Inclusive campus facilities and decision-making |
| 6. Clean Water and Sanitation | Manage water and sanitation reliably and sustainably | Leak repair, source protection and suitable wastewater management |
Access matters
A technically efficient system does not meet a social need if some users cannot access it. Location, affordability, reliability, usability and participation affect real outcomes. Sustainability joins engineering performance to human use.
13.3 Campus Example
A drinking-water point can connect water service, health and educational access. Evaluate quality, maintenance, reliability and accessibility. A low-volume fixture is not a success if it provides insufficient service or causes users to seek an unsafe alternative.
Short-answer practice
Why are the SDGs interconnected?
Because progress or harm in one area affects others. Water, health, education, livelihoods and ecosystems share resources and infrastructure. Good planning identifies these links and avoids advancing one goal by creating an avoidable burden elsewhere.
Recall 1–6
Poverty, hunger, health, education, gender equality, water and sanitation. Use the official goal titles in an exam list and add a short explanation when asked.
14. SDGs 7–12
| Goal | Main Idea | Engineering Connection |
|---|---|---|
| 7. Affordable and Clean Energy | Reliable modern energy with cleaner supply and efficient use | Suitable renewable energy and demand reduction |
| 8. Decent Work and Economic Growth | Productive opportunities and decent working conditions | Maintainable projects and responsible work practices |
| 9. Industry, Innovation and Infrastructure | Resilient infrastructure and appropriate innovation | Durable systems, useful technology and reliable services |
14.1 Energy Access and Efficiency
Energy conservation and access are compatible when unnecessary loss is reduced while essential service improves. A well-designed lighting system can provide suitable illumination with lower electricity use. Cutting service indiscriminately is not the same as improving efficiency.
14.2 Innovation Needs a Purpose
A new sensor, app or machine should address a defined need. Complexity can create maintenance and material burdens. Sometimes a simple process change or reliable repair is more useful than a new device with unclear ownership.
Infrastructure over time
Consider operation, maintenance, resilience and end-of-life needs. A structure that works only on its opening day does not demonstrate lasting development.
14.3 Equity, Cities and Materials
| Goal | Main Idea | Local Connection |
|---|---|---|
| 10. Reduced Inequalities | Reduce unfair gaps in opportunity and inclusion | Accessible services and participation |
| 11. Sustainable Cities and Communities | Make settlements more inclusive, safe and resilient | Suitable transport, drainage, public space and reliable services |
| 12. Responsible Consumption and Production | Use resources wisely and prevent avoidable waste | 3 R’s, repair, procurement and suitable recovery |
14.4 A Linked Transport Example
A suitable public-transport improvement may support access, reduce unnecessary vehicle travel and improve the use of infrastructure. Evaluate routes, affordability, accessibility and actual occupancy. Benefits should be assessed rather than assumed simply from the project’s name.
14.5 Responsible Consumption
Procurement can influence product durability, packaging, repair and recovery. Buy what is needed and plan useful service, not just initial quantity. A lower price per disposable item can create a higher long-term material and waste burden.
Check your reasoning
A campus adds many new devices to a “smart” system but cannot maintain them. Which concern is missing?
Long-term operability and useful service. Technology supports sustainability when it functions reliably and its benefits justify its resource demands.
Recall 7–12
Energy; work and growth; industry and infrastructure; reduced inequalities; sustainable settlements; responsible consumption and production.
Innovation can be simple
A dependable repair process, an accessible refill point or a well-managed collection schedule can be a practical innovation when it resolves a real failure. Novel electronics are not a requirement for sustainability. Compare the useful service, participation, upkeep and verified outcome rather than the visual complexity of the solution.
15. SDGs 13–17
| Goal | Main Idea | Local Connection |
|---|---|---|
| 13. Climate Action | Address climate causes and strengthen responses to risks | Mitigation, adaptation and awareness |
| 14. Life Below Water | Protect marine and coastal ecosystems and resources | Reduce waste and pollution reaching waterways and oceans |
| 15. Life on Land | Protect terrestrial ecosystems, biodiversity and land functions | Habitat protection and suitable land conservation |
15.1 Land and Water Are Connected
Waste released inland can move through drains and rivers. Land degradation can affect sediment entering water bodies. Protecting an upstream area may therefore contribute to downstream ecological outcomes, depending on actual transport pathways.
15.2 Climate and Ecosystems
Protecting ecosystems can support habitat, carbon storage and some resilience benefits. These functions need appropriate species, locations and long-term care. Planting unsuitable trees everywhere is not a universal substitute for protecting existing ecosystems and reducing emissions.
Avoid overclaiming
A litter-prevention activity can contribute to a goal; it does not mean the entire goal has been achieved. State the scale, indicator and limitations of the contribution.
15.3 Institutions and Partnerships
| Goal | Main Idea | Local Connection |
|---|---|---|
| 16. Peace, Justice and Strong Institutions | Support accountable institutions, justice and inclusive decisions | Transparent records, fair procedures and responsible participation |
| 17. Partnerships for the Goals | Cooperate through knowledge, resources and implementation | Students, staff, communities and suitable service providers working together |
15.4 A Campus Project Across Goals
A water-conservation project may connect Goal 6 to energy use under Goal 7, maintenance and infrastructure under Goal 9, responsible resource use under Goal 12 and cooperation under Goal 17. Select the links actually supported by the project rather than adding every goal icon.
A simple project map
Problem: Repeated tank overflow.
Action: Repair the cause and organise monitoring.
Indicator: Fault recurrence and water use under comparable conditions.
Partners: Facility staff and users.
Possible links: Water, energy and responsible resource use. Verify the result before reporting a saving.
All 17 covered
The preceding SDG sections introduce all official goal titles. For revision, group them into people, services and livelihoods, environment, institutions and cooperation while remembering that their links cross these groups.
A water–land example
Protecting a stream corridor can support land habitat and water quality at the same time. A plan should consider the upstream catchment and downstream users, not just the visible planting strip. The SDG connection becomes credible through the actual mechanism and indicator, rather than through the number of goals named.
16. Solar Energy: Awareness
16.1 Two Familiar Forms
Solar photovoltaic (PV) systems convert sunlight into electricity. Solar thermal systems use solar energy as heat, for example for suitable water heating. A rooftop panel is not automatically the same device in both cases; identify the service and technology.

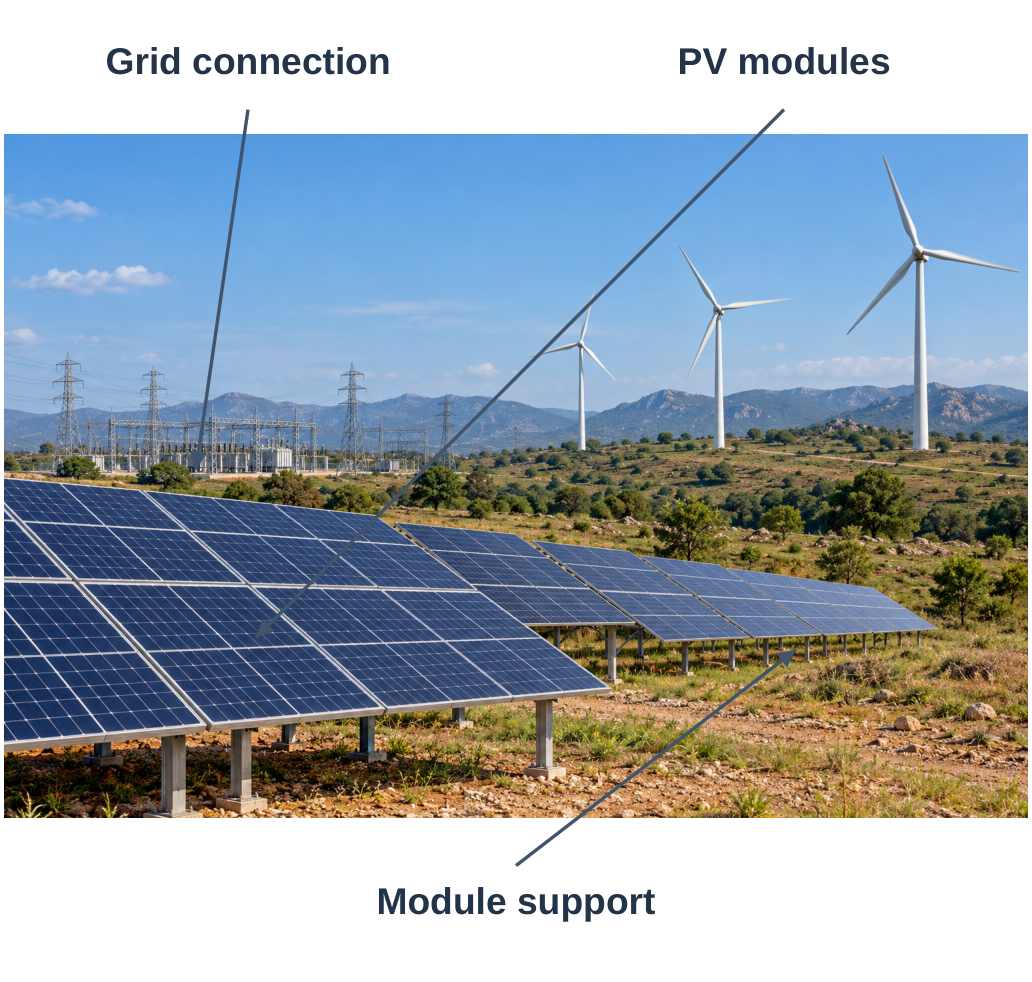
Illustration labels:
- PV modules.
- Grid connection.
- Module support.
16.2 Benefits
Solar energy can reduce dependence on fossil generation where it supplies suitable demand. Rooftops may offer space close to users. Benefits depend on actual energy generation, the displaced supply and the equipment’s life cycle.
No universal output
A panel’s rated power does not mean that output is produced continuously. Sunlight, temperature, shading, orientation and system condition affect generation.
16.3 Limitations and Good Use
Variability
PV output changes through the day, with weather and with seasons. Storage, grid connection and demand management can help match supply and use. A battery stores electricity generated earlier; it does not make an independent primary energy source.
Site and maintenance
Check shading, roof suitability, access, structural requirements and maintenance through competent design. Dust and equipment faults can affect performance. A small awareness drawing is not a safe substitute for a designed electrical installation.
16.4 Life-Cycle Considerations
Manufacturing, materials, transport and end-of-life management still matter. Low operational emissions do not mean zero environmental impact. Appropriate procurement, long useful life and a planned recovery route improve responsible deployment.
| Question | Why It Matters |
|---|---|
| What service is needed? | Electricity and heat require different technologies |
| Is the site suitable? | Shading, space and roof conditions affect performance |
| When is energy needed? | Demand timing may differ from sunlight availability |
| Who maintains it? | Reliable operation and safe access need responsibility |
| What happens at end of life? | Materials and components need an appropriate route |
Model short answer
Solar energy is renewable because it draws on an ongoing natural energy flow. A PV system converts sunlight to electricity, but its output is variable and its equipment requires materials, suitable siting and maintenance.
17. Wind Energy: Awareness
17.1 Basic Working
A wind turbine captures part of the kinetic energy of moving air through a rotor. The rotor drives a generator through the turbine’s mechanical and electrical arrangement. Electricity is then controlled and delivered to a suitable system. Detailed turbine equations are beyond this unit’s awareness scope.

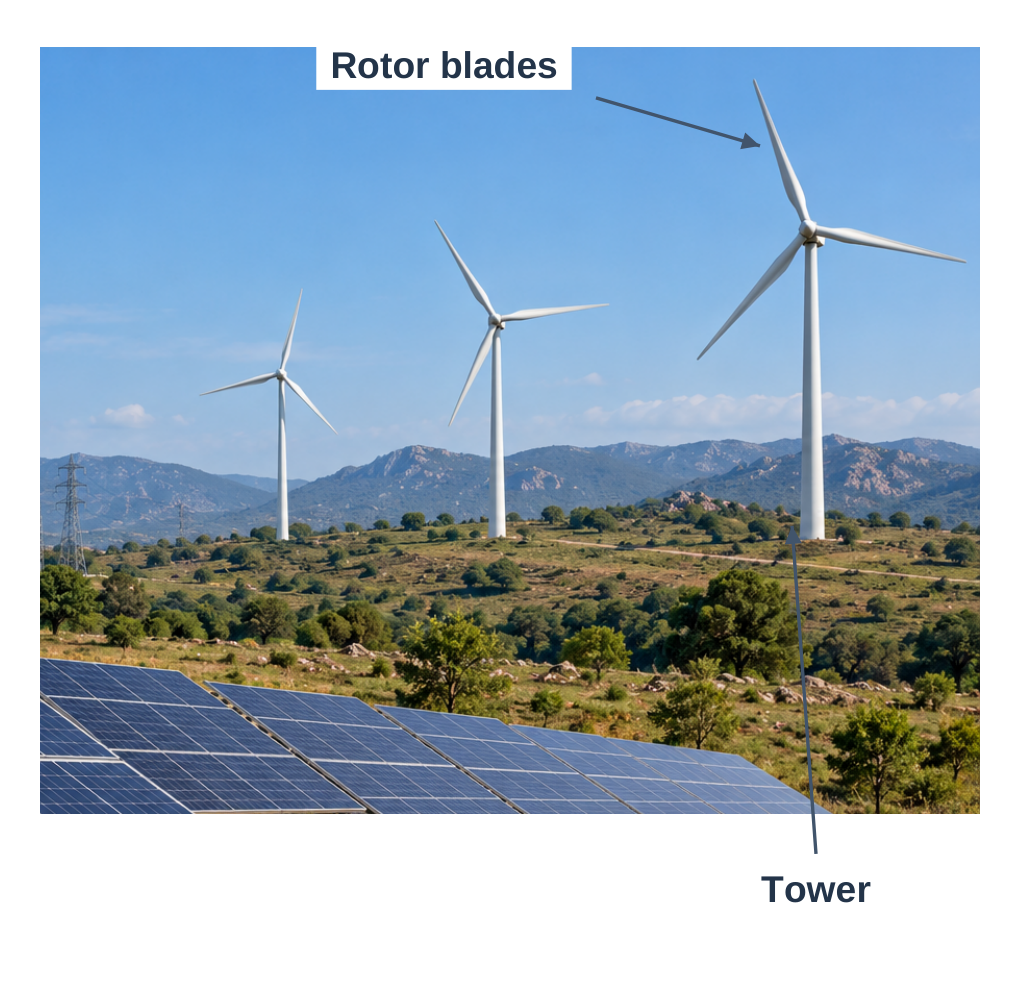
Illustration labels:
- Rotor blades.
- Tower.
17.2 Site Dependence
A useful location needs suitable wind conditions and appropriate physical, grid and access arrangements. Wind speed and direction vary, so a turbine cannot be assumed to produce its rated output continuously. Site assessment uses more than a single windy-day observation.
Renewable, with planning needs
The wind flow is renewable; the equipment, land use, access and ecological effects still require assessment. Renewable classification is not permission to ignore the site.
17.3 Benefits and Limitations
| Aspect | Awareness Point |
|---|---|
| Operation | No fuel combustion at the turbine during electricity generation |
| Variability | Output depends on wind conditions and system operation |
| Grid and demand | Generation must be integrated with the electricity system |
| Local setting | Consider habitats, birds and bats, access, sound and neighbouring uses |
| Life cycle | Materials, manufacture, maintenance and recovery still matter |
17.4 Compare Solar and Wind
Both draw on replenished energy flows and have variable output. Solar depends on sunlight; wind depends on air movement. Their patterns can differ, and suitable combinations depend on location and system needs. Neither makes efficiency or demand management unnecessary.
Constructed energy example
If a selected system actually supplies an average of 2 kW for 5 hours:
Energy delivered = 2 × 5 = 10 kWh.
The average must be justified; substituting the nameplate rating for actual output without explanation can overestimate generation.
17.5 Practical Interpretation
A turbine visible from campus is evidence that equipment is installed, not evidence of its annual output or avoided emissions. Obtain appropriate generation data and use a matching accounting method for those claims.
Exam answer
Explain wind → rotor → generator → electricity. Add suitable location, variable output and one environmental planning consideration.
18. Biomass and Biogas
18.1 Biomass
Biomass is biological material that can supply energy through suitable conversion. Residues, some organic wastes and purpose-grown material are examples. Energy routes include combustion and other thermal or biological processes, depending on the feedstock and technology.

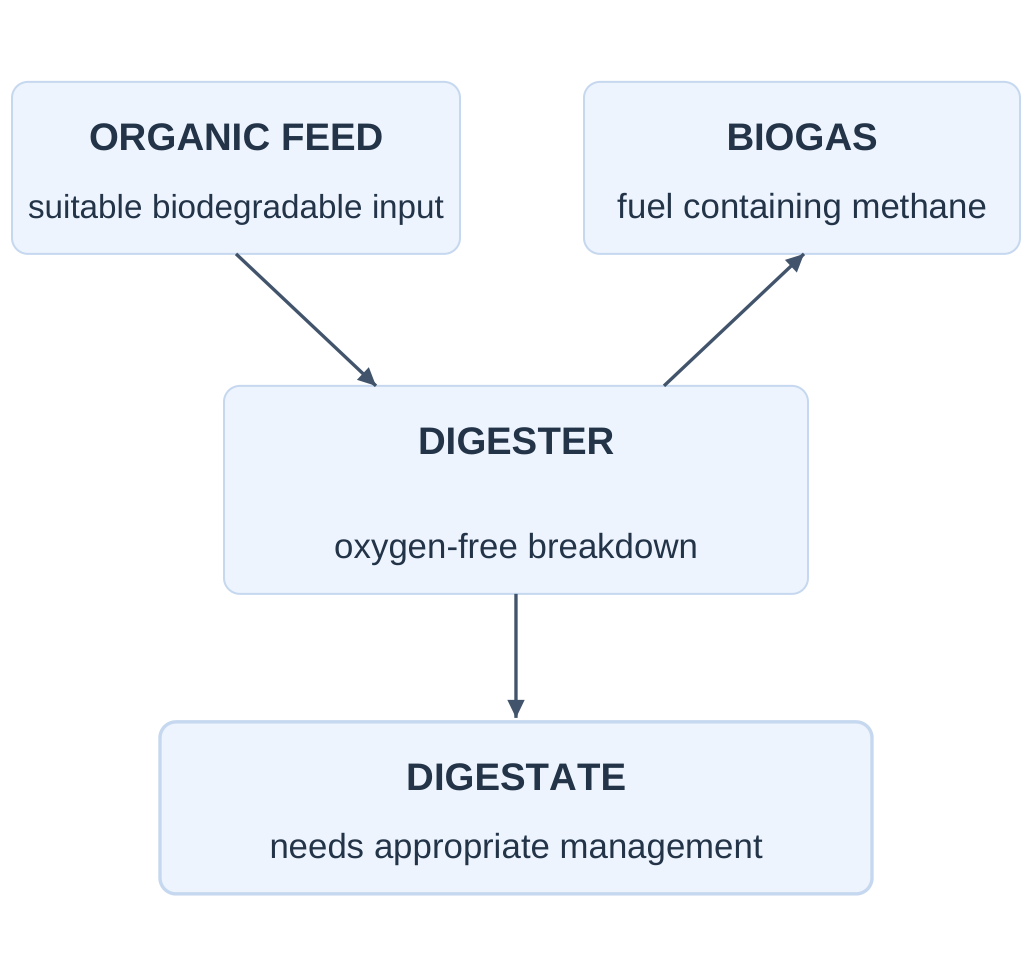
| Diagram Component | Description |
|---|---|
| Organic feed | Suitable biodegradable input |
| Digester | Oxygen-free breakdown |
| Biogas | Fuel containing methane |
| Digestate | Needs appropriate management |
18.2 Biogas
Biogas is a fuel mixture produced by microbial breakdown without oxygen. It can support appropriate heat or electricity uses after suitable handling. Digestate is a separate output that needs assessment and management; it is not automatically suitable for every land application.
Not the same as compost
Composting is aerobic treatment; biogas production uses anaerobic digestion. Both require suitable feed and operation, but their main process conditions and outputs differ.
18.3 Sustainability Is Conditional
Regeneration and competing uses
Biomass can be renewable when supply is replenished appropriately. Unsustainable harvest can damage forests, soil and habitat. Residues may already serve soil protection, animal feed or another use; calling them waste does not make their removal impact-free.
Emissions and operation
Combustion can release air pollutants and carbon dioxide. Digesters can lose methane if poorly managed. The climate balance depends on feedstock, land-use effects, processing, transport, operation and the alternative fate of the material. Biomass is not automatically carbon-neutral.
| Source | Useful Point | Main Caution |
|---|---|---|
| Solar | Light can provide electricity or useful heat | Variable supply and suitable system needs |
| Wind | Moving air can generate electricity | Site and system integration matter |
| Biomass | Can use suitable biological inputs | Feedstock, emissions, land and management determine sustainability |
18.4 Campus Example
A canteen’s suitable organic material might support a managed biological route, but the quantity, consistency, segregation, operator skills and use of outputs must be assessed. Installing a digester with no reliable feed or maintenance plan is not a complete sustainability solution.
Explain the full chain
Input → conversion → useful service → emissions and residues → maintenance.
This pattern helps compare renewable-energy options without hiding their practical requirements.
19. Quick Revision
| Concept | Recall |
|---|---|
| Weather / climate | Short-term conditions / long-term patterns |
| Global warming | Long-term increase in global mean surface temperature |
| Greenhouse effect | Absorption and emission of infrared by atmospheric gases |
| Mitigation / adaptation | Limit causes / reduce harm and vulnerability |
| Carbon footprint | Estimated emissions within a defined boundary and period |
| CO₂e | A common comparison unit using a specified metric |
| Sustainable development | Meet present needs while maintaining future capacity |
| SDGs | 17 connected goals within the 2030 Agenda |
| Renewable energy | Replenished flows or resources with site and life-cycle requirements |
Formula recap
Emissions:
Activity × Matching factor.
Partial total:
Sum non-overlapping categories for the same period.
Percentage reduction:
(Initial − Final) ÷ Initial × 100.
Energy:
Average power × Time.
Conversions:
1 tonne = 1,000 kg.
1 kW = 1,000 W.
What the examples assume
Electricity factor 0.70 kg CO₂e/kWh and transport factor 0.10 kg CO₂e/passenger-km are illustrative exercise inputs. They are not asserted as current official factors.
19.1 Possible Exam Questions
Short-answer questions
- Distinguish weather and climate.
- Explain global warming and climate change.
- Describe the natural greenhouse effect.
- Name major human greenhouse-gas sources.
- Distinguish mitigation and adaptation.
- Define carbon footprint and CO₂e.
- Explain why boundaries and factors matter.
- Define sustainable development.
- List all 17 SDGs with their broad aims.
- State one benefit and limitation of solar, wind and biomass.
Long-answer and diagram tasks
- Explain the greenhouse effect with a correctly labelled radiation diagram.
- Discuss climate causes, impacts and practical responses.
- Prepare a partial personal footprint with stated assumptions and a reduction plan.
- Explain sustainable development using a campus example.
- Describe SDG connections across water, energy, cities and responsible consumption.
- Compare solar, wind and biomass at awareness level.
Numerical practice
At illustrative 0.70 kg CO₂e/kWh:
80 kWh gives 56 kg CO₂e.
At illustrative 0.10 kg CO₂e/passenger-km:
250 passenger-km gives 25 kg CO₂e.
A reduction from 100 to 85 kg CO₂e is 15%.
State boundaries and period.
Unit IV complete
You should now be able to explain climate mechanisms, interpret basic risk, estimate a transparent partial footprint and connect renewable energy and the SDGs to practical sustainability decisions.
Study Resources
Use these Environment and Sustainability Unit 4 Notes for complete unit study, labelled diagrams, carbon-footprint calculations, SDG revision and examination preparation.
Additional unit-wise resources are available at www.notesgallery.com.
The university website is https://aktu.ac.in.