University: Dr. A.P.J. Abdul Kalam Technical University (AKTU) Programme: B.Tech First Year, Semester I & II Course Codes: AAS102D / AAS202D Stream: CSE Unit: V
Introduction
Green Chemistry and E-waste Management connects chemical design, electronic materials, equipment life and recovery. Follow useful function and materials from manufacturing decisions to end-of-use outcomes.
Syllabus Coverage
Green chemistry principles; environmentally friendly electronic materials; biodegradable electronics; e-waste generation and hazards; recycling; valuable-metal recovery; RoHS and WEEE; sustainable manufacturing and circular economy.
Topic Map
| Topic | PDF Pages |
|---|---|
| Green chemistry and all 12 principles | 2–8 |
| Atom economy, yield and mass metrics | 8–11 |
| Friendlier and biodegradable materials | 11–16 |
| E-waste generation and hazards | 16–19 |
| Collection, reuse and dismantling | 19–24 |
| Physical separation and metal recovery | 24–28 |
| Recovery, purity and balances | 28–30 |
| RoHS and WEEE | 30–33 |
| Manufacturing and circular economy | 33–38 |
| Life-cycle thinking and case study | 38–43 |
| Formula guide and complete revision | 43–46 |
How to Study This Unit
- Explain principles through decisions.
- Preserve the required device function.
- Keep hazard and exposure distinct.
- Distinguish yield from atom economy.
- State material-accounting boundaries.
- Separate disappearance from biodegradation.
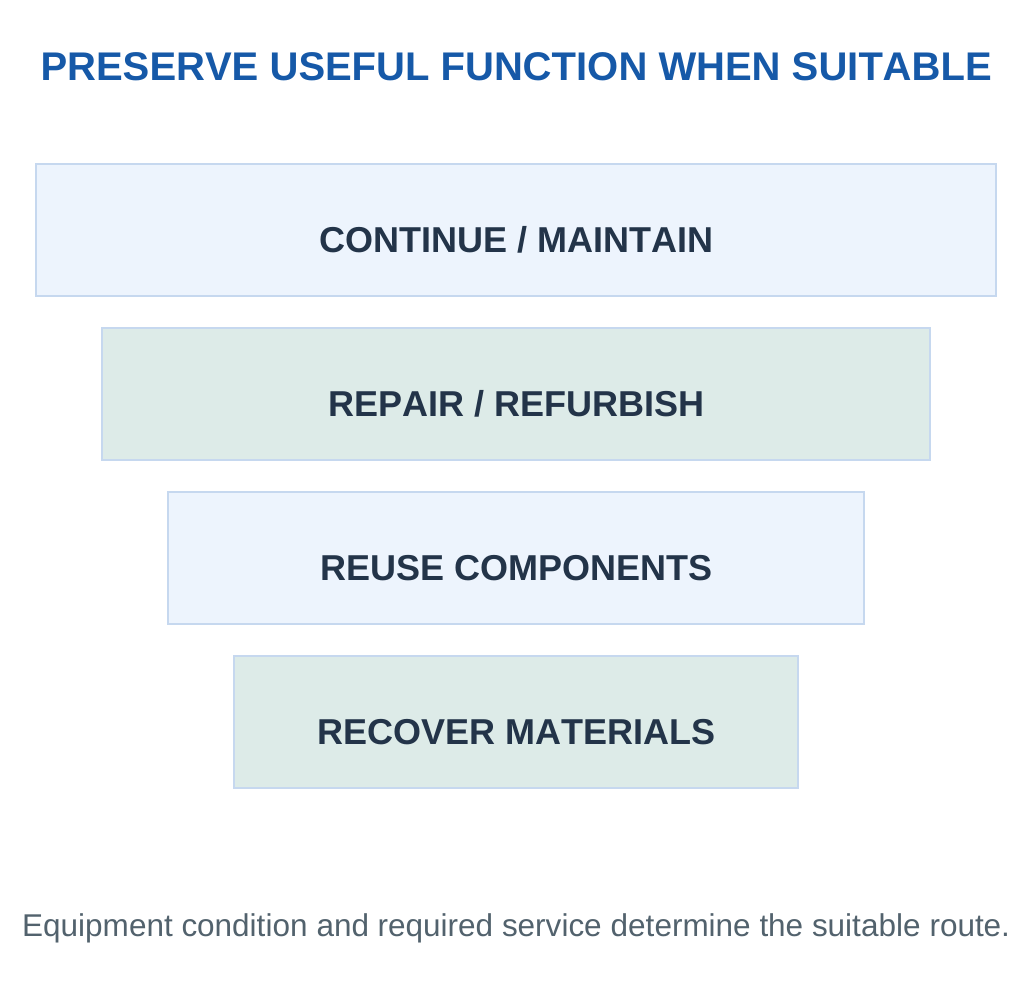
- Preserve suitable reuse opportunities.
- Track target metal through each stage.
- Separate recovery from product purity.
- Keep RoHS and WEEE roles distinct.
- Compare the same service and time period.
Calculation Convention: Numerical grades, recoveries, energy factors and device inventories are supplied teaching datasets. Use the stated boundary; do not treat them as universal product values or statutory targets.
Main Principle: Prevent avoidable burdens, preserve suitable function, recover materials responsibly and verify outcomes with correct units and denominators.
1. Green Chemistry and Electronic Systems
Green chemistry designs chemical products and processes to reduce hazardous substances and avoid waste at its origin. It connects useful function with efficient material use, lower hazard and reduced environmental burden. It is broader than treating pollution after it has been generated.


Prevention, Control and Remediation
Prevention changes the product or process so an avoidable waste stream is not created. Control captures or treats a release during operation. Remediation addresses contamination that already exists. These approaches can complement one another, but they are not interchangeable.
Electronics contain conductors, semiconductors, polymers, glass, coatings, adhesives and energy-storage materials. Replacing one constituent can change processing temperature, reliability, repair and recycling. A useful environmental comparison therefore retains the required function and states its boundary.
Answer Pattern: Principle → causal mechanism → electronics example → evidence and trade-off.
Avoid describing a product as green solely because it has a natural ingredient or a green label. A selective coating process can reduce overspray. A repairable module can avoid a complete replacement. A safer cleaning formulation can reduce a particular hazard. Each improvement should be assessed together with quality, energy, waste and service life.
Chemistry and Product Engineering Work Together
A lower-waste synthesis can improve material manufacture, while modular design can preserve function after assembly. These address different stages. Neither should be dismissed because it does not solve the whole life cycle by itself.
A sensible claim states the comparison: less solvent per accepted device, lower mass of a specified hazardous input, longer supported service or higher useful recovery. “Environmentally friendly” without an indicator and boundary is too vague to evaluate.
From Principle to Decision
If a process creates waste, ask first whether selectivity or process design can avoid it. If not, ask whether useful material can be recovered appropriately. Manage unavoidable residues with suitable controls. Prevention is a priority, not an excuse to omit treatment.
Define the Required Function Before Changing Chemistry
An electronic material has a purpose: carrying current, insulating a circuit, bonding layers, protecting a surface or storing energy. A proposed lower-impact alternative must retain that purpose under the intended conditions. Otherwise additional failures, repairs or replacements can offset a manufacturing improvement.
A useful comparison states what changed and what remained equivalent. For example, two cleaning routes can be compared for the same accepted cleanliness level and number of assemblies. Comparing one route at adequate quality with another that leaves unacceptable residue is not a like-for-like result.
Key Point: Name the Improvement
A claim such as lower solvent input per accepted device is more assessable than an unqualified green label. State the useful function, comparison boundary and indicator before judging an alternative.
Pollution Prevention and Resource Conservation
Reducing hazardous input can address a chemical concern even when total material mass changes little. Reducing material waste can conserve resources even when the substitute chemistry is unchanged. Energy and water improvements address additional burdens. These are related objectives, but one favourable indicator should not be presented as every improvement simultaneously.


Electronics-Specific Reasoning
An assembly includes high-purity materials and several processing stages. Preventing a defect late in manufacturing can preserve all the effort already invested upstream. This makes yield and reliability relevant to green chemistry without turning them into substitutes for hazard assessment.
A Precise Claim: “Fresh cleaning solvent per accepted board fell under the stated process conditions” is supportable with suitable data. “The product has no environmental impact” is a much stronger and usually unsupported claim.
Worked Example 5.1: Identify Source Prevention
Problem: A line can avoid 12 kg/week waste through accurate dispensing or treat that waste after generation. Which directly applies prevention?
Model / Approach: Both approaches can help, but compare the stage at which they act.
Step 1: Accurate dispensing changes the process before waste exists.
Step 2: It avoids the specified 12 kg/week.
Step 3: Treatment manages generated waste and can reduce its consequences.
Step 4: The dispensing change directly applies prevention; any remaining waste may still need treatment.
Answer: Accurate dispensing is source prevention.
Check and Interpretation: Avoiding waste and treating it are complementary but different actions.
2. Principles 1–4: Waste, Atoms and Hazard
The twelve principles are complementary design guides. They do not form one universal numerical score.
Principle 1: Prevent Waste
Avoid waste at source instead of relying entirely on later treatment. Accurate dispensing, selective deposition and better first-pass manufacturing yield can reduce rejected material and contaminated process streams. Preventing a late-stage defect also preserves resources used in earlier stages.
Principle 2: Improve Atom Economy
Prefer reactions that retain a high proportion of reactant atoms in the desired product. This is a theoretical stoichiometric measure. A high-yield reaction can still necessarily create substantial by-products, so atom economy and yield must be distinguished.
Principle 3: Use Less Hazardous Synthesis
Select routes that reduce hazard in reagents, intermediates and by-products while delivering the required product. Evaluate the route rather than only the final material name. A technically successful reaction may still need substantial improvement before large-scale manufacture.
Principle 4: Design Safer Chemical Products
Deliver the required performance with lower inherent hazard where feasible. An insulating coating still needs insulation and adhesion, but its chemistry can be selected with likely processing, service and end-of-life exposure in mind.
| Concept | Meaning |
|---|---|
| Hazard | Capacity to cause harm |
| Exposure | Contact under specified conditions |
| Risk assessment | Considers hazard together with exposure and context |
Keep the Distinction: A design can reduce hazard, exposure or both. Lower exposure does not change the inherent identity of a hazardous constituent, and a less hazardous substitute still needs proper use.
Worked Reasoning Without Numbers
Suppose an assembly process has excellent product yield but necessarily generates a large stoichiometric salt stream. Improving isolation may increase yield but cannot remove the salt required by the reaction equation. A different route with better atom economy addresses that part of waste generation. This example separates reaction design from manufacturing execution.
For safer-product design, begin with the required property. A flame-resistant component, insulating layer or conductive joint needs a real performance specification. Substitute chemistry that meets the requirement and assess likely exposure across manufacturing, service and recovery. Removing one substance without checking the replacement’s behaviour can create an avoidable substitution problem.
Principle Connection: Prevention asks whether waste can be avoided; atom economy asks where reactant atoms go; route hazard concerns synthesis; product safety concerns the delivered chemical function.
Prevention Can Address Quantity and Identity
Avoiding an unnecessary cleaning step reduces material throughput. Replacing a necessary hazardous cleaning chemical with an effective lower-hazard alternative changes identity. Improving selectivity can reduce both the amount of waste and the types of by-products. Explain which of these mechanisms is responsible for the improvement.
Atom Economy Follows the Balanced Equation
The theoretical reactant mass includes stoichiometric coefficients. If two moles of a reactant are required, their contribution is twice its molar mass. The desired product term also uses its coefficient. Choosing a different desired product changes the numerator and can change the interpretation.
Catalysts, solvents and separation aids are not automatically counted as consumed reactants in this reaction-only metric. This is not a claim that they have no burden; it identifies the boundary of the metric. Their material demand belongs in a process-level account.

Less Hazardous Synthesis Versus Safer Product
A route can use hazardous intermediates to obtain a relatively low-hazard final product. Another route may reduce intermediate hazards without changing the final material. Conversely, redesigning an additive can change the final product’s hazard even if manufacturing still needs improvement. These distinctions explain why principles 3 and 4 are separate.
Practical Application
For an insulating coating, compare electrical performance and adhesion while evaluating chemistry across application, service and end-of-life treatment. A substitute is promising when the function is retained and the relevant burden is genuinely reduced within the stated evidence.
Worked Example 5.2: Atom Economy from a Balanced Ledger
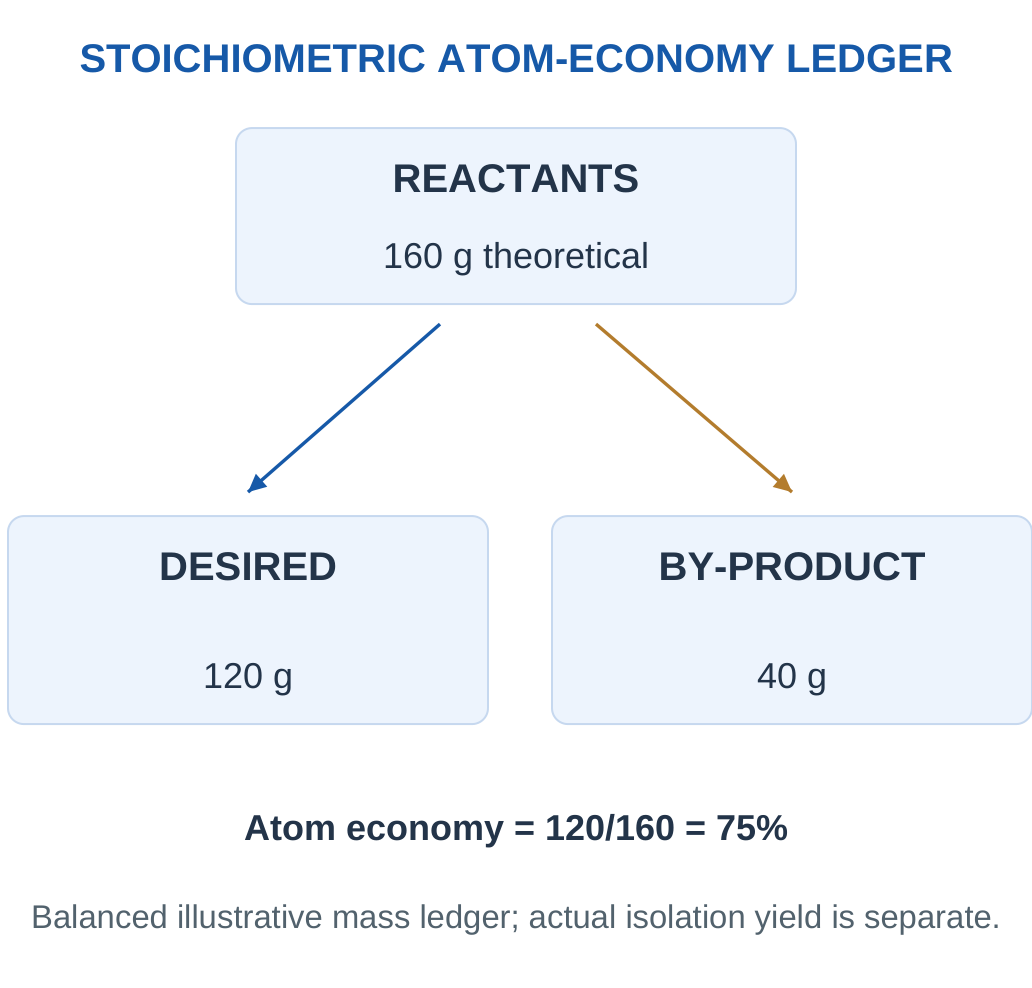
Problem: A balanced reaction consumes 160 g stoichiometric reactants to form 120 g desired product and 40 g by-product. Find atom economy.
Model / Approach: Use theoretical balanced masses; solvents/auxiliaries outside the equation are excluded.
Step 1: Desired-product stoichiometric mass is 120 g.
Step 2: Reactant mass is 160 g.
Step 3:
Atom economy = 120/160 × 100 = 75%
Step 4: Even complete conversion retains only this fraction in the desired product; by-product mass is intrinsic to the given reaction.
Answer: Atom economy 75%.
Check and Interpretation: 120 + 40 = 160 g closes the theoretical ledger.
Worked Example 5.3: Yield Is a Different Ratio
Problem: A reaction could theoretically form 120 g desired product but isolates 108 g. Find yield.
Model / Approach: Same product and purity basis in actual and theoretical masses.
Step 1: Theoretical product is 120 g.
Step 2: Actual product is 108 g.
Step 3:
Yield = 108/120 × 100 = 90%
Step 4: The atom economy of a balanced reaction is not recalculated from isolation yield. High yield can coexist with substantial stoichiometric by-products.
Answer: Yield 90%.
Check and Interpretation: The denominator is theoretical desired product, not all reactant mass.
3. Principles 5–8: Auxiliaries, Energy and Feedstocks
Principle 5: Choose Safer Solvents and Auxiliaries
Avoid unnecessary solvents and separation agents; where needed, use effective lower-hazard options. A rapidly evaporating solvent may simplify drying but create emissions or flammability concerns. Water-based processing can reduce selected solvent hazards while still requiring energy and wastewater treatment.
Principle 6: Improve Energy Efficiency
Reduce energy demand through suitable temperature, pressure, duration and equipment. Lower power does not guarantee lower total energy if operation takes longer. In electronics, curing, deposition, cleanroom utilities and assembly contribute to demand.
Principle 7: Consider Renewable Feedstocks
Use replenishable sources where technically and environmentally appropriate. Renewable describes origin; biodegradable describes transformation under conditions. A renewable polymer can still persist, and a degradable material need not originate entirely from renewable feedstock.
Principle 8: Avoid Unnecessary Derivatives
Reduce temporary modifications such as protecting groups when an effective route can omit them. Additional steps can consume reagents, solvent and energy and create waste. The target is a selective practical route, not simply the shortest diagram.
Integrated Electronics Example
A printable ink might combine a renewable binder, a safer carrier and a lower curing temperature. It must still achieve adhesion, conduction or insulation and stable service. If it fails early and requires frequent replacement, the fabrication benefit can be reduced or reversed.
Learn Through Verbs: Avoid auxiliaries; reduce energy; evaluate renewable inputs; omit unnecessary modifications. Always name the burden each action reduces.
Material Demand and Energy Can Trade Off
A water-based coating can reduce selected volatile-solvent concerns yet need more drying energy. A low-temperature route can take longer or create more rejects. Compare material, energy and useful output together rather than assuming one favourable operating condition proves a complete improvement.
Renewable feedstocks require an origin and supply assessment. The final polymer structure controls durability and degradation; biological origin does not force rapid environmental breakdown. A long-lived device can appropriately need a stable material, provided end-of-life management is designed.
Electronics Example: Cleaning
Choose an effective cleaning method compatible with the substrate and components. Reduce unnecessary cleaning where quality allows, use appropriate chemistry, control contamination and evaluate wastewater or spent solvent. Moving contamination from a board into an unmanaged liquid is not elimination of the burden.
Solvent Choice Is a Multi-Property Decision
A solvent must dissolve, disperse, clean or separate as required. It also interacts with equipment, substrate and worker/environment conditions. Boiling behaviour, flammability, compatibility and recoverability influence use. A formulation that cleans effectively but damages a polymer housing is not an adequate substitute.
Drying and Curing Are Different
Drying removes a volatile carrier, while curing develops the required chemical or physical network in a material. A process can involve both. Lower carrier content can reduce drying demand without changing cure requirements; a new binder can change curing conditions even when the carrier is unchanged.
Renewable Does Not Describe Every Stage
A renewable feedstock can require substantial conversion, transport or purification. The comparison needs the material’s route and useful service rather than origin alone. A stable renewable-derived polymer may be useful in a long-lived device, while a different design may intentionally favour end-of-life transformation.
Avoid Derivatives with a Practical Route
Removing a temporary modification is useful when the route remains sufficiently selective and workable. If omitting it creates more by-products and difficult separations, the complete process may not improve. The principle guides better design rather than requiring the fewest reaction steps at any cost.
Electronics Example: A lower-solvent printable ink still needs stable dispersion, suitable deposition, proper cure and reliable conductivity or insulation. The process account follows all these stages.
Worked Example 5.4: Compare Fresh Solvent Demand
Problem: A uses 6 kg solvent for 2 kg product; B uses 4 kg for the same output. Find intensities and reduction.
Model / Approach: Count fresh solvent only; hazard and energy are not scored by this mass ratio.
Step 1: A intensity = 6/2 = 3 kg/kg.
Step 2: B intensity = 4/2 = 2 kg/kg.
Step 3:
Demand reduction = (6 − 4)/6 × 100 = 33.3%
Step 4: B improves this material metric. Compare solvent identity, recovery, drying energy and product quality before claiming a complete advantage.
Answer: 3 versus 2 kg/kg; 33.3% lower fresh solvent demand.
Check and Interpretation: Equivalent useful output makes the comparison meaningful.
Worked Example 5.5: Power Versus Total Energy
Problem: A uses 2 kW for 3 h; B uses 1.5 kW for 5 h for the same batch. Compare energy.
Model / Approach: Constant stated power and equal useful output; only this step included.
Step 1: A uses 2 × 3 = 6 kWh.
Step 2: B uses 1.5 × 5 = 7.5 kWh.
Step 3: B uses 1.5 kWh more despite lower power.
Step 4: A is lower-energy for this step. Whole-line utilities, yield and other stages can alter a broader comparison.
Answer: A: 6 kWh; B: 7.5 kWh.
Check and Interpretation: Power is a rate; duration sets energy.
4. Principles 9–12: Catalysts, Degradation and Control
Principle 9: Use Suitable Catalysis
A catalyst participates in a reaction pathway and is regenerated in the catalytic cycle. Selective catalysis can reduce stoichiometric reagent consumption and by-products. Catalyst manufacture, recovery, lifetime and residues remain part of the comparison.
Principle 10: Design Appropriate Degradation
After useful service, a chemical product should, where appropriate, transform without persistent harmful accumulation. Service stability and end-of-life transformation must be balanced. A substrate that disappears but leaves problematic components does not solve the whole device problem.
Principle 11: Analyse in Time to Prevent Pollution
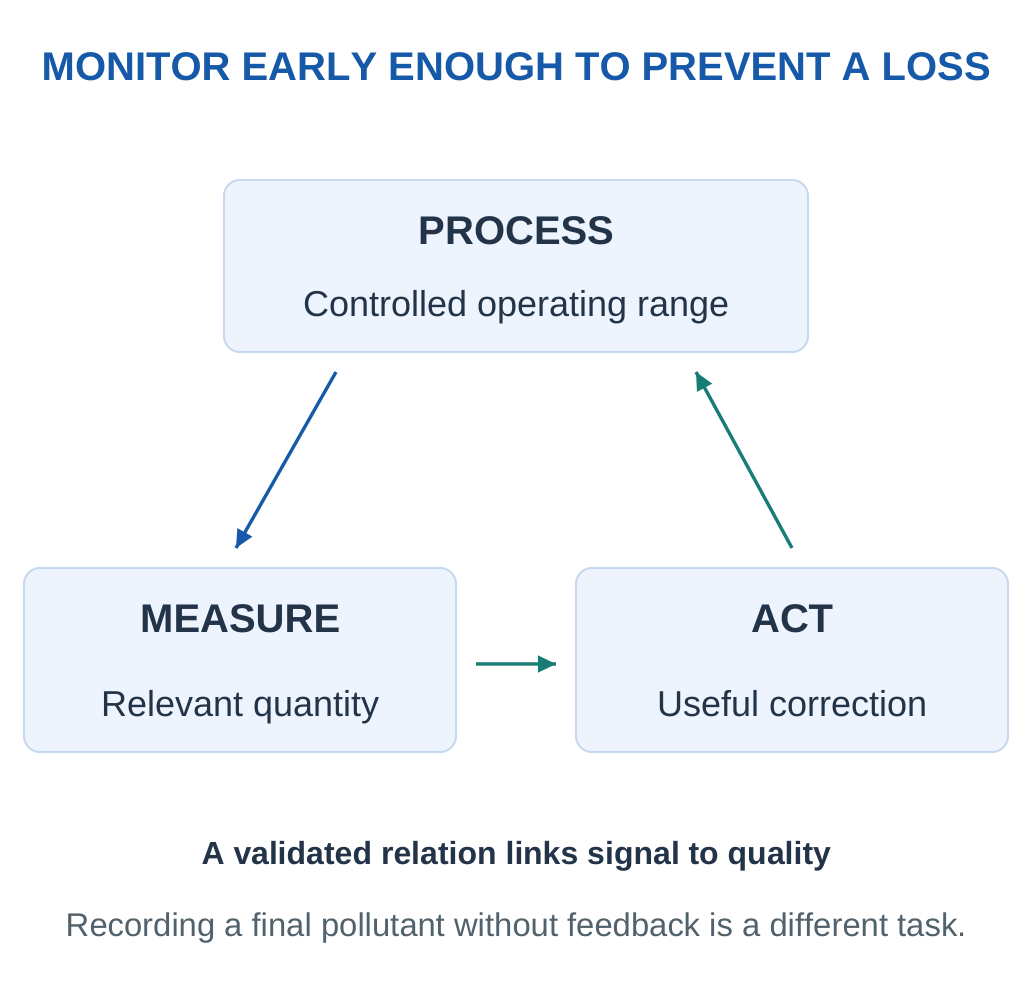
Monitor conditions soon enough to correct a developing problem before it generates large amounts of waste. Concentration, composition, temperature or endpoint information can support feedback. Measuring a final polluted tank without process action is a different activity.
Principle 12: Prefer Inherently Safer Chemistry
Select chemical identities and physical forms that reduce the potential for fires, explosions or accidental releases. Inventory, pressure, temperature and compatibility influence consequences. Reducing hazardous inventory can reduce accident scale.
| Confusion | Correction |
|---|---|
| Small amount means catalyst | Regeneration and reaction role define catalysis |
| Fragmentation means degradation | Persistent small fragments can remain |
| Natural means safe | Origin alone does not establish hazard |
| Monitoring means prevention | Feedback must act early enough |
Examination Method: Give each principle’s meaning and an example. A list of names is incomplete when the question asks for an explanation.
Feedback That Prevents an Avoidable Batch Loss
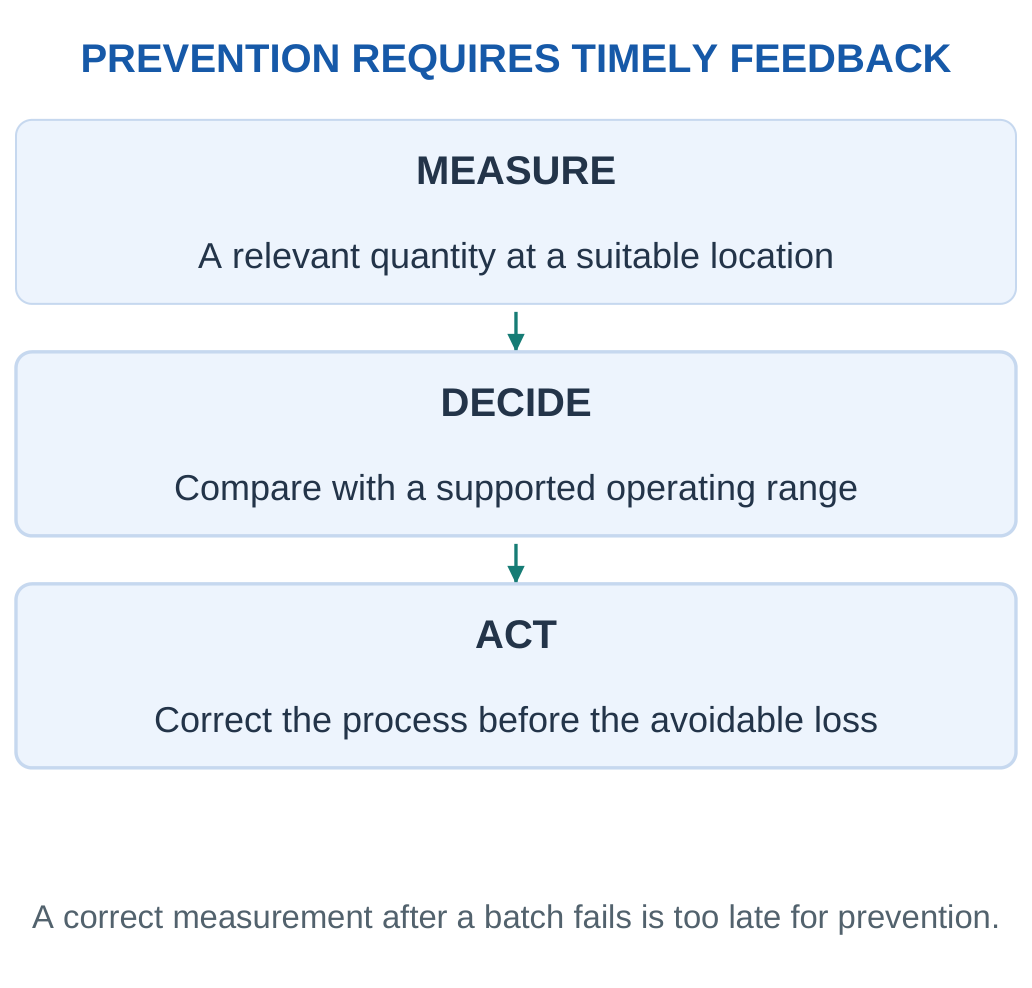
A process monitor measures a property linked to quality, compares it with an operating range and triggers a suitable action. This can detect a drift before an entire batch becomes scrap. The relation between the monitored quantity and product quality must be validated; a sensor alone does not guarantee prevention.

Safer Form and Inventory
The amount and physical form of a hazardous material influence release consequences. A process that uses a smaller contained inventory can reduce potential accident scale. This complements engineering controls and operating practice. Inherent safety is a design direction, not a claim that all remaining precautions are unnecessary.
A Catalyst’s Benefits Require Selectivity and Life
A catalyst can facilitate repeated transformations and reduce stoichiometric reagent demand. Its usefulness depends on the desired pathway, stability and resistance to deactivation. An inexpensive-looking catalytic step can still require difficult catalyst separation or leave residues incompatible with an electronic material.
Design Degradation for the Use Case
A material intended for years of protection needs stability during service. End-of-life design can instead support separation, recovery or a controlled transformation after use. Rapid environmental breakdown is not a universal requirement for every durable component. The appropriate outcome depends on function and likely disposal route.
Feedback Is a Complete Chain
A measurement provides information, a decision compares it with a supported operating range, and an action changes the process. Delays can matter: a correct reading obtained after an entire batch fails does not prevent that failure. Sampling location and measurement speed should match the physical process.

Inventory and Accident Consequences
Reducing the amount of hazardous material present at one time can reduce the possible scale of a release. Lower temperature or pressure can also help where compatible with the process. Inherent design choices complement containment, operating controls and training. Neither a catalyst nor a natural feedstock automatically makes a complete process accident-free.
Worked Example 5.6: Endpoint Control Saving
Problem: Validated endpoint control cuts reagent use from 8 to 6.5 kg/batch at unchanged output. Find saving over 20 batches.
Model / Approach: Use the supplied comparable validated operation.
Step 1: Saving per batch = 8 − 6.5 = 1.5 kg.
Step 2: Total saving = 1.5 × 20 = 30 kg.
Step 3: Input reduction = 1.5/8 × 100 = 18.75%.
Step 4: Timely measurement supports prevention by changing the process before excess consumption. A final measurement without feedback would not cause the same saving.
Answer: 30 kg saved; 18.75% lower stated reagent demand.
Check and Interpretation: This is a reagent metric, not automatically total waste or hazard.
5. Material Metrics: Atom Economy, Yield and Waste
Metrics support comparisons only when their product definition and boundary are consistent. No single mass ratio includes every hazard, energy or reliability consequence.

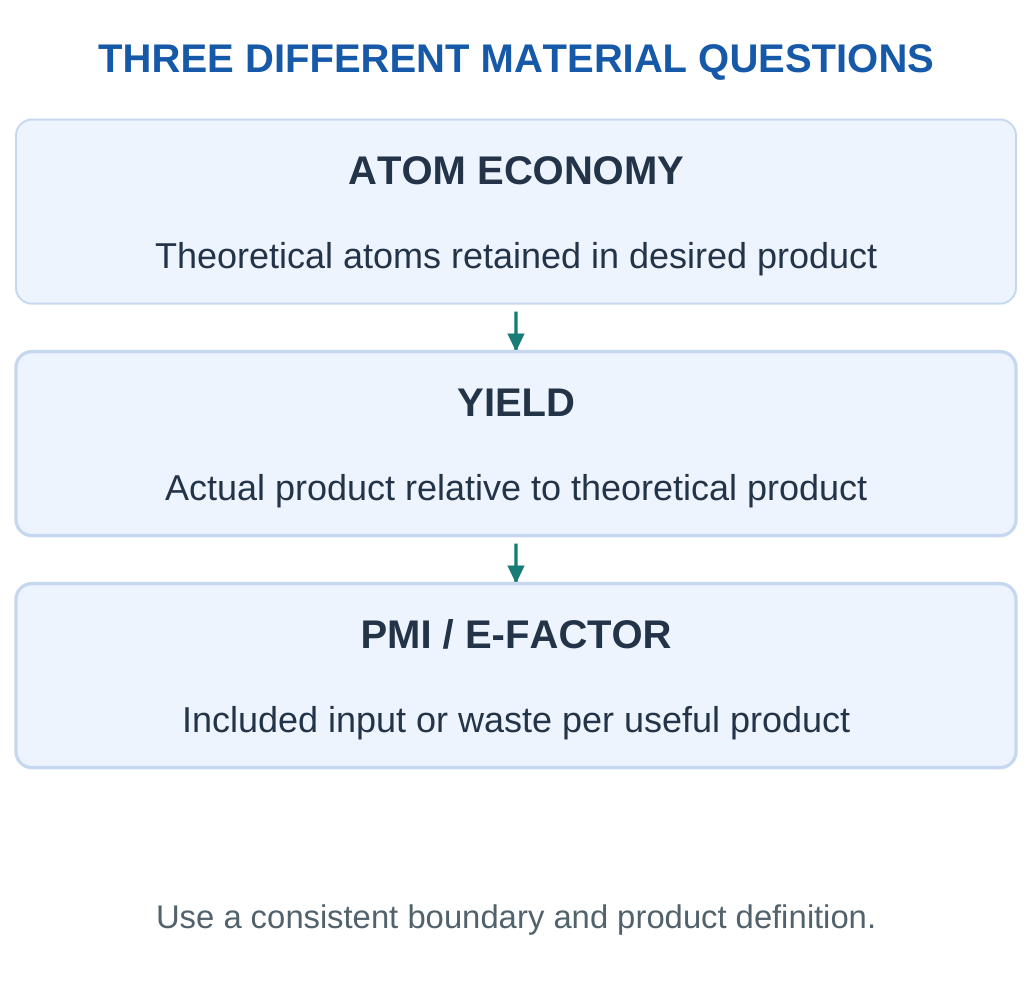
Atom Economy
Atom economy = Desired stoichiometric product mass / Total stoichiometric reactant mass × 100%
Use a balanced reaction and coefficients. Solvents and catalysts not consumed in that equation are not automatically included in this theoretical measure.
Percentage Yield
Yield = Actual isolated product / Theoretical product × 100%
Use matching product and purity definitions. Yield can change through incomplete conversion or isolation loss without changing theoretical atom economy.
Process Mass Intensity and E-factor
PMI = Total included material input / Useful product mass
E-factor = Included waste mass / Useful product mass
In a closed common boundary where input leaves only as useful product or waste:
E-factor = PMI − 1
Boundary Traps
Water, internal recycling, recovered solvent and inventory changes need explicit treatment. A gross circulating solvent charge differs from fresh makeup demand. A water-excluding PMI should not be compared directly with a water-inclusive value.
A lower PMI can indicate better material efficiency while still using a more hazardous solvent or greater energy. State what improved and what remains unassessed.
Numerical Method: Identify useful product, draw the included input/output boundary, close the mass balance and only then calculate a ratio.
A Mass-Flow Diagram Makes the Metric Visible

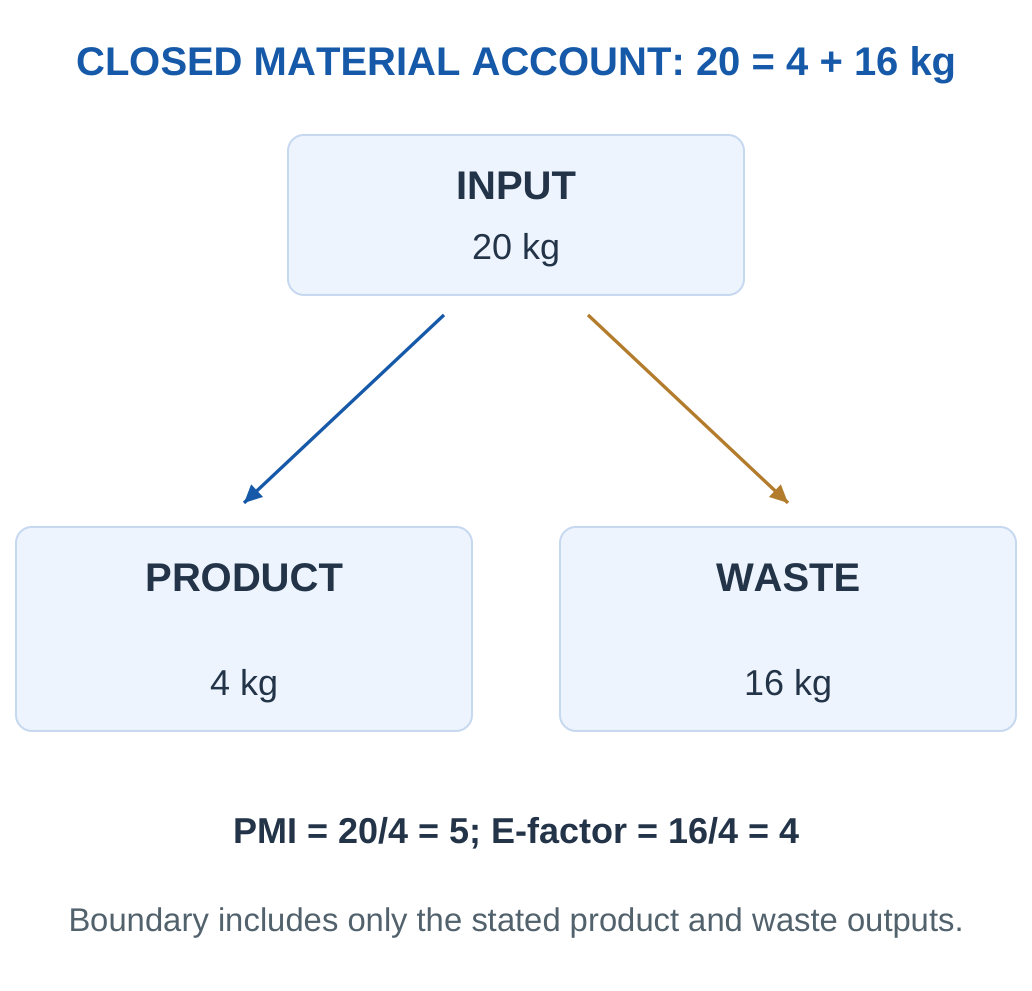
Atom Economy Is Not a Waste Audit
A theoretical reaction ratio does not include every cleaning solvent, separation agent or rejected batch. PMI and E-factor extend the material account, but neither automatically weights toxicity. Two kilograms of different wastes can have very different handling needs.
Recycle Accounting
Keep fresh input distinct from internal circulation. A recovered solvent can reduce fresh demand, while some purge may be needed to control impurities. Disclose whether recovered outputs receive a credit or leave the boundary. Do not combine incompatible accounting methods just to make a ratio look smaller.
Product Definition Changes the Denominator
A crude wet product and a dry accepted product can have different masses. Comparing their ratios without correcting the product basis can make one process appear artificially efficient. Specify whether the output is isolated, dry and of the required purity.
Yield Losses and Process Waste
Unreacted material, separation loss and rejected output can affect actual yield. Atom economy remains tied to the balanced reaction. A route with high theoretical atom economy can still have poor process mass efficiency because of excessive solvent, low yield or repeated cleaning.
A Useful Accounting Diagram
Show fresh input entering, useful product leaving, waste leaving and any inventory change. Internal circulation is drawn inside the boundary. If recovered solvent leaves as a co-product, state how it is treated in the metric instead of quietly counting it as both avoided input and a full output credit.

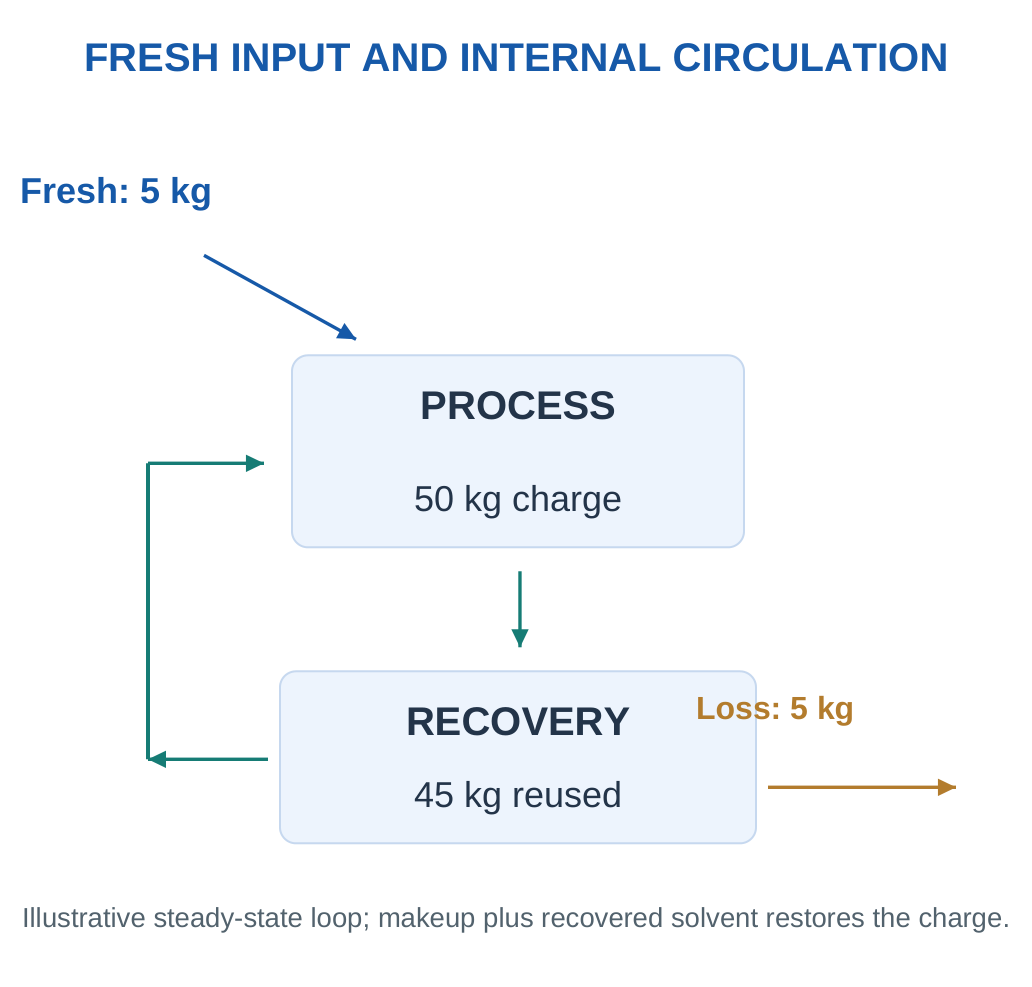
Several Metrics, One Decision
A good comparison can report atom economy, yield, PMI, energy intensity and relevant hazard information together. Improvement in one metric motivates further analysis rather than ending it. Explain why a lower mass ratio may not outweigh a much more problematic chemical or a large increase in energy.
Conservation Check: If included input is not equal to included output plus inventory change, first locate the accounting gap. A neat ratio cannot repair an unclosed material ledger.
Worked Example 5.7: PMI and E-factor
Problem: A batch includes 20 kg inputs and delivers 4 kg useful product, all other input becoming waste. Find PMI and E-factor.
Model / Approach: Closed common boundary; no inventory change or separate credit.
Step 1: PMI = 20/4 = 5 kg/kg.
Step 2: Waste = 20 − 4 = 16 kg.
Step 3: E-factor = 16/4 = 4 kg/kg.
Step 4: E-factor equals PMI − 1 because all included input leaves as product or waste. Different conventions can invalidate the shortcut.
Answer: PMI 5; E-factor 4.
Check and Interpretation: 4 kg product plus 16 kg waste equals 20 kg input.
Worked Example 5.8: Water-Boundary Effect
Problem: A process uses 5 kg other inputs and 15 kg water to make 2 kg product. Find PMI with and without water.
Model / Approach: Label the two accounting conventions explicitly.
Step 1: Water-inclusive input = 20 kg.
Step 2: Water-inclusive PMI = 20/2 = 10.
Step 3: Water-excluding PMI = 5/2 = 2.5.
Step 4: The values describe the same physical process under different conventions. Compare another process only after matching boundaries.
Answer: PMI 10 including water; 2.5 excluding water.
Check and Interpretation: Excluding water does not make its environmental demand disappear.
Worked Example 5.9: Fresh Makeup and Internal Circulation
Problem: A loop circulates 50 kg solvent and recovers 45 kg for the next identical batch. Find recovery fraction and fresh makeup.
Model / Approach: Steady operation, no inventory change or other solvent source.
Step 1: Recovery fraction = 45/50 = 0.90.
Step 2: Recovery is 90%.
Step 3: Fresh makeup = 50 − 45 = 5 kg/batch.
Step 4: Gross circulating charge and fresh demand are different quantities. State which is counted in a mass metric.
Answer: 90% solvent recovery; 5 kg fresh makeup.
Check and Interpretation: 45 + 5 restores the next 50 kg charge.
Worked Example 5.10: Compare Routes with Yield and Process Inputs
Problem: Route A theoretically gives 10 kg product, isolates 8 kg and uses 40 kg included input. B also theoretically gives 10 kg, isolates 9 kg and uses 36 kg input. Compare yield and PMI.
Model / Approach: Outputs have matching purity and dry basis. The included input definitions match; no separate hazard or energy score is supplied.
Step 1:
A yield = 8/10 × 100 = 80%
A PMI = 40/8 = 5 kg input per kg useful product
Use actual useful output for PMI.
Step 2:
B yield = 9/10 × 100 = 90%
B PMI = 36/9 = 4 kg/kg
It has both higher yield and lower material intensity in this comparison.
Step 3: Using theoretical product in the PMI denominator would hide actual output loss. Theoretical mass belongs in yield, while useful actual product belongs in this process metric.
Step 4: B improves the supplied material measures, but this alone does not prove lower toxicity, energy use or every life-cycle burden. Those need their own evidence on a consistent service basis.
Answer: A: yield 80%, PMI 5. B: yield 90%, PMI 4.
Check and Interpretation: Higher useful output and lower included input both contribute to B’s lower PMI.
Worked Example 5.11: A Closed Process with an Inventory Change
Problem: A batch receives 50 kg fresh input. It produces 10 kg useful product and 35 kg recorded waste, with the remaining material retained in equipment. Find inventory increase.
Model / Approach: No other input or output is present. The material boundary includes equipment contents, so retained material is not silently counted as waste.
Step 1:
Input = Product + Waste + Inventory increase
Recorded product and waste sum to 10 + 35 = 45 kg.
Step 2:
Inventory increase = 50 − 45 = 5 kg
The complete ledger is 50 = 10 + 35 + 5 kg.
Step 3: A simple waste/product ratio is 35/10 = 3.5 for the recorded waste. A 50/10 input ratio is 5, but subtracting one gives 4, not 3.5, because inventory changed.
Step 4: The familiar E-factor = PMI − 1 identity requires the stated product-plus-waste closure without this unaccounted inventory term. A full reporting method must declare how inventory is handled.
Answer: Inventory increases by 5 kg; the simple closed product-plus-waste shortcut is inapplicable.
Check and Interpretation: Retained material belongs in the balance even if no visible waste stream carries it away.
6. Environmentally Friendlier Electronic Materials
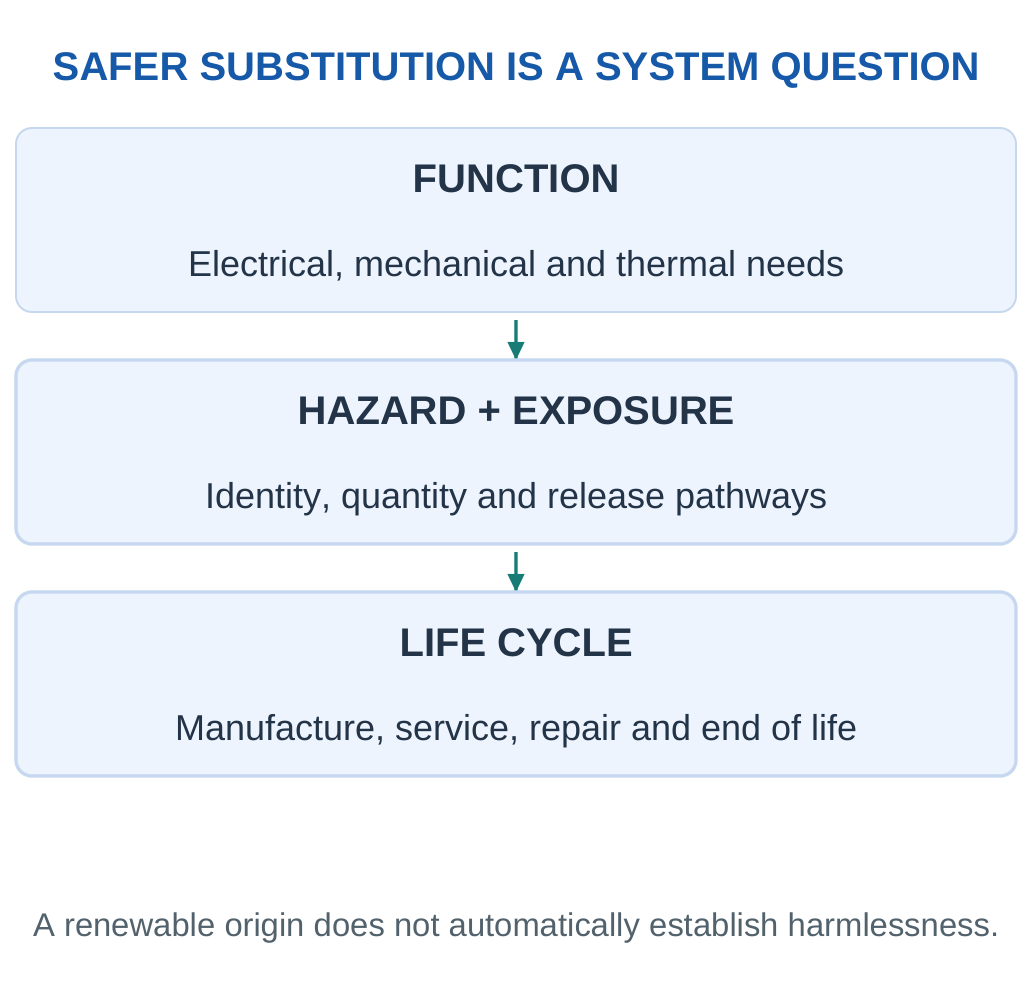
An environmentally friendlier material delivers a relevant improvement while meeting its required function. Composition, quantity, manufacture, durability and end-of-life fate all affect the comparison. The phrase is relative, not a guarantee that every stage is harmless.
Key Point: Substitution Must Retain Service
A lower-hazard ingredient is useful, but a device that fails early can require additional manufacture and waste. Compare alternatives for the same required service and reliability.

Conductors and Solders
Copper and aluminium provide useful conduction and can be recovered where suitable collection and processing exist. Recycled content can reduce primary-material demand, but purity and application requirements remain important.
Lead-free solders can reduce reliance on lead in relevant assemblies. Tin-based alloy choices affect melting behaviour, joint properties and process conditions. Lead-free does not mean free from every hazard, and it does not certify a complete product’s compliance.


Substrates, Binders and Coatings
Lower-hazard formulations, appropriate recycled inputs and recovery-compatible adhesives can help. A strong adhesive may improve service reliability but obstruct separation. A soluble binder may aid recovery yet require controlled solvent and effluent management.
Substitution Test: Does it perform? Does it reduce the relevant hazard? What changes in energy, durability, emissions and recovery? Judge the complete service rather than one isolated ingredient.
Electronics Are Layered Material Systems


An alternative solder must make reliable joints under the required thermal and mechanical conditions. An alternative substrate must support the circuit and resist the expected environment. A recycled polymer may need controlled composition to achieve consistent electrical and fire performance. These requirements explain why substitution needs more than a lower-impact ingredient claim.
Evidence and Traceability
Use material identity, supplier information and suitable testing. Appearance cannot distinguish a compliant alloy or prove recycled origin. Traceability connects the claim to the actual supplied material and production lot.
Material Specification and Service Environment
A conductor needs appropriate conductivity and stable contacts. A dielectric needs insulation under its operating conditions. A substrate needs mechanical support and compatibility with processing. A solder joint needs the required electrical and mechanical reliability. These specifications explain why material substitution is an engineering decision as well as a chemistry choice.
Recycled Materials and Controlled Composition
Recycled inputs can reduce demand for primary resources, but their source and composition must be controlled for the application. An uncontrolled mix can introduce variability, contaminants or unsuitable additives. Characterisation and traceability help a recovered material become a reliable feedstock rather than an anonymous waste fraction.
Additives and Complete Formulations
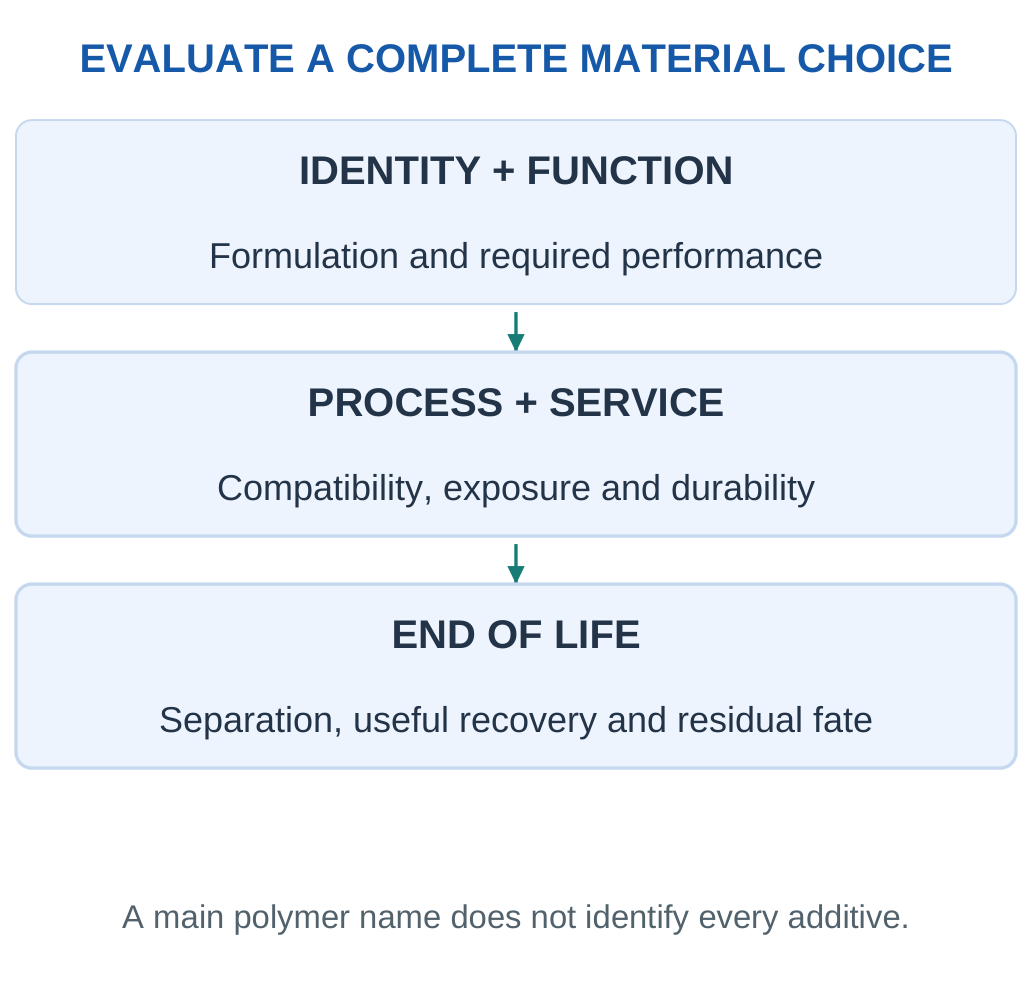
A polymer’s name does not describe every additive in a housing or coating. Colourants, stabilisers, fillers and flame-retardant systems can influence performance and treatment. Evaluating only the main polymer can miss the constituent that determines a specific hazard or separation issue.

Avoid Regrettable Substitution
Removing one concern while introducing another poorly assessed one can undermine the intended benefit. Compare the alternative’s relevant hazards, exposure routes, durability and treatment needs. The objective is a supported improvement, not merely a different substance name.
Decision Case: A Safer Binder with a Shorter Service Life
An insulating part is required for six years. The supplied manufacturing account is 10 impact units per conventional part lasting six years and 7 units per alternative part lasting two years. The alternative binder has a lower value for a separately specified hazard indicator. These are teaching values, not a complete real product assessment.
Service Calculation:
- Conventional design: one part × 10 = 10 manufacturing units
- Alternative design: three parts × 7 = 21 manufacturing units
The alternative can improve the specified binder hazard indicator while increasing this manufacturing-service indicator.
Interpretation: Neither result cancels the other. A decision should not hide the hazard benefit, nor should it ignore repeated manufacture. Further design could improve alternative durability or reduce its manufacturing burden. The useful engineering question is how to retain its beneficial chemistry while meeting the service requirement.
Information Still Needed
Replacement transport, maintenance, use-phase effects, waste and the relevant exposure situations are outside the simple manufacturing account. The hazard indicator also needs an explicit definition. A single total cannot combine those different dimensions without a justified method.
Lesson: A substitution can improve one dimension and worsen another. State the trade-off clearly and compare the same service rather than choosing a winner from the ingredient name alone.
Worked Example 5.12: A Substitution Must Retain Function
Problem: A coating serves five years. A lower-hazard alternative fails after one year. Does lower binder hazard alone establish the better complete device?
Model / Approach: No complete life-cycle dataset is given.
Step 1: Both options must deliver the required insulation service.
Step 2: The alternative currently fails that service requirement.
Step 3: Frequent replacement can add material, manufacturing and waste burdens.
Step 4: Lower binder hazard is a useful development direction but does not alone establish complete superiority.
Answer: No complete advantage is established without adequate reliability and broader comparison.
Check and Interpretation: One improved constituent is not the same as lower total burden per service.
7. Biodegradable and Transient Electronics
Biodegradable electronics use materials or components capable of biological transformation under specified conditions. Transient electronics are designed to lose function or transform after a defined time or trigger. A device can dissolve without being fully biodegradable.


Architecture and Materials
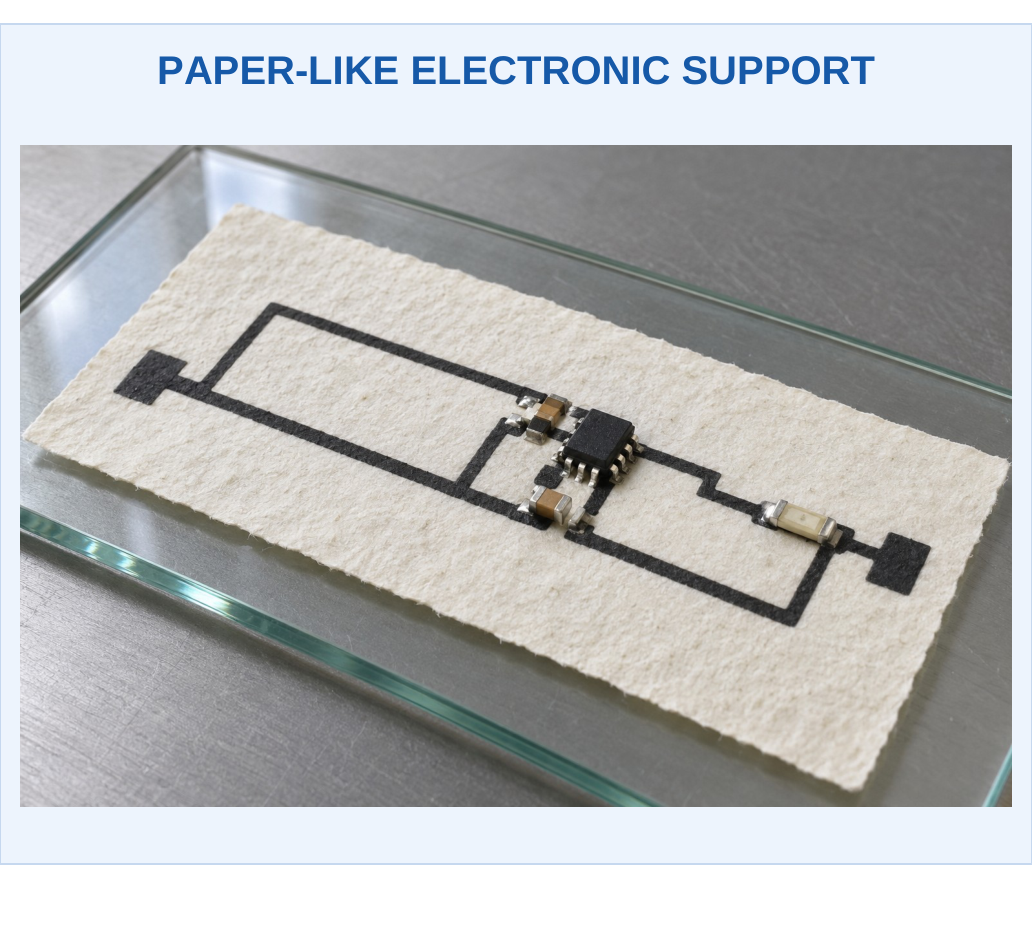
Cellulose-based supports and selected degradable polymers can provide substrates. Conductors, chips, batteries and protective layers may have very different fates. Degradation products and their concentration in the receiving environment matter as much as visible disappearance.

Function First, Transformation Later
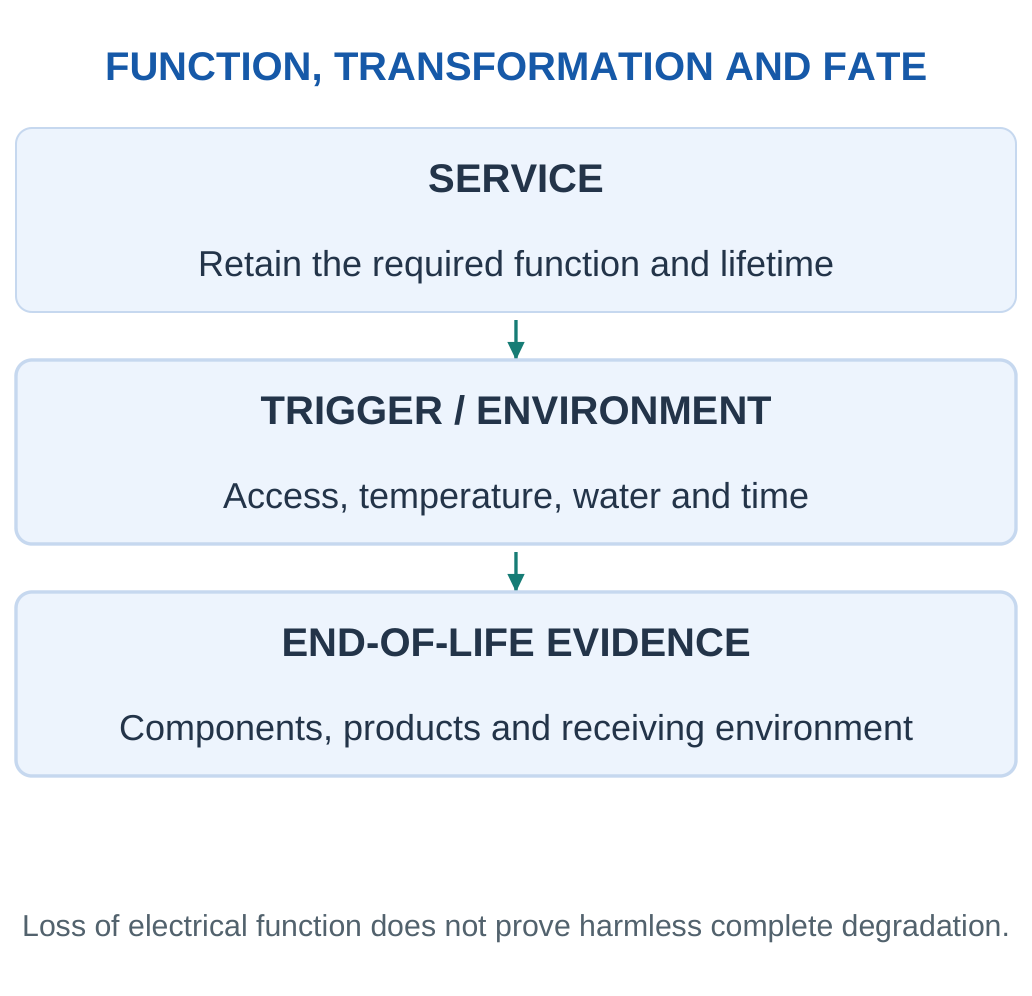
The device must remain stable during its intended service. Encapsulation, thickness and environmental access can help control when transformation starts. Rapid end-of-life change and reliable service are competing requirements that need deliberate design.
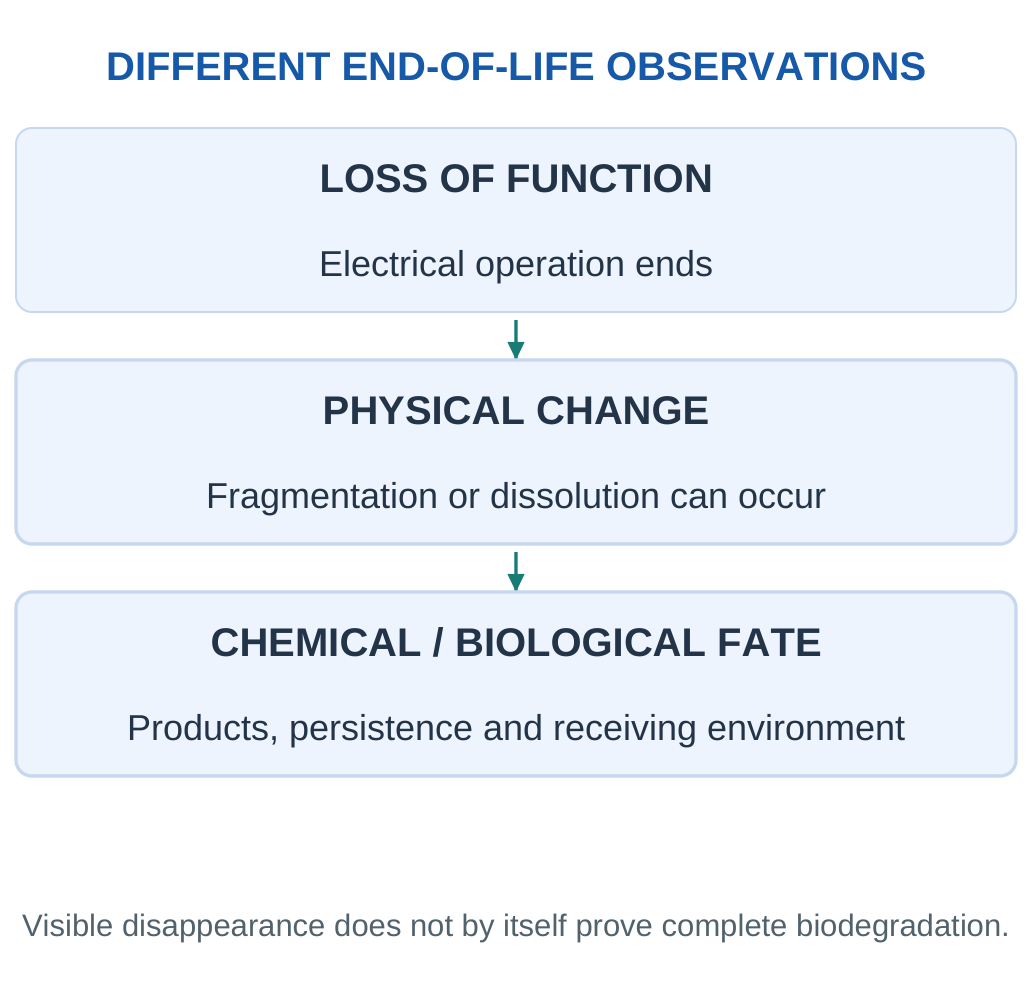
Dissolution disperses material into a medium. Fragmentation creates smaller pieces. Biological transformation is a different process; complete mineralisation is a stronger claim still. Specify environment, timescale, products and measurement method.
Temporary environmental sensors and selected biomedical devices motivate this field. Biodegradable should never be interpreted as permission to litter electronics into soil or water.
Complete Explanation: Material identity + component coverage + environment + time + products + retained service function.
Timing Is Part of the Design
A temporary sensor may need days of operation followed by controlled transformation, while another application needs years of stability. An encapsulation layer controls access of water or other agents, but must be assessed together with the active materials. A premature loss of electrical continuity is device failure, not automatically a successful environmental outcome.

How to Support a Claim
Report the tested environment, timescale, component coverage and transformation evidence. Weighing remaining solid measures one outcome; identifying dissolved products and biological conversion answers different questions. A complete assessment asks what reaches the receiving environment, not only what disappears from view.
Four Distinct Outcomes After Exposure
Electrical function can cease before the device visibly changes. A device can physically disintegrate while its fragments remain chemically persistent. A material can dissolve into a liquid without undergoing biological conversion. Biological transformation can occur at a rate dependent on the environment. These outcomes should be measured and named separately.
Environment and Timescale
Temperature, moisture, microbial activity and access influence degradation. A result under one controlled test does not establish the same rate in dry storage, natural water or another receiving environment. The timescale must also match the intended claim: a slow change over years does not prove rapid disappearance after a short deployment.

Components That Remain
A large biodegradable substrate can dominate device mass while a small battery, chip or metallic component remains important. A mass fraction is useful but does not weight every constituent’s hazard or mobility. Whole-device assessment therefore requires more than a percentage of degradable support.
A Suitable Application Argument
For a temporary sensor, explain required operating life, the trigger or environment for transformation, the response of each important component and the fate of products. A device that fails before completing its task has not met the service requirement, even if its material was designed to degrade eventually.
Worked Example 5.13: Component Evidence Versus Whole Device
Problem: A 10 g device has 7 g substrate demonstrated biodegradable in a stated test; 3 g other parts are untested. Find demonstrated mass fraction.
Model / Approach: Use only the supplied component evidence.
Step 1: Demonstrated mass = 7 g.
Step 2: Device mass = 10 g.
Step 3: Fraction = 7/10 = 70%.
Step 4: The remaining 30% is uncharacterised here. A complete-device biodegradability claim is unsupported.
Answer: 70% of mass has the specified evidence.
Check and Interpretation: The fraction does not state degradation rate or product harmlessness.
Worked Example 5.14: Mass Loss Does Not Identify Mechanism
Problem: A specimen drops from 5.0 g to 1.5 g remaining solid after exposure. Find solid mass loss.
Model / Approach: Only solid mass is measured; dissolved products and biological conversion are not known.
Step 1: Decrease = 5.0 − 1.5 = 3.5 g.
Step 2: Fraction = 3.5/5.0 = 0.70.
Step 3: Solid mass loss is 70%.
Step 4: Dissolution, fragmentation or transformation may contribute. This is not proof of 70% mineralisation or absence of harmful products.
Answer: 70% solid mass loss; mechanism remains unproven.
Check and Interpretation: Material missing from the solid can still exist in another environmental phase.
8. E-waste Generation and Composition
E-waste consists of discarded electrical/electronic equipment and relevant assemblies within the defined waste boundary. Computers, phones, displays, appliances and smart devices have different compositions and treatment needs.
Key Point: Stocks Are Not Annual Flows
Stored equipment, purchases, generated waste and collected waste need not describe the same cohort. State the period and boundary and avoid treating every inventory quantity as interchangeable.

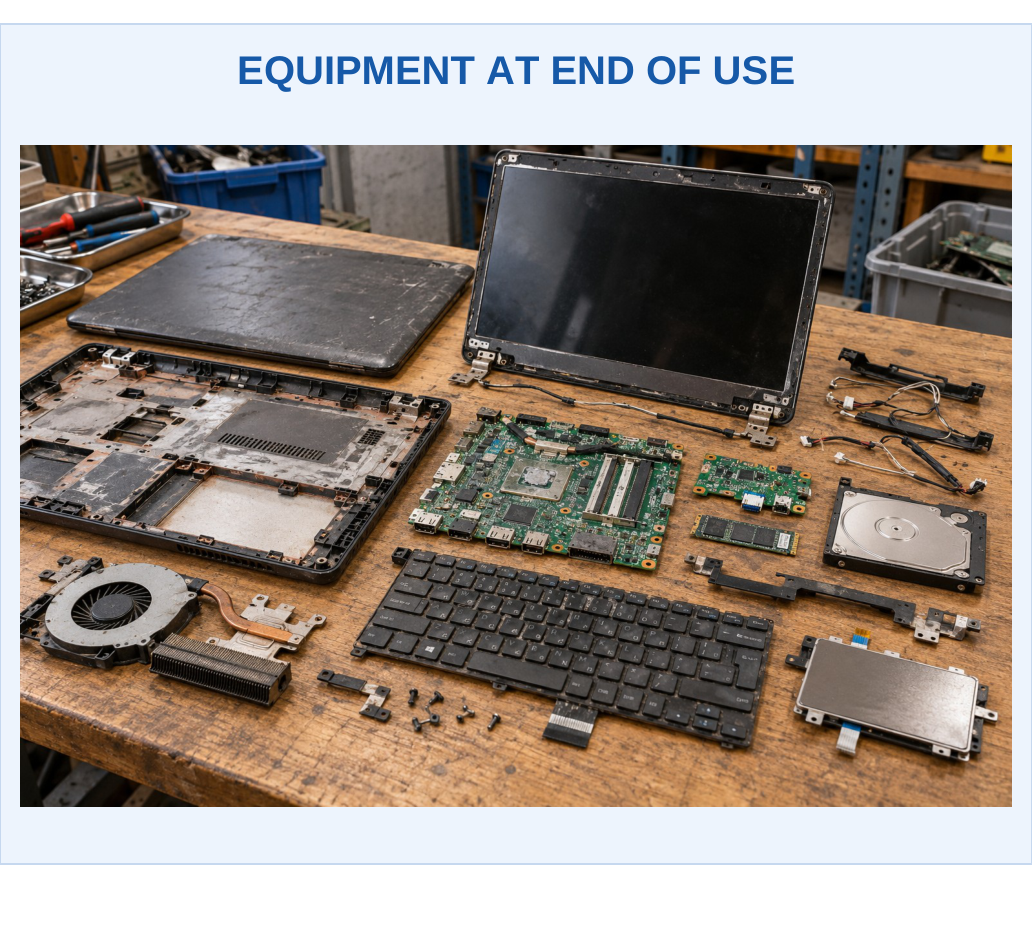
Why Equipment Becomes Waste
Physical failure, battery deterioration, unsupported software, changing performance needs and difficult repair can all shorten useful service. A functioning object can become unsuitable for a required task before all its materials wear out. Maintenance and support therefore influence waste generation.
Heterogeneous Materials
Equipment may contain steel, aluminium, copper, glass, polymers, boards and batteries, with smaller quantities of valuable metals. Content varies by product and age. Do not apply one phone composition to every appliance or assume every board has the same metal grade.


Correct Inventories
Equipment placed on a market, waste generated, waste collected and material recovered are different quantities. State mass or count, period, location and equipment boundary. Stored unused equipment may also need separate reporting from discarded equipment.
Denominator Rule: A collection fraction uses its defined generated-equipment denominator. Metal recovery uses target metal in feed. Mixing these quantities produces an invalid percentage.
Stocks and Flows
A stock is equipment held at a given time. A flow is equipment moving into or out of a defined system during a period. Devices stored in drawers, equipment bought in one year and waste collected in that year are not necessarily the same cohort. A waste estimate should not assume they match without an explicit model.
Product Life and Support
A replaceable battery can extend hardware service, but software and component availability may still limit useful life. A programme should distinguish repairable faults from performance requirements that cannot be met. This makes prevention practical rather than a slogan to keep every device forever.
Inventory Fields: Equipment type, count/mass, condition, date, service suitability, special components and destination. Consistent records improve both reuse and treatment decisions.
Obsolescence Has Several Causes
A broken connector is a different problem from inadequate performance or discontinued support. A replaceable part can address a repairable fault, while an unsupported operating environment can limit continued service even when hardware works. Waste prevention should identify the actual cause rather than assume every device needs the same intervention.
Composition Changes Across Equipment
A display, a motor-driven appliance and a circuit-board-rich device have different material profiles. Batteries add another stream. A recycling line must therefore understand incoming equipment and not rely on one average composition as a universal recipe.
Counts and Masses Answer Different Questions
Counts help track equipment identity and service outcomes. Mass helps plan material flows. A few heavy appliances can dominate collected mass while many small devices dominate count. State both when needed and do not infer one from the other without device-mass data.

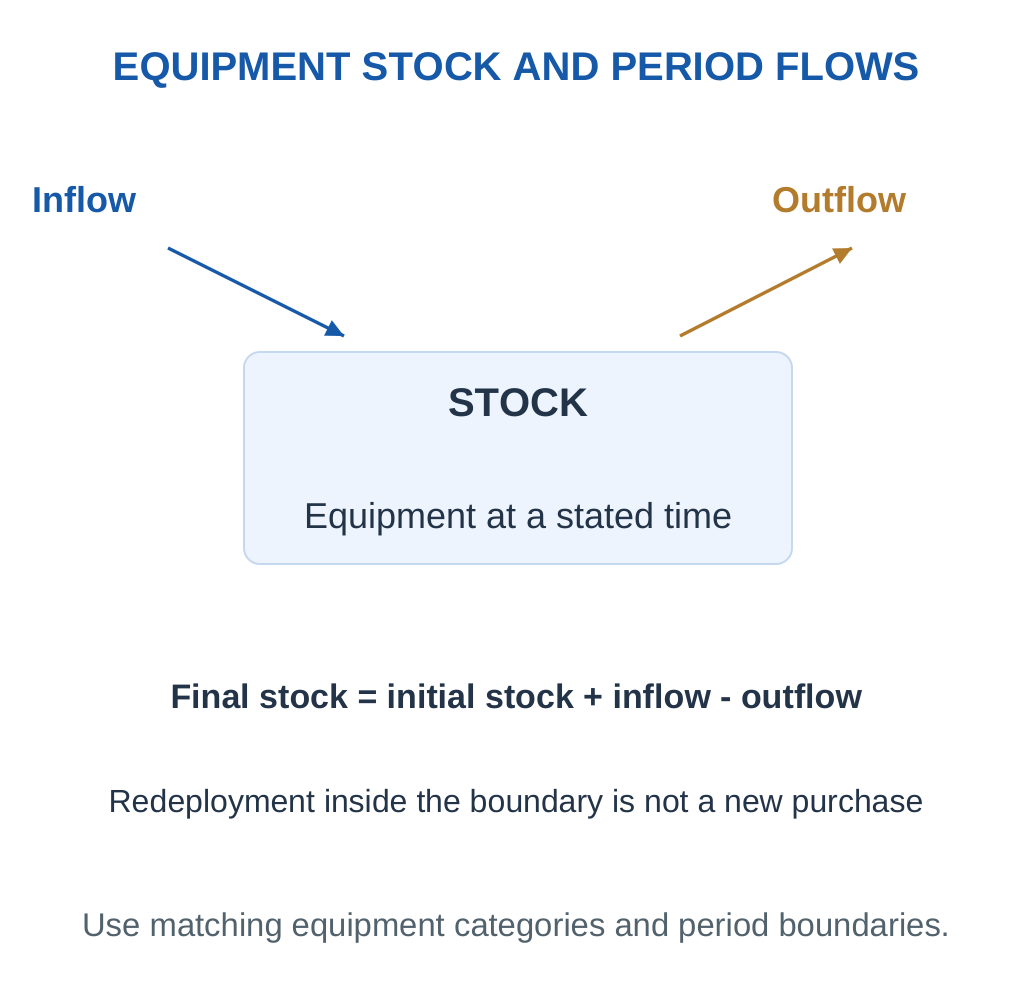
Why Storage Matters
Stored equipment delays material return and can obscure inventory. A programme needs a clear category for equipment awaiting assessment, reusable stock, repair stock and waste awaiting treatment. Recording these differences prevents a stored item from being counted repeatedly as a new recovery outcome.
Worked Example 5.15: Collection Fraction
Problem: A defined institution generates 1200 kg waste equipment and collects 900 kg in the same year. Find fraction and uncollected mass.
Model / Approach: Matching period/boundary; this is not a statutory target calculation.
Step 1: Fraction = 900/1200 = 0.75.
Step 2: Collection is 75%.
Step 3: Uncollected mass = 1200 − 900 = 300 kg.
Step 4: Collected equipment still needs suitable reuse or treatment. Collection percentage is not a metal-recovery efficiency.
Answer: 75% collection; 300 kg outside the collected stream.
Check and Interpretation: The numerator and denominator are equipment masses.
Worked Example 5.16: Equipment Inventory
Problem: A batch contains 40 devices of 1.5 kg and 20 of 2.0 kg. Find total mass.
Model / Approach: Use the supplied groups; composition need not be identical.
Step 1: First group = 40 × 1.5 = 60 kg.
Step 2: Second group = 20 × 2.0 = 40 kg.
Step 3: Total equipment mass = 100 kg.
Step 4: A copper or hazardous-substance inventory requires composition data. Equipment mass alone does not supply a metal grade.
Answer: 100 kg total equipment.
Check and Interpretation: Add masses after multiplying each count by its own unit mass.
9. Hazards and Exposure Pathways
E-waste can contain hazardous constituents and stored energy. Composition, condition and treatment determine the relevant exposure situation. Intact managed equipment, open burning and dusty breaking are very different conditions.

Representative Concerns
Selected equipment or materials can contain lead, mercury, cadmium, certain chromium compounds or problematic additives. Chemical form and concentration matter; not every device contains every constituent. Uncontrolled heating can release contaminated particles and hazardous mixtures rather than only leaving clean metal.
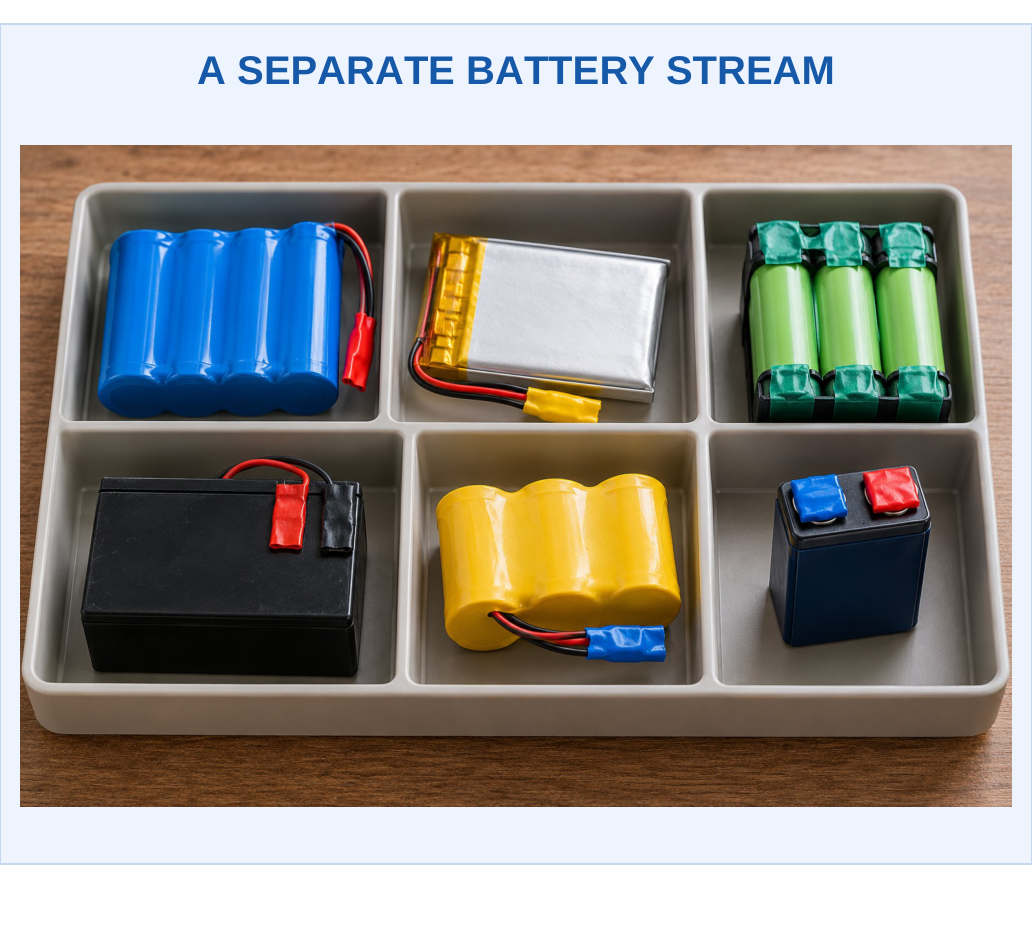
Batteries introduce energy and chemical hazards, especially if damaged or shorted. They need suitable segregation and specialised routes rather than indiscriminate mixing with general metal scrap.
Pathways
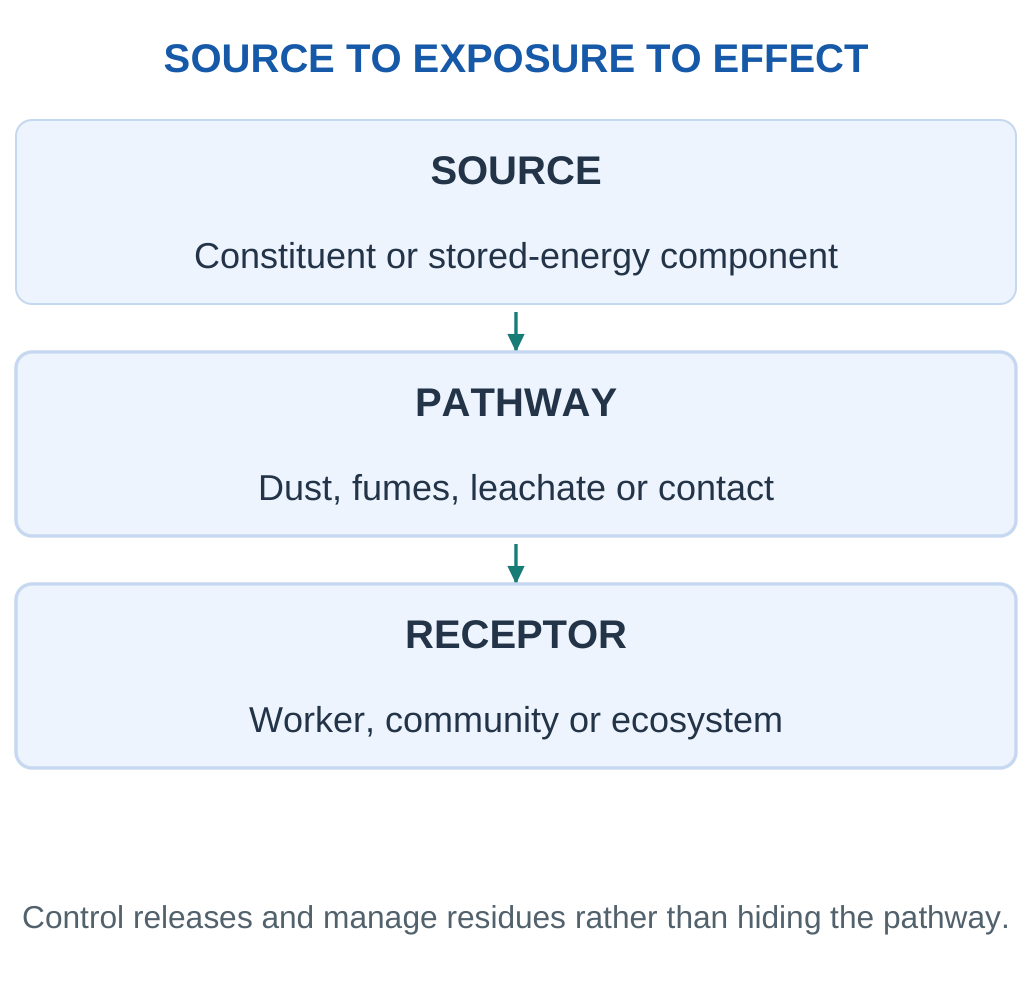
Dust can be inhaled or transferred hand-to-mouth. Fumes and gases can arise during inappropriate heating. Leachate can carry contaminants to soil and water. Workers, communities and ecosystems can receive exposure through different routes.
Interrupt the Pathway
Preserve identity, avoid unnecessary damage, separate designated hazardous fractions, use appropriate enclosed treatment and manage residues. Recovering valuable metal does not justify transferring pollution into air or water.
Accurate Wording: Name a representative source, the treatment condition, the pathway and the receptor. Avoid claiming that every discarded device presents the same risk.
Environmental Release Does Not Stop at Recovery
An informal process may obtain a visible metal fraction while spreading dust or leaving contaminated ash. A valid environmental account includes those outputs. Valuable recovery and pollution control are simultaneous requirements, not alternative objectives.
Chemical Form Matters
Different forms of an element can have different mobility and hazard. A screening result for total element concentration may not identify the specific chemical form restricted or relevant to a process. Use the correct analyte definition and appropriate evidence before drawing a conclusion.
Control Hierarchy in the Process
Avoid unnecessary hazardous operations, contain suitable treatment, separate incompatible or special streams and manage residues. Appropriate training and hygiene complement engineering design. A complete answer connects a measure to the source or pathway it interrupts.
The Process Can Change the Exposure Situation
An intact component can retain a constituent within its construction. Breaking, heating or inappropriate chemical treatment can create pathways that were limited during normal service. This is why end-of-life treatment must be assessed separately from ordinary product use.
Metals and Chemical Forms
An element’s name does not describe every compound, oxidation state or exposure behaviour. Analytical questions should identify whether they concern total content, a particular species or a leachable fraction. Those measurements are not interchangeable. A correct explanation ties the reported quantity to the actual pathway being considered.
Residues Can Concentrate a Concern
Separation can move a constituent into a smaller output stream. That may improve manageability but does not eliminate the substance. A metal-rich concentrate, contaminated dust or process liquid can require appropriate controls even when its total mass is small.
A Cause-and-Pathway Answer
The source is a constituent or stored-energy part. An operation can release dust, fumes, liquid or direct-contact contamination. A worker, community or ecosystem receives exposure through an identified route. Prevention, containment and suitable treatment interrupt stages of that chain. Recovering a valuable fraction is not evidence that the remaining pathways were controlled.
10. Collection, Triage and Preparation for Reuse
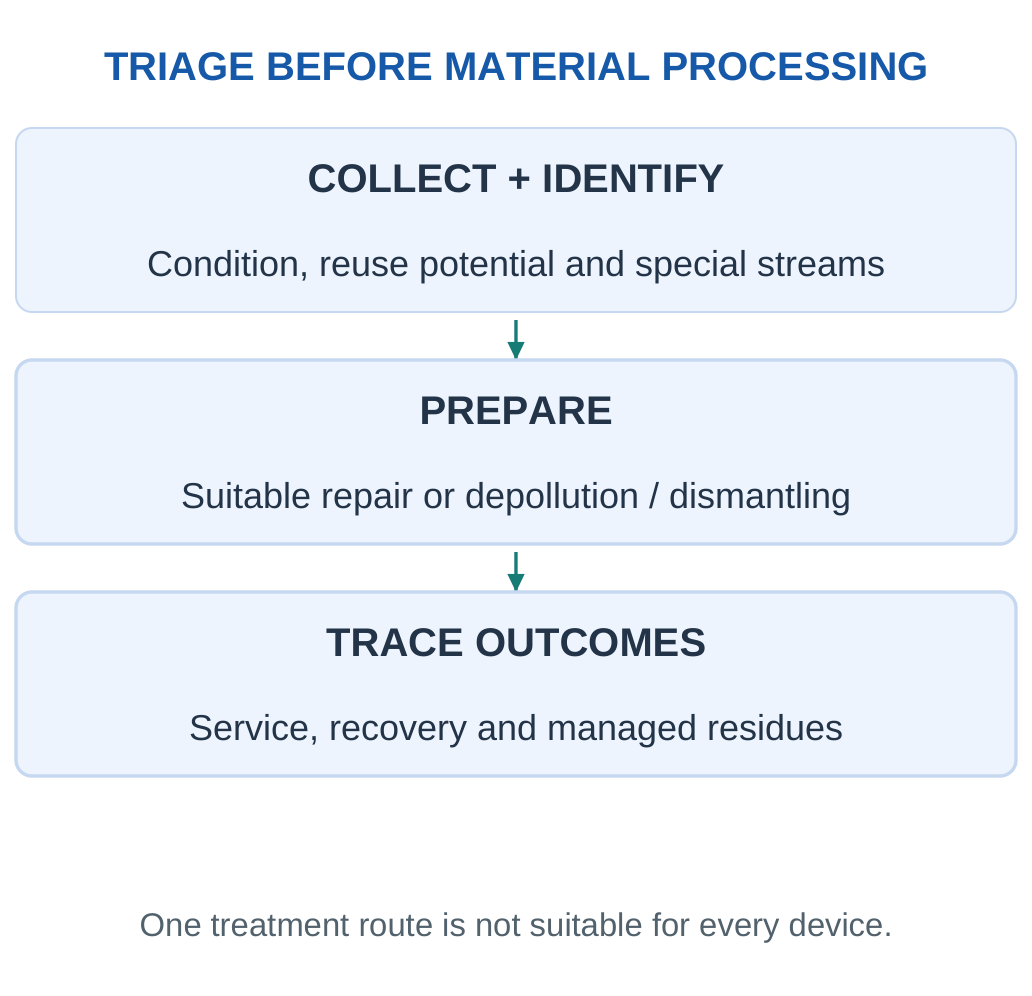
A managed system begins before size reduction. Collection should preserve equipment identity and condition so that reuse potential and special treatment needs can be recognised.
Key Point: Reuse Needs Suitability
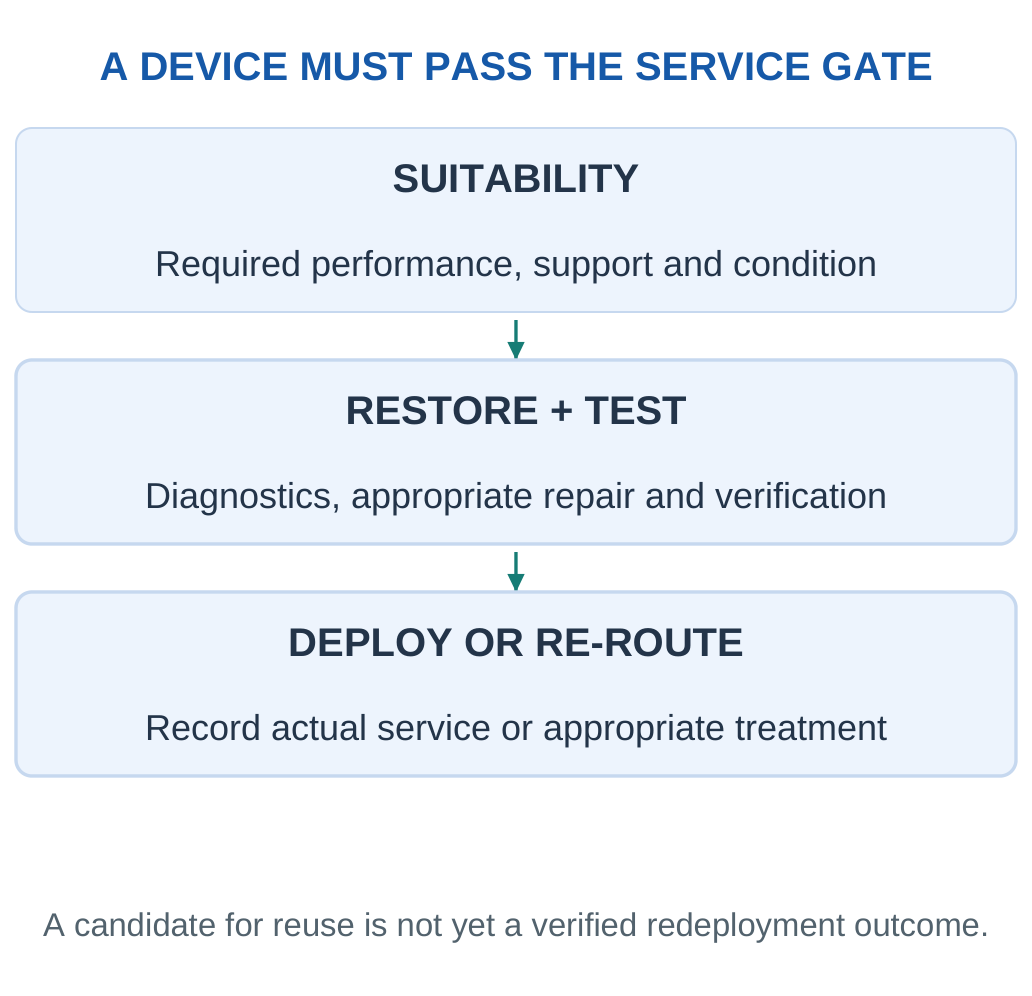
Repair and refurbishment preserve useful function only when condition, support and performance meet the intended service. Testing and appropriate information/data handling are part of a valid redeployment outcome.

Triage Routes
Continued Use: Equipment that remains suitable can deliver more service without material reprocessing.
Repair/Refurbishment: Diagnostics, appropriate part replacement and testing can restore useful function. Cosmetic cleaning alone is not refurbishment evidence.
Material Recovery: Unsuitable equipment enters appropriate dismantling and recycling, with specialist fractions handled separately.


Information and Support
Equipment condition, test results, identity and destination should remain traceable. Personal or institutional data requires appropriate handling before redeployment or transfer. Continued software support and required performance matter alongside hardware condition.
Conditional Priority: Repair and reuse often preserve more function than immediate shredding, but the equipment must meet its intended service and safety requirements. Remaining life and use-phase energy can change the comparison.
Reuse Protects Embedded Effort
A working board embodies material extraction, high-purity processing, assembly and testing. Preserving its function can avoid repeating those stages. That benefit depends on remaining service and suitability; a restored device still needs to perform the intended task.

A Collection Programme Needs an Endpoint
Clear acceptance rules, safe storage, recordkeeping and appropriate downstream partners matter. Track whether equipment was actually redeployed, treated or held in inventory. Counting the same stored item again each year can inflate a programme’s apparent outcome.
Collection Design Influences Treatment Quality
Keeping equipment identifiable and limiting avoidable damage helps preserve reuse opportunities and recognise special components. Mixing unsuitable streams can create safety and quality problems before treatment starts. Clear acceptance rules and storage categories are therefore part of the engineering system.
Preparation for a Second Service Life
A reused device needs a suitable function, condition and support context. Diagnostics identify faults; appropriate repair restores function; testing checks the intended outcome. Data handling protects information during transfer. These steps distinguish a service-ready refurbished device from an untested used object.

Do Not Confuse Intention with Outcome
Equipment labelled for reuse may remain in storage or fail to be deployed. Report verified redeployment separately from candidates awaiting work. Similarly, equipment transferred to treatment is not automatically material recovered. A programme ledger should follow actual outcomes and retained inventory.
Decision Under Uncertainty
When condition or support is unclear, assessment is needed before assigning a route. A simple age limit can be a planning rule but does not replace actual suitability. Some older devices can continue useful service, while some newer ones may be uneconomic or unsuitable to restore under the defined requirements.
Worked Example 5.17: Reuse-First Triage
Problem: Of 100 laptops, 30 are directly suitable, 40 are repair candidates and 30 require material recovery. If 75% of repairs pass, find outcomes.
Model / Approach: Failed repair candidates join recovery; no double count.
Step 1: Successful repairs = 40 × 0.75 = 30.
Step 2: Return to service = 30 + 30 = 60.
Step 3: Failed repairs = 10; recovery count = 30 + 10 = 40.
Step 4: All 100 devices are accounted for. Service suitability and testing are part of the reuse decision, not just appearance.
Answer: 60 return to service; 40 enter material recovery.
Check and Interpretation: 60 + 40 = 100 devices.
Worked Example 5.18: A Period Ledger with Stored Equipment
Problem: A programme starts with 200 kg stored equipment, collects 900 kg during the year and transfers 950 kg to documented routes. Find closing stock and explain why transfer can exceed current collection.
Model / Approach: Same equipment boundary and mass basis; no other inflow or outflow is present. Transfers include equipment previously stored.
Step 1: Available mass = Opening stock + Collection = 200 + 900 = 1100 kg.
Step 2: Closing stock = 1100 − 950 = 150 kg.
The ledger closes as:
200 + 900 = 950 + 150
Step 3: The 950 kg transferred exceeds the 900 kg newly collected because some opening stock was processed. This is not a recovery above 100% and does not imply mass creation.
Step 4: Collection, storage and treatment transfer describe different stages. A downstream recovered-metal percentage would require target composition and treatment outputs, not just this equipment ledger.
Answer: Closing stock 150 kg; transfer used some previously stored equipment.
Check and Interpretation: Period flows need an opening inventory before they are compared.
11. Depollution, Dismantling and Special Fractions
Depollution removes or manages designated hazardous substances, mixtures or components through suitable operations. Dismantling separates assemblies to preserve useful modules, isolate special streams and improve later recovery. Neither term means final metal refining.

Why Early Separation Helps
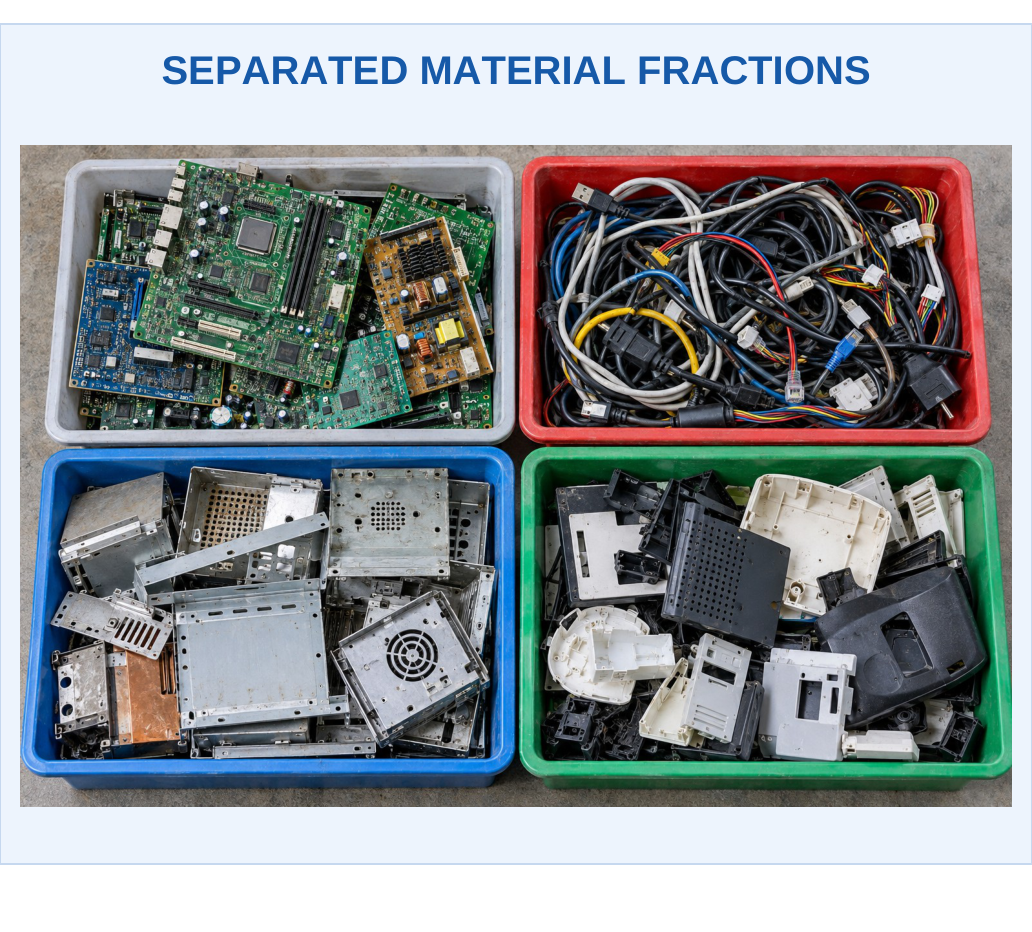
A steel housing and a metal-rich board fraction have different recovery routes. Mixing them can dilute a useful concentrate. Removing a reusable module preserves more function than reducing it to fragments.
Battery Streams
Battery-containing equipment requires identification and suitable trained handling. Intact collected packs and damaged or suspect units can require different arrangements. The conceptual sequence is not a universal disassembly procedure for every battery design.
Key Point: Missing Mass Needs Investigation
An unclosed ledger can reflect measurement error, inventory retention or an omitted stream. Do not silently classify an unexplained difference as harmless loss.

Trace Every Output
Record main fractions and their destinations. An account that includes valuable metal but omits contaminated residue is incomplete. Investigate unaccounted mass instead of silently calling it harmless loss.
Different Roles: Dismantling improves access and fraction quality; depollution addresses designated hazards; separation enriches streams; refining produces a specified material quality.
Dismantling Can Improve Both Safety and Grade
Removing designated special components before general processing can reduce incompatible feeds and improve material separation. Separating a high-value board fraction avoids dilution into a large mixed stream. The exact sequence depends on equipment, chemistry and facility capability.
Balance Identity and Throughput
Manual sorting can preserve detailed information but requires time and suitable conditions. Mechanical lines process larger flows but need controlled preparation and appropriate feed acceptance. Neither approach removes the need to understand the incoming equipment.
Output Discipline: Record useful modules, metal-rich fractions, plastics, designated hazardous streams, residue and retained inventory. An unrecorded output is a gap in the process account.
Separate by Purpose
Dismantling can recover a reusable module, improve the grade of a material stream or isolate a component needing specialist treatment. The same physical separation can serve more than one purpose, but its outcome should be stated. Removing a battery is not the same operation as refining its metals.
Equipment-Dependent Sequencing
A process should identify relevant hazards and components before choosing its operations. Product construction, stored energy and materials influence the route. An introductory flowchart is a conceptual order, not a universal set of manual instructions for opening every device.
What the Mass Ledger Includes
Useful modules, metal-rich fractions, plastics, designated special fractions, dust/residue and inventory changes all belong in the account. Some streams may be measured separately because they follow different treatment routes. Their small quantity does not make them optional.
Why Traceability Has Value
A destination record connects a fraction with a suitable downstream operation. It also supports investigation when recovery is unexpectedly poor or a balance does not close. A receipt proves a transfer under its stated information; it should not be stretched into proof of every downstream outcome.
Explain the Sequence: Identify → prepare → separate → route → verify. Each verb has a distinct material or information function.
Worked Example 5.19: Find Missing Mass
Problem: A 100 kg batch gives 35 kg metals, 25 kg boards, 30 kg plastics and 8 kg special fractions. Find unaccounted mass.
Model / Approach: Disjoint outputs; no added material or stated inventory change.
Step 1: Listed output = 35 + 25 + 30 + 8 = 98 kg.
Step 2: Difference = 100 − 98 = 2 kg.
Step 3: Unaccounted fraction = 2%.
Step 4: Investigate measurement, inventory or omitted streams. Do not silently label the difference harmless process loss.
Answer: 2 kg, or 2%, unaccounted.
Check and Interpretation: A complete ledger includes residuals and retained inventory.
12. Mechanical Treatment and Physical Separation
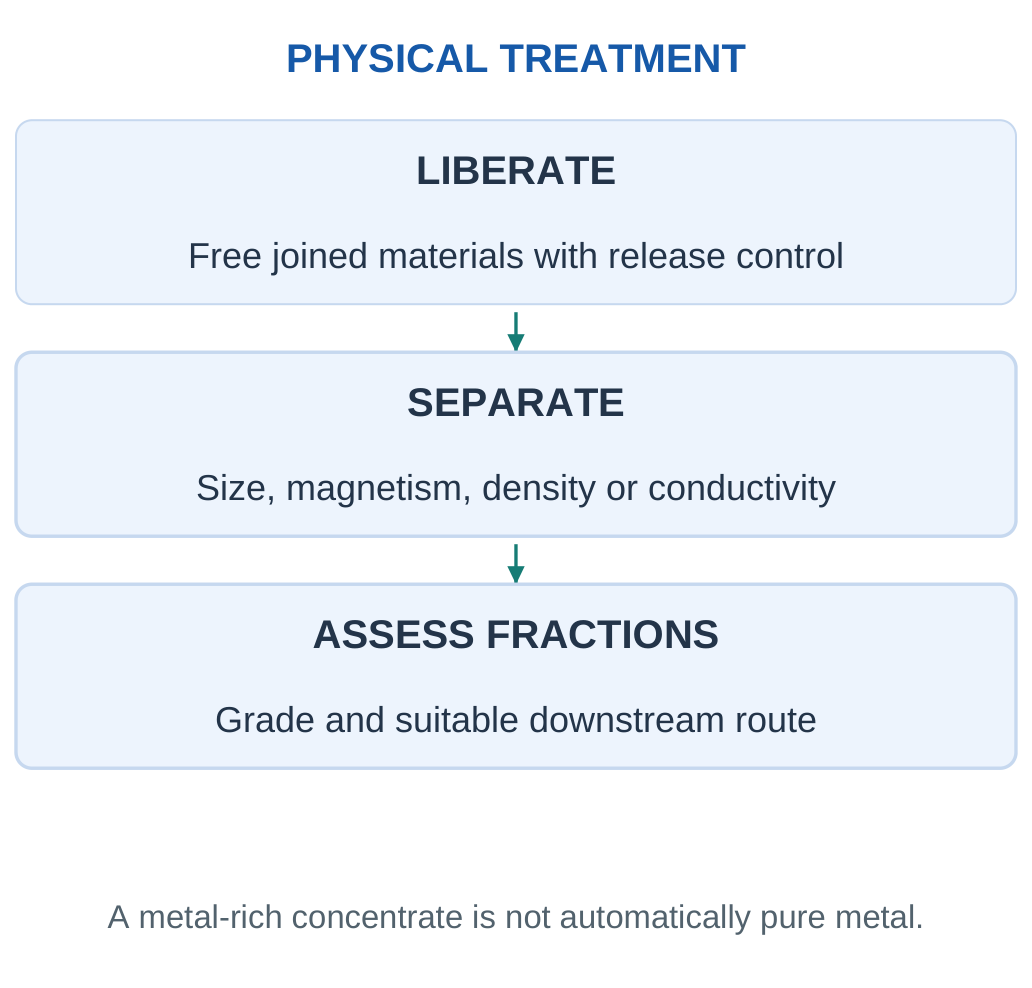
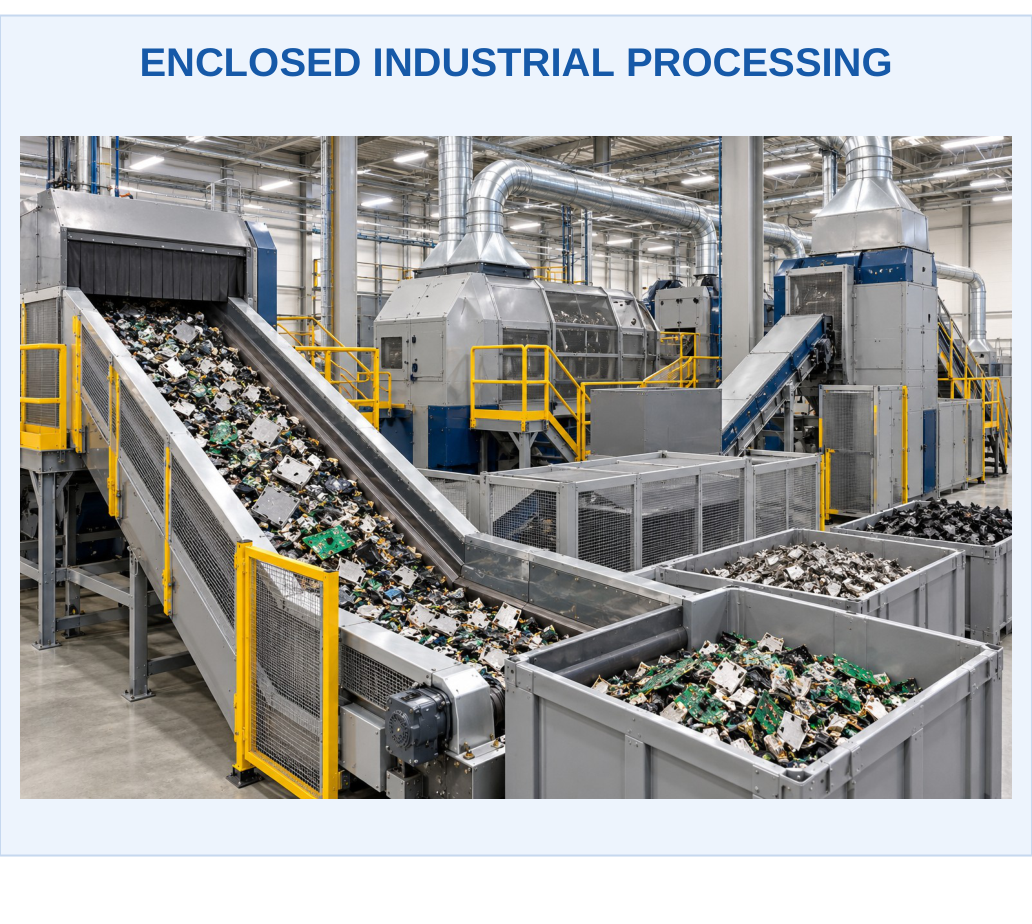
Mechanical treatment can liberate joined materials and sort them using physical differences. Size reduction must be integrated with depollution, dust control and suitable equipment. A shredder alone is not a complete recycling system.

Separation Principles
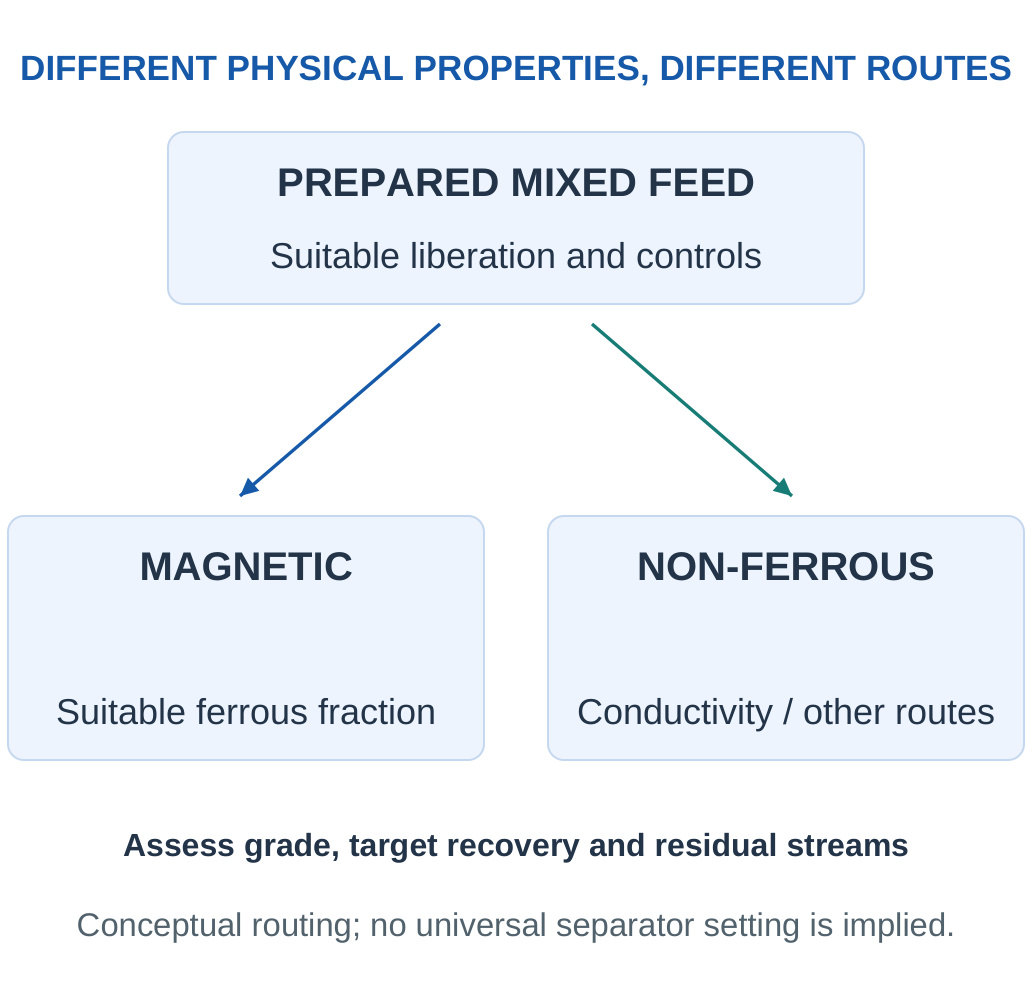
Screening: Divides by size. Size alone does not identify composition, but classification can improve later processing.
Magnetic Separation: Uses magnetic response to recover suitable ferrous fractions. Copper and aluminium do not behave like ordinary ferromagnetic steel in this step.
Eddy-Current Separation: Changing magnetic fields induce currents in conductive non-ferrous particles, producing forces useful for separation. Shape and operating conditions affect performance.
Density/Electrostatic Methods: Use appropriate density, conductivity or charging differences after preparation. Moisture and liberation influence the result.

Recovery Versus Grade
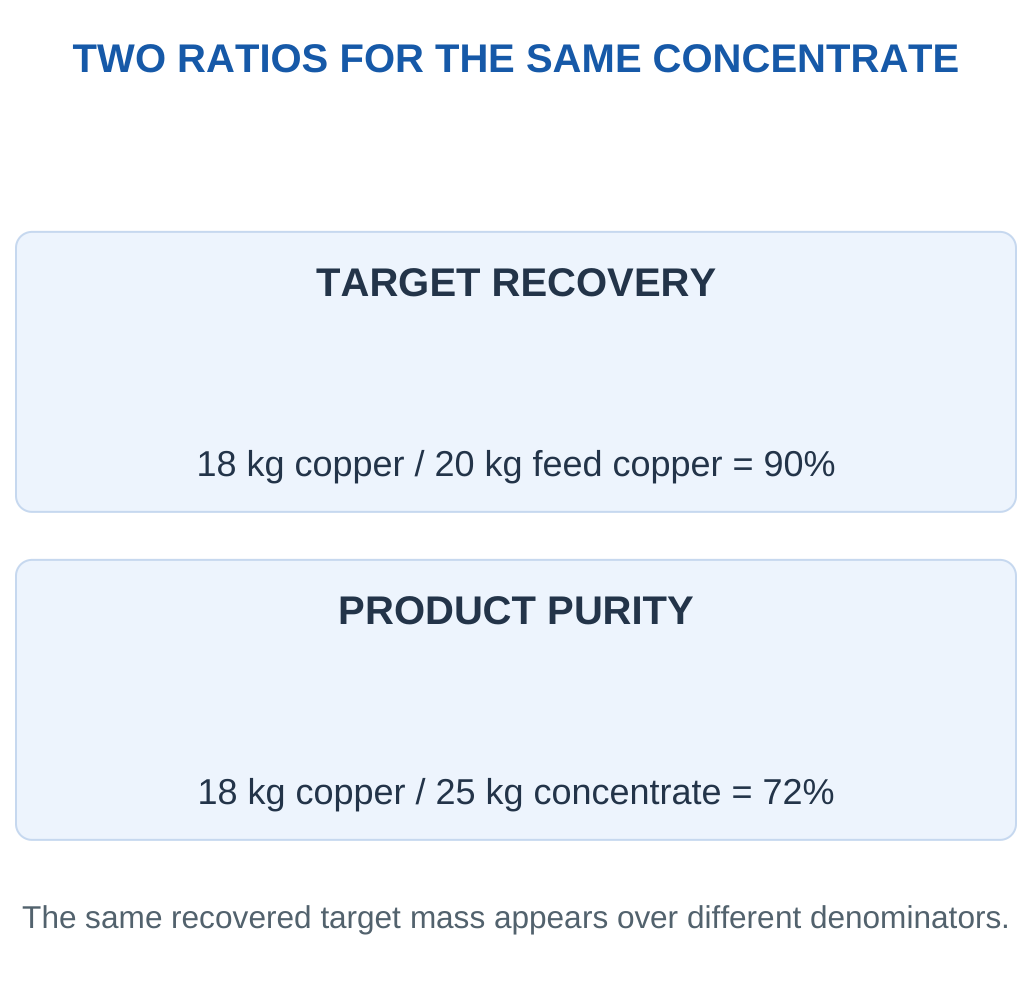
A separator can capture much of the target while also collecting impurities. High recovery can coexist with low concentrate purity. A cleaner concentrate can sacrifice some target to another stream. Report both when evaluating the process.
Diagram Sequence: Collection → depollution → liberation → separation → metal-rich and other fractions → suitable recovery/residue management.
Liberation Before Separation
A particle containing bonded metal and polymer can behave differently from either pure material. More liberation can improve separation, but excessive size reduction can create fine dust, lose valuable material to a difficult fraction and increase energy demand. The preparation target should match downstream equipment.
Key Point: Liberation Influences Separation
A bonded metal-polymer particle may follow a different route from either pure material. Too little liberation reduces separation quality; excessive size reduction can create fines, energy demand and difficult residual fractions.

Evaluate Both Captured and Rejected Streams
High target capture can bring many impurities into a concentrate. Increasing purity can divert some target elsewhere. A complete comparison follows target inventories in all outputs rather than reporting only the most attractive stream. Moisture, particle shape and operating settings can change the result.
Liberation and Particle Size
A mixed fragment can contain metal, polymer and glass together. Its response in a separator can differ from that of a fully liberated metal particle. More size reduction can improve liberation but also create fines, energy demand and difficult dust fractions. The target is suitable liberation, not the smallest possible particle size.
Magnetic and Conductive Responses
Magnetic separation uses suitable magnetic response. Eddy-current separation uses induced currents and resulting forces in conductive particles. These are different mechanisms. Calling all metals magnetic would misdescribe copper and aluminium routing.
Recovery-Grade Trade-Off
A separator adjusted to collect more target can also capture more non-target material. The concentrate recovery rises while grade can fall. A stricter selection may improve grade but leave target in another stream. The best operating choice depends on downstream processing and the value of recovering the remaining target.

Representative Sampling
A concentrate assay must represent the stream. Large composition differences between pieces can make a small arbitrary sample misleading. State the supplied representative grade in an examination problem; in a real process, sampling and characterisation are part of the evidence needed for that grade.
Worked Example 5.20: Recovery and Grade in One Separator
Problem: Feed contains 20 kg copper. A 25 kg concentrate contains 18 kg copper. Find recovery and purity.
Model / Approach: Same batch and copper target throughout.
Step 1: Copper recovery = 18/20 × 100 = 90%.
Step 2: Product purity = 18/25 × 100 = 72%.
Step 3: Concentrate non-copper mass = 25 − 18 = 7 kg.
Step 4: The separator captures much of the target while still producing an impure concentrate. Both metrics matter.
Answer: 90% recovery; 72% purity.
Check and Interpretation: Feed target and total concentrate are different denominators.
Worked Example 5.21: Choose a Separation Setting with Grade and Capture
Problem: Feed contains 50 kg target. Setting A gives 60 kg concentrate containing 45 kg target. Setting B gives 45 kg concentrate containing 40.5 kg target. Compare recovery and purity.
Model / Approach: Each setting treats an equivalent feed. The selected concentrate is the useful output; other streams remain accounted separately.
Step 1: Setting A
Recovery = 45/50 × 100 = 90%
Purity = 45/60 × 100 = 75%
It captures more target but also carries 15 kg non-target material.
Step 2: Setting B
Recovery = 40.5/50 × 100 = 81%
Purity = 40.5/45 × 100 = 90%
It captures less target but provides a cleaner concentrate.
Step 3: No universal winner follows from one number. A downstream process may favour higher grade; another may value additional capture and can handle the impurities.
Step 4: Compare downstream inputs, product requirement and the opportunity to recover target from other streams. The material not in the concentrate has not disappeared and may affect the total route.
Answer: A: 90% recovery, 75% purity. B: 81% recovery, 90% purity.
Check and Interpretation: Recovery and purity use different denominators, so a trade-off is mathematically possible.
13. Valuable Metals and Industrial Recovery
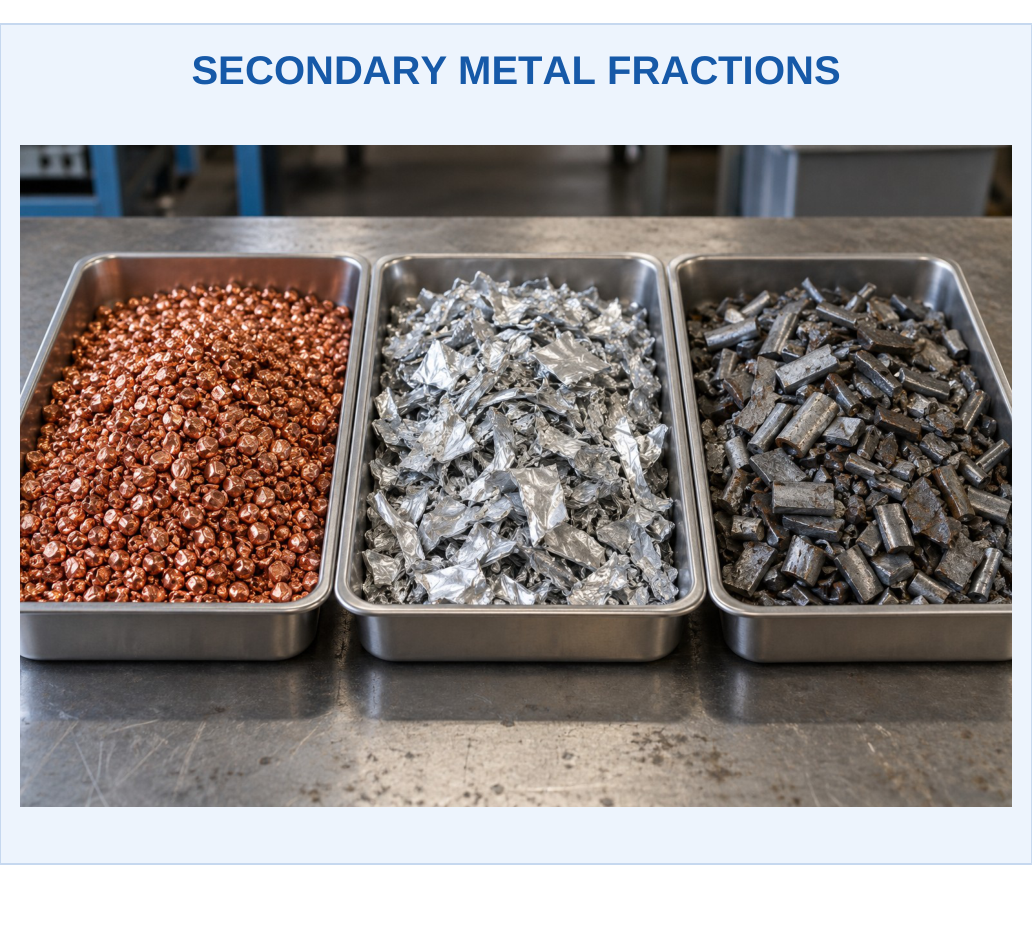
Copper, aluminium, steel and smaller amounts of precious or other useful metals can contribute value to electronic waste streams. Actual feed grade, contamination, recoverability and required product quality determine the route. Precious-metal content alone does not establish environmental or economic suitability.

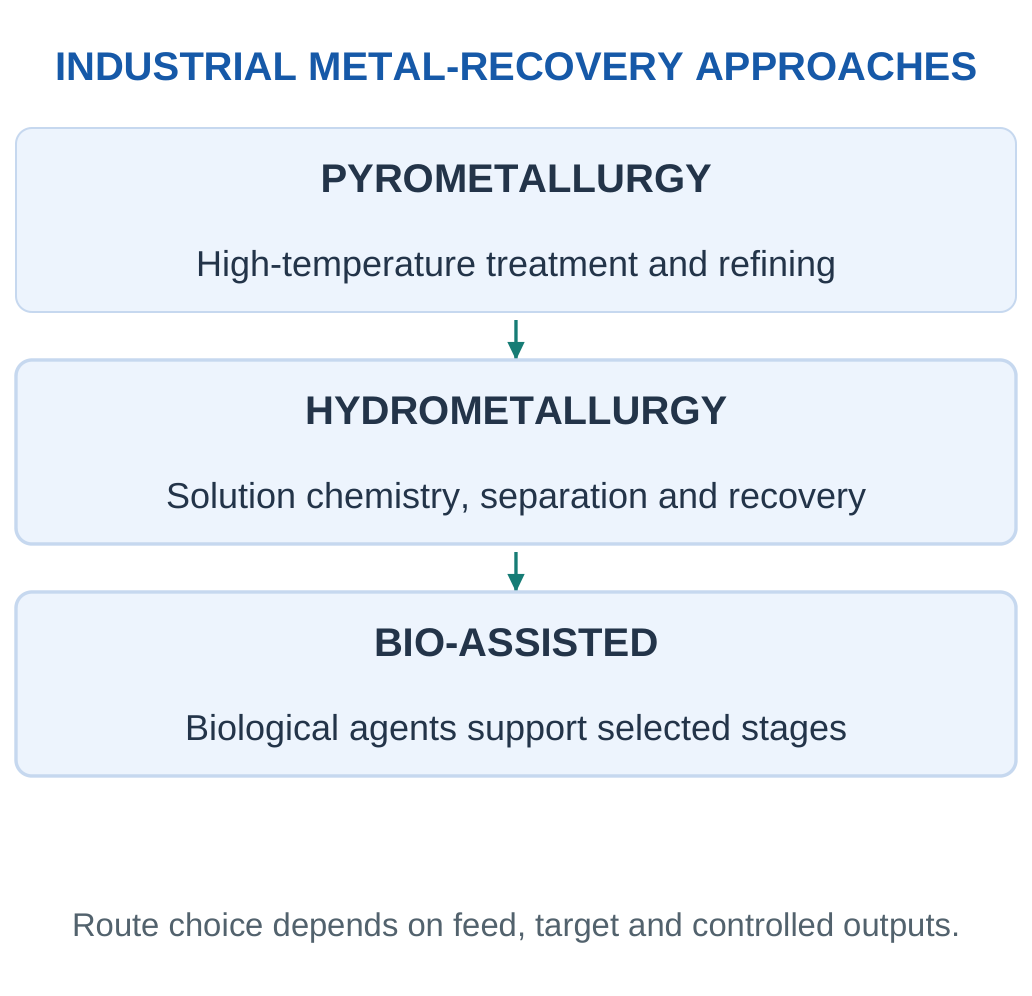
Pyrometallurgy
High-temperature treatment can collect selected metals into a metal or intermediate phase, followed by refining. Energy, feed preparation, emissions and slag or other residues matter. It does not recover every element automatically.
Hydrometallurgy
Controlled solution chemistry transfers selected metals into liquid, followed by separation and recovery. Reagent consumption, selectivity, water, solution purification and residual solids require management. This is an industrial concept, not an uncontrolled acid-treatment recipe.
Bio-Assisted Approaches
Biological agents can support suitable extraction chemistry. Rate, feed tolerance, selectivity and downstream recovery determine feasibility. Biological assistance does not eliminate metal-bearing solutions or residue-management needs.
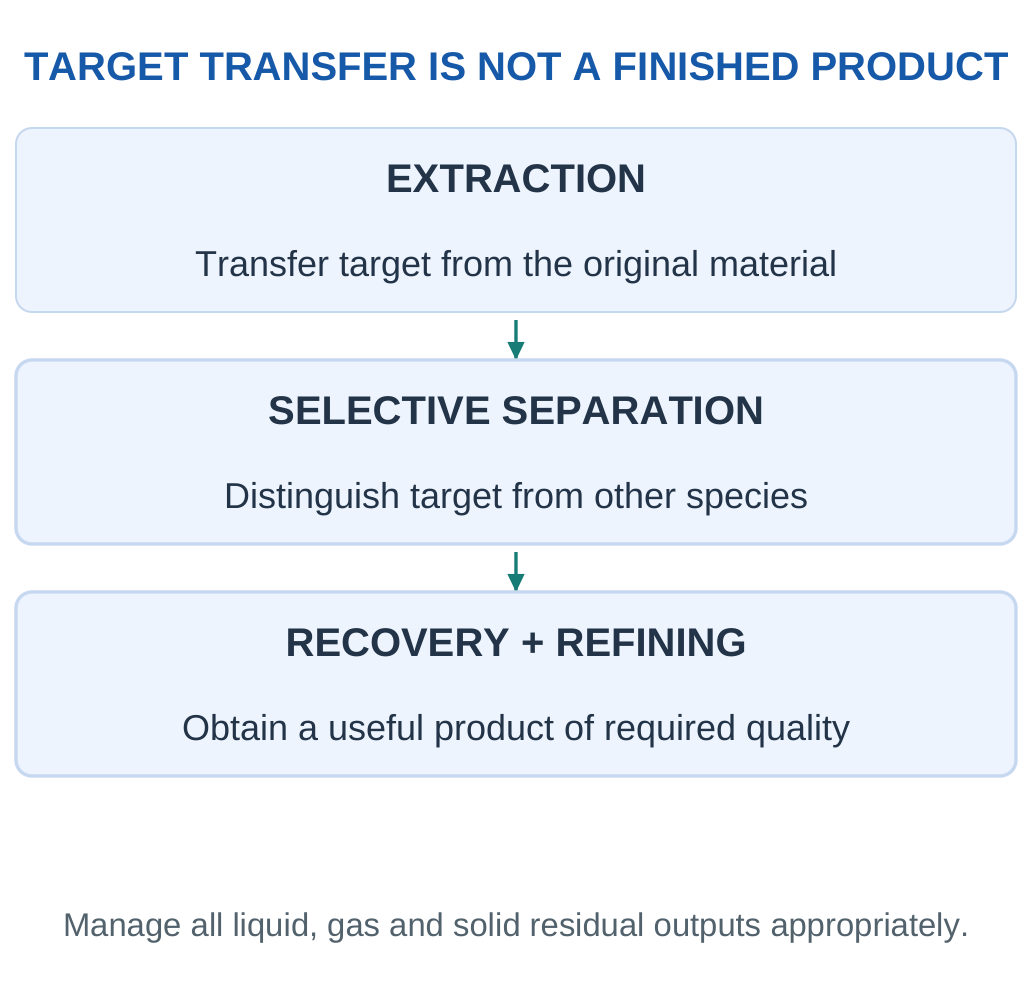
Key Point: Extraction Is an Intermediate Step
Transferring a metal into a liquid or intermediate phase does not make it a finished usable product. Selective separation, recovery, refining and residual management complete the route.

Stage Distinction: Extraction transfers a target; separation distinguishes species; recovery produces a useful output; refining improves quality. Dissolved metal is not necessarily a finished reusable product.
Routes Are Often Combined
A plant can prepare a metal-rich feed physically and then use a thermal or solution route, followed by refining. Choosing a process family does not remove the need for separation at other stages. Product specifications determine how far purification must continue.
Pollution Control Is Part of the Route
Thermal operations require control of emissions and solid residues. Solution operations require management of reagents, metal-bearing liquids and residual solids. Bio-assisted extraction still creates streams needing recovery and management. Compare the complete route rather than calling one family clean solely because its operating temperature is lower.

Why an Enriched Feed Helps
Physical preparation can remove some material that would otherwise consume energy or reagents downstream. It can also create a feed more suited to a particular recovery route. Preparation does not need to produce pure metal to be useful; it needs a suitable composition and physical form for the next stage.
Target Transfer and Product Recovery
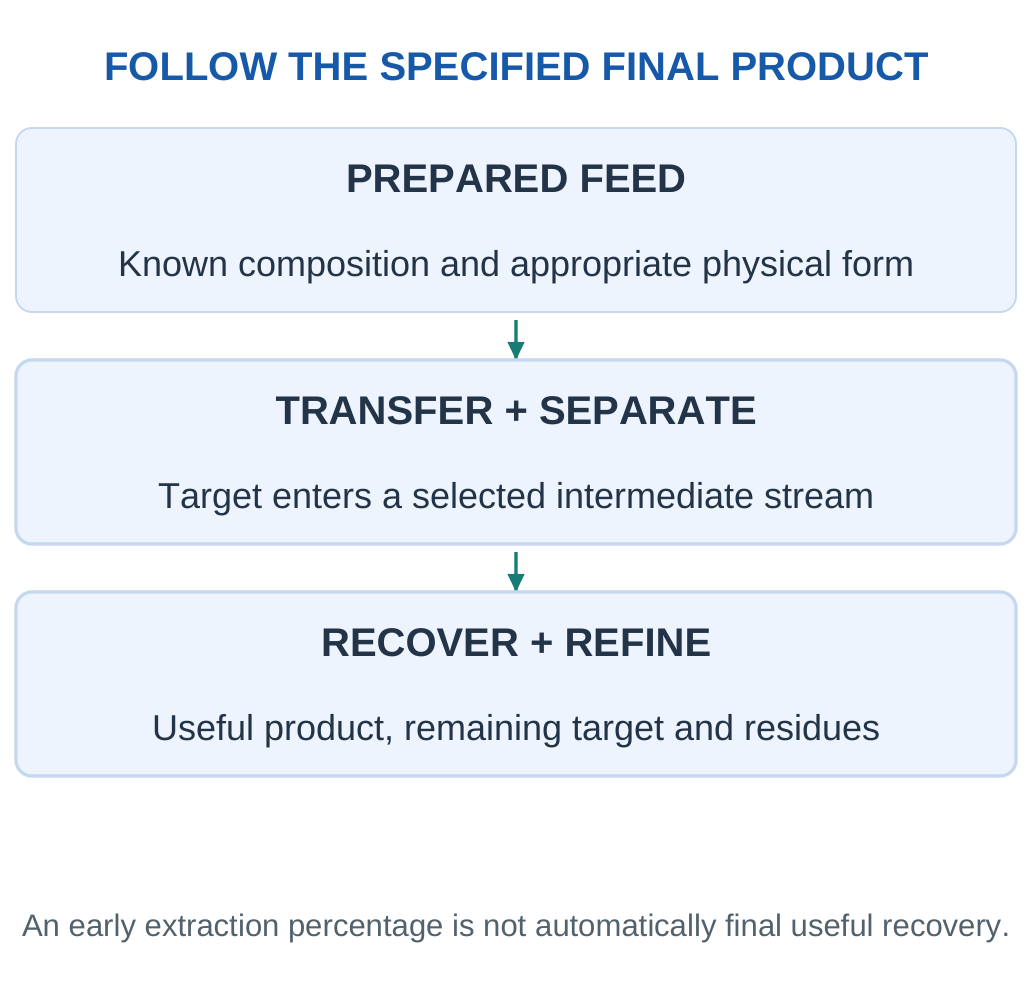
A route can move a target from a solid into a liquid or intermediate phase. Selective separation then distinguishes it from other species, and recovery/refining produces an output of useful quality. Each stage can lose target to a different stream. Following only the first extraction percentage overstates final useful recovery.
Compare Routes with the Same Output Requirement
A crude intermediate and a refined metal are not equivalent products. Compare energy, reagent demand, target capture and residues for the same required quality and boundary. A low-temperature process may still require substantial chemical processing; a thermal route may rely on feed preparation and controlled refining.

Biological Assistance in Context
Biological agents can influence suitable extraction chemistry, but rates and feed tolerance matter. The process still needs control of metal-bearing liquids and residual solids. The biological origin of an agent does not make all resulting streams benign.
Worked Example 5.22: Metal Inventory from Grade
Problem: A 200 kg fraction has supplied copper grade 18%. Find target inventory.
Model / Approach: Representative supplied grade, not a universal board composition.
Step 1: Convert 18% to 0.18.
Step 2: Inventory = Feed × Grade.
Step 3: Copper = 200 × 0.18 = 36 kg.
Step 4: This is target in feed before losses. Final recovered mass and product quality require additional data.
Answer: 36 kg initial copper.
Check and Interpretation: Recovery cannot exceed this inventory without another input or inconsistency.
14. Recovery, Purity and Mass Balance
Let feed mass be F and target mass fraction x.
Initial target inventory, M₀ = Fx
With target recovery r:
Useful recovered target, M = Fxr

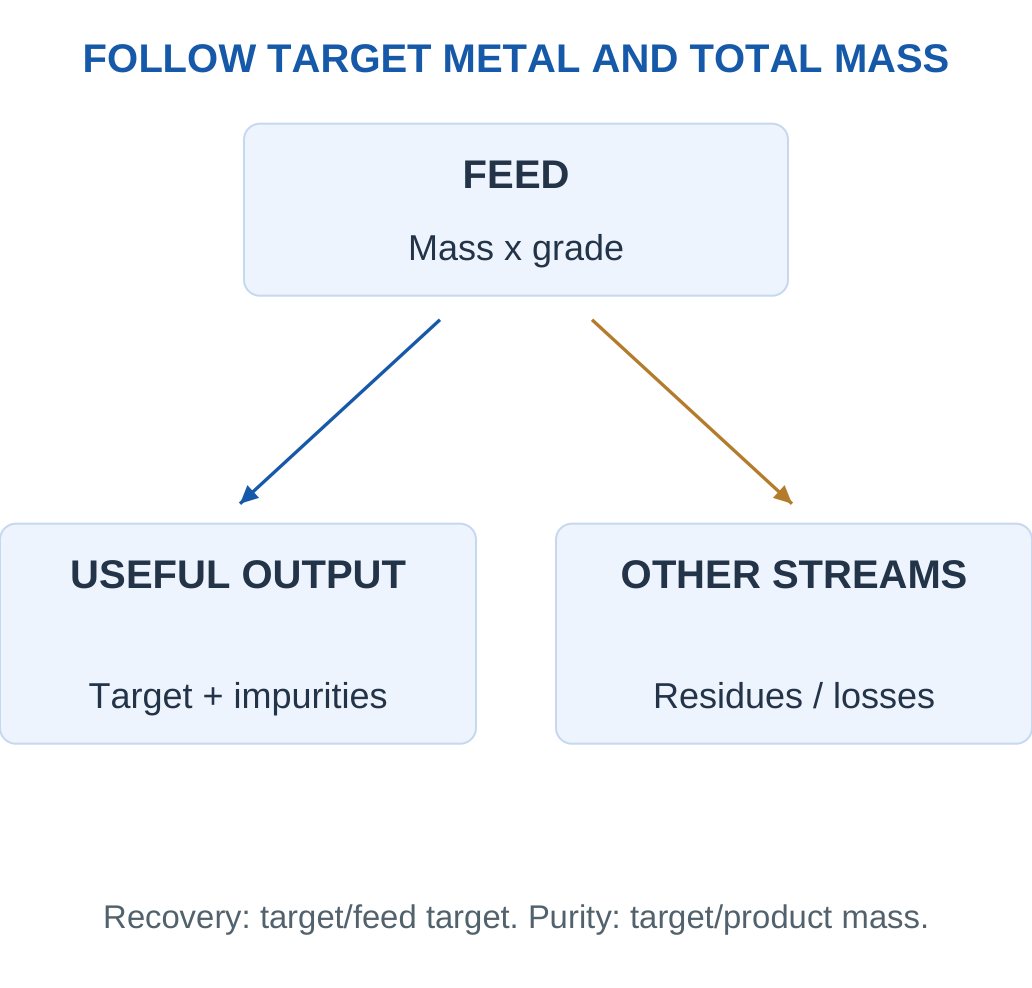
Recovery = Target in useful output / Target in feed
Purity = Target in product / Total product mass
If recovered target mass is M and purity is p:
Total product mass = M/p
Sequential Stages
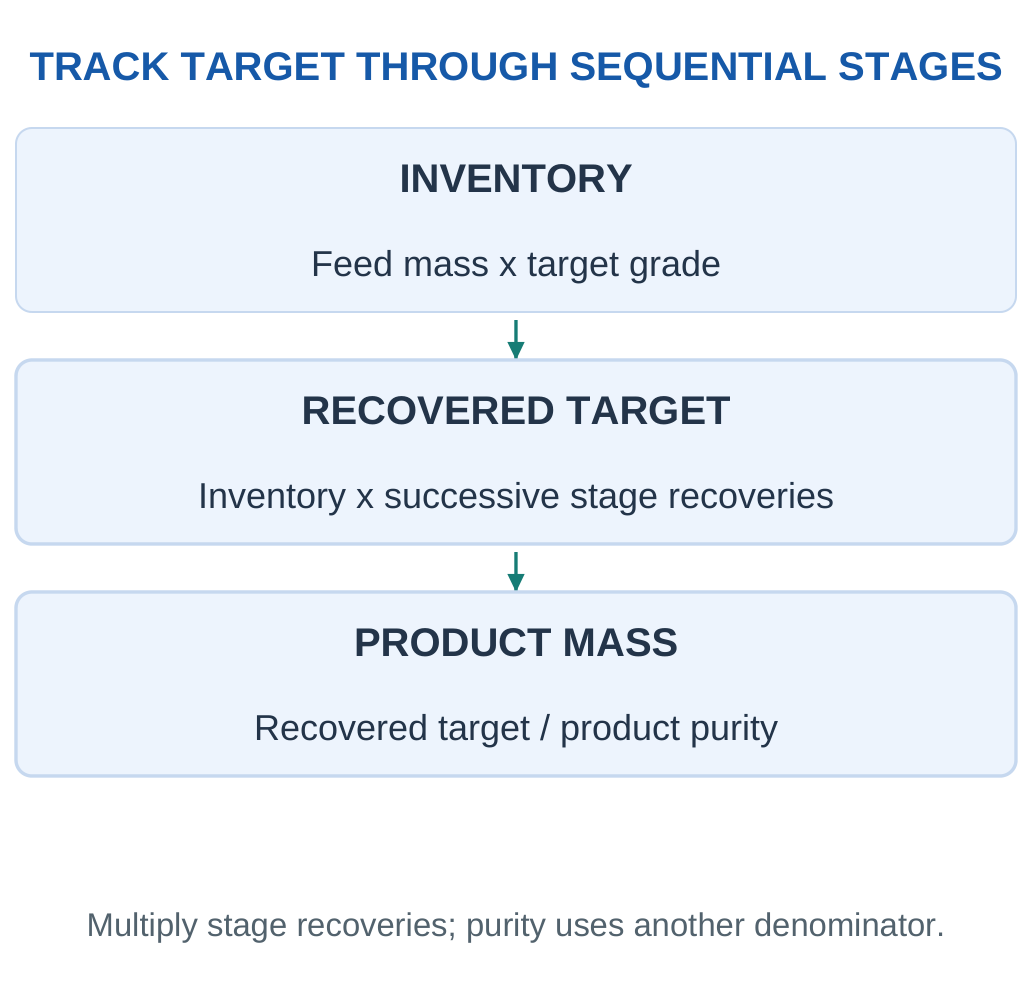
When each stage recovers a fraction of the target entering that stage:
Overall recovery = r₁r₂…
Two 80% stages give:
0.80 × 0.80 = 64% overall recovery
Adding percentages would use the wrong basis.
Key Point: Recovery Uses Target Inventory
The denominator is target metal in feed. Purity instead uses total product mass. A high-recovery concentrate can still contain many impurities.
Key Point: Grade Is a Composition
A concentrate grade describes target mass per total concentrate mass. A recovery describes target capture from feed. Improving one can change the other, so report both before deciding whether a separation performed well. Neither ratio alone identifies the hazard of the residue.

Close the Ledger
If feed contains 20 kg copper and useful output contains 18 kg, 2 kg remains in other outputs unless another input or inventory change is specified. The target does not vanish. It may remain in residues requiring further recovery or controlled management.
Three-Line Method: Feed target → recovered target → target elsewhere. Calculate total product mass from purity only when asked. A recovery percentage is not a product-grade percentage.
A Target Ledger and a Total-Mass Ledger
The target ledger follows one chosen metal. The total-mass ledger follows all material in each stream. Product purity connects them: target mass is one part of total product. Both ledgers are useful, but their denominators must not be exchanged.
Inlet Basis for Stage Recovery
A 90% stage recovery means 90% of target entering that stage reaches its selected useful output. If only part of original target reached the stage, the result is less than 90% of original feed. Multiplication preserves this sequence. An overall percentage supplied directly may already include several stages and should not be multiplied by them again.
Parallel Streams and Double Counting
Two disjoint recovered streams can be added when both are expressed as actual target masses on the same original-feed account. Two percentages cannot be added merely because both contain the word recovery. Identify which stream each describes and whether their targets overlap.
Residual Target
Unrecovered target can remain in residue, another concentrate, liquid or retained inventory. A closed calculation assigns the remainder to accounted outputs rather than allowing it to disappear. Further processing may be possible, but that is another stage with its own inputs and burdens.
Numerical Habit: Write the target inventory at every stage before calculating any final percentage. This makes a wrong denominator visible early.
Worked Example 5.23: Sequential Recovery
Problem: Feed contains 40 kg copper. Stage 1 recovers 90%; stage 2 recovers 80% of its inlet target. Find final target.
Model / Approach: Each stage percentage is relative to that stage inlet.
Step 1: Stage 1 target = 40 × 0.90 = 36 kg.
Step 2: Stage 2 target = 36 × 0.80 = 28.8 kg.
Step 3: Overall recovery = 0.90 × 0.80 = 72%.
Step 4: Target in other outputs totals 40 − 28.8 = 11.2 kg under this closed inventory. It does not vanish.
Answer: 28.8 kg copper; 72% overall recovery.
Check and Interpretation: Do not add sequential percentages.
Worked Example 5.24: Product Mass from Purity
Problem: A useful product contains 18 kg copper at 90% purity. Find product and impurity masses.
Model / Approach: Purity is copper divided by total product.
Step 1: Product mass = Copper mass / Purity.
Step 2: Product mass = 18/0.90 = 20 kg.
Step 3: Other material = 20 − 18 = 2 kg.
Step 4: Recovery cannot be calculated without feed copper inventory, even though purity is now known.
Answer: 20 kg product with 2 kg non-copper material.
Check and Interpretation: 18/20 returns 90% purity.
Worked Example 5.25: Trace Valuable Metal
Problem: A 500 kg feed contains 0.02% target metal. Overall recovery is 85%. Find recovered grams.
Model / Approach: Use the supplied feed grade; no universal composition or market value is implied.
Step 1: Grade fraction = 0.0002.
Step 2: Feed target = 500 × 0.0002 = 0.100 kg = 100 g.
Step 3: Recovered target = 100 × 0.85 = 85 g.
Step 4: Other outputs contain the remaining 15 g target if no inventory change occurs. Total product mass would need purity.
Answer: 85 g recovered target.
Check and Interpretation: Convert percentage and kilograms to grams in separate steps.
Worked Example 5.26: Three Stages and a Final Product Grade
Problem: A 300 kg feed has 20% target metal. Sequential target recoveries are 90%, 80% and 95%. Final product is 96% target. Find recovered target, overall recovery and total product.
Model / Approach: Each recovery refers to its own stage inlet. No other target input or inventory change is present.
Step 1:
Initial target = 300 × 0.20 = 60 kg
After stage 1 = 60 × 0.90 = 54 kg
After stage 2 = 54 × 0.80 = 43.2 kg
Step 2:
Final target = 43.2 × 0.95 = 41.04 kg
Overall target recovery = 41.04/60 = 0.684 = 68.4%
Step 3:
Total product mass = 41.04/0.96 = 42.75 kg
Non-target product material = 42.75 − 41.04 = 1.71 kg
Step 4: Target outside the useful final product is 60 − 41.04 = 18.96 kg across the other accounted streams. Product purity does not replace the recovery calculation.
Answer: 41.04 kg target; 68.4% overall recovery; 42.75 kg total product.
Check and Interpretation: Multiplying the three stage fractions gives 0.684, and 41.04/42.75 returns 96% purity.
15. RoHS: Hazardous-Substance Restrictions
RoHS means Restriction of Hazardous Substances. The EU framework restricts specified substances in covered electrical/electronic equipment. Directive 2011/65/EU, as amended, provides the framework; Directive (EU) 2015/863 added the four listed phthalates.
General Concentration Values
The study material gives the following general values by weight in homogeneous materials, subject to scope provisions and applicable exemptions.
A homogeneous material is uniform in composition or cannot be mechanically separated into different materials. Cable conductor and insulation illustrate distinct materials.
| Restricted Substance / Group | General Maximum |
|---|---|
| Lead, Pb | 0.1% |
| Mercury, Hg | 0.1% |
| Cadmium, Cd | 0.01% |
| Hexavalent chromium, Cr(VI) | 0.1% |
| PBB | 0.1% |
| PBDE | 0.1% |
| DEHP | 0.1% |
| BBP | 0.1% |
| DBP | 0.1% |
| DIBP | 0.1% |
PBB and PBDE are specified brominated compound groups; the last four entries are phthalates. Cr(VI) is not the same quantity as total chromium.
Interpret the Boundary
A small material with excessive concentration cannot be diluted by averaging over the complete device. Documentation, declarations and appropriate analytical evidence support assessment. An exemption must actually apply to the use and period; its existence elsewhere is not a general pass.
Study Point: RoHS concerns product composition. One concentration screen or a lead-free solder label does not establish every requirement for a complete product.
Mass-Fraction Arithmetic
A 0.1% mass fraction equals:
- 0.001 as a fraction
- 1000 ppm
A 0.01% value equals:
- 0.0001 as a fraction
- 100 ppm
Use the homogeneous material mass as denominator. A tiny insulation layer is not averaged with a heavy metal housing.
Composition Versus Verification
A supplier statement, a material declaration and an analytical screen serve different roles. Appropriate evidence must represent the actual material, and screening methods may not distinguish every chemical species. For example, total chromium and hexavalent chromium are different quantities.
Avoid Overclaiming: A numerical result below one substance limit is one part of an assessment. It does not establish the complete scope, documentation, exemptions, other materials or other substances.
Homogeneous Material Is the Key Boundary
A product can contain metal conductors, solder, polymer insulation and other distinct materials. A concentration in one material is not reduced by adding an unrelated heavy part elsewhere. This is the central reason that a whole-device average can give the wrong impression for a homogeneous-material limit.
Substance Identity and Analytical Evidence
A total-element screen does not necessarily identify every regulated chemical species. Hexavalent chromium and total chromium are different quantities. Similarly, a general claim about a polymer does not identify its additive composition. Appropriate evidence must answer the actual substance question for the actual material.
Scope and Exemptions
An applicable exemption is specific to a use and period under the framework. Its existence for one application does not establish permission for all equipment. The teaching table summarises general concentration values; a real assessment also needs relevant scope, documentation and any applicable provisions.

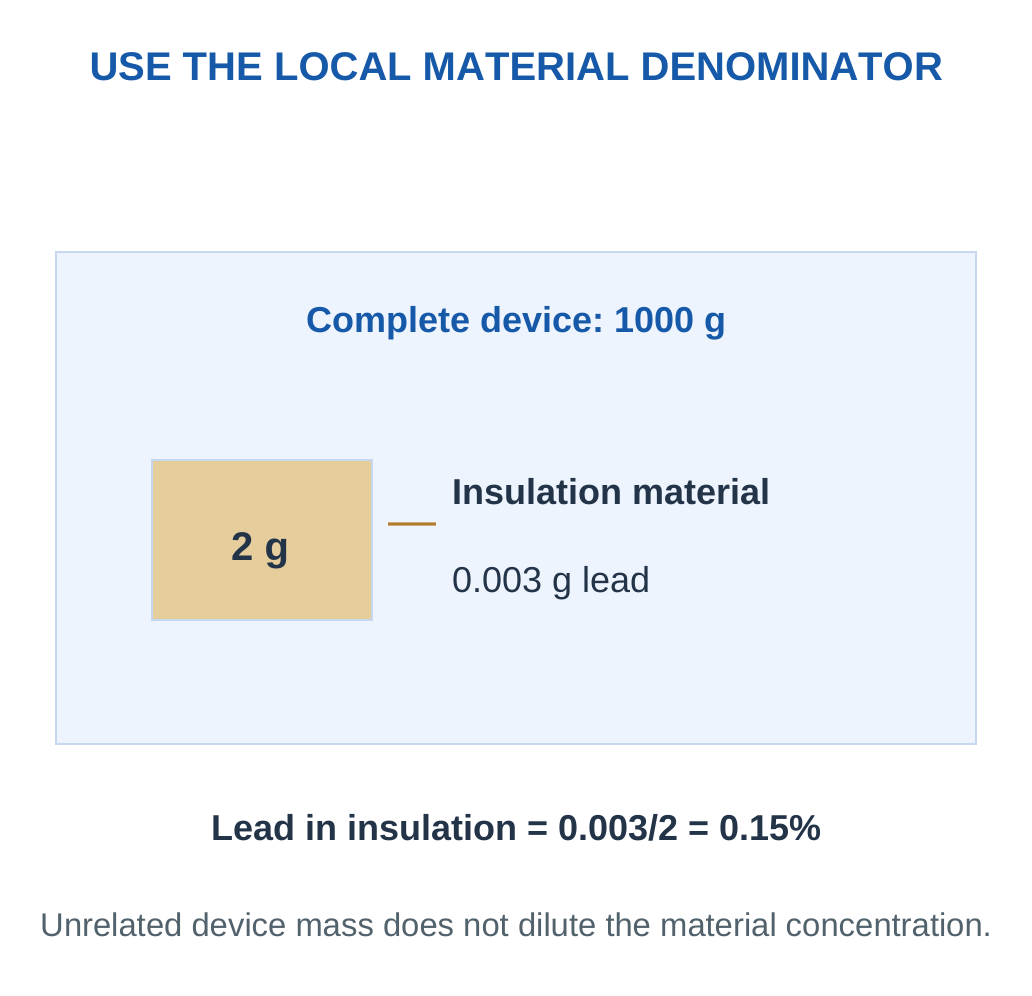
Correct Examination Interpretation
A numerical screen can be below or above a stated limit under its assumptions. That is an arithmetic comparison, not complete certification of the whole product. State the result precisely, then keep other materials and substances as separate questions.
Worked Example 5.27: Percentage to ppm
Problem: A homogeneous material measures 0.08% of a substance with a stated 0.1% limit. Convert and compare.
Model / Approach: Assume valid representative measurement and applicable comparison limit; this is not complete product certification.
Step 1: 0.08% is mass fraction 0.0008.
Step 2: Multiply by 10⁶:
0.0008 × 10⁶ = 800 ppm
Step 3: 0.1% corresponds to 1000 ppm, so the result is below it.
Step 4: Other materials, substances, scope and documentation remain separate checks.
Answer: 800 ppm versus 1000 ppm; below the stated numerical limit.
Check and Interpretation: Percentage number multiplied by 10000 gives ppm by mass.
Worked Example 5.28: Correct Material Denominator
Problem: A 2 g insulation piece contains 0.003 g lead. The whole device is 1000 g. Compare insulation concentration with a stated 0.1% limit.
Model / Approach: Insulation is one homogeneous material; assume no applicable exemption for this example.
Step 1: Use 2 g, not whole-device mass.
Step 2: Fraction = 0.003/2 = 0.0015.
Step 3:
Concentration = 0.15% = 1500 ppm
This is above 1000 ppm.
Step 4: Whole-device averaging would hide the local excess and use the wrong boundary. Full assessment still needs appropriate material evidence.
Answer: 0.15%; exceeds the supplied 0.1% comparison limit.
Check and Interpretation: Unrelated material cannot dilute a homogeneous-material concentration.
16. WEEE and Producer Responsibility
WEEE means Waste Electrical and Electronic Equipment. EU Directive 2012/19/EU addresses prevention and management of this waste stream, including separate collection, treatment, recovery and producer responsibility.

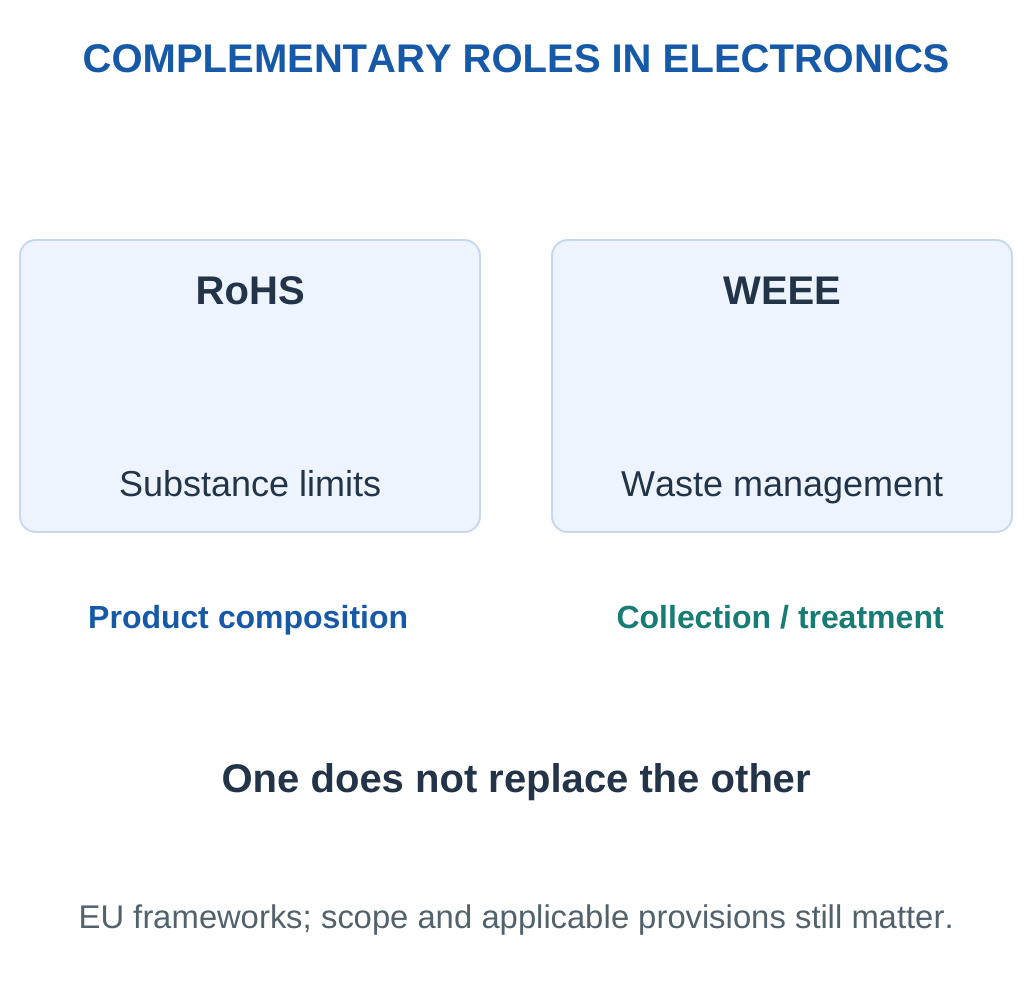
Core Ideas
Separate Collection: Keep equipment in suitable collection routes rather than unsorted municipal waste.
Appropriate Treatment: Use suitable operations and designated selective treatment. Collection is not the final recovery outcome.
Producer Responsibility: Relevant financing and organisational duties connect equipment supply with end-of-life management through applicable implementation.

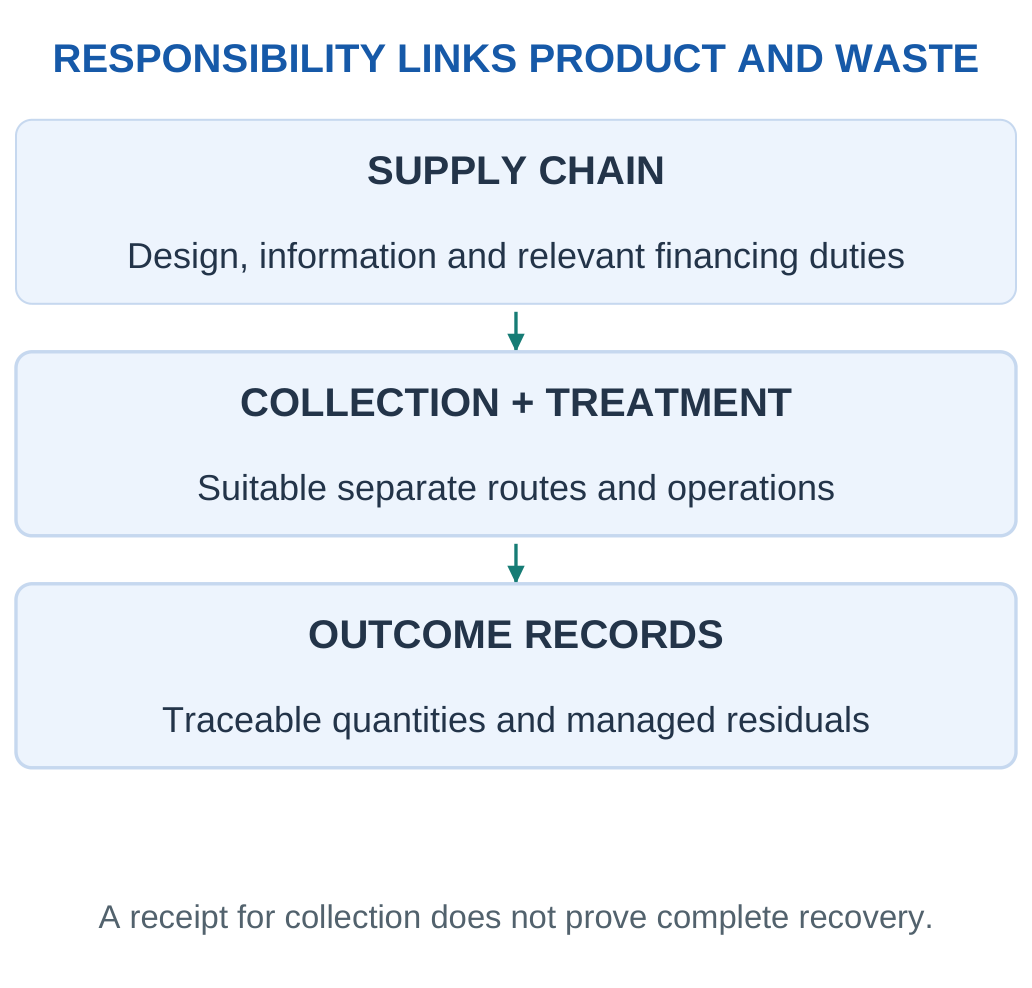
Meaning of the Crossed-Out Bin
The symbol indicates separate collection. It does not mean biodegradable, entirely non-hazardous or already recycled. Product and treatment information support suitable management.
The EU directives are different from Indian e-waste rules. This unit explains the frameworks explicitly named in the syllabus. A supplied collection percentage in a numerical is not automatically a statutory target or compliance conclusion.
Comparison Answer:
- RoHS: Listed substances and homogeneous-material limits.
- WEEE: Discarded equipment, collection, treatment and producer responsibility.
Explain the stage and purpose of each.
Product and Waste Responsibilities Meet
Information about materials and dismantling can make treatment more effective. Producer responsibility connects product supply with appropriate end-of-life arrangements, encouraging attention to design and recoverability. Actual duties depend on applicable implementation and equipment context.
Collection, Recycling and Recovery
Collected mass describes entry into a system. Mass sent to a plant describes transfer. Useful recovered output describes an outcome after treatment. These cannot be substituted for one another in a performance claim. Storage changes can also create differences between collection and annual treatment.
Measurement Distinction: Always state numerator, denominator, period and stage. A collection receipt is useful evidence of transfer, not a complete material balance.
Waste Prevention and End-of-Life Management
WEEE concerns the equipment waste stream, while product design and continued useful service can reduce how much waste arises. Separate collection supports suitable treatment when equipment reaches end of use. It does not require treating every working product as immediate scrap.
Producer Responsibility as a Connection
Relevant responsibilities connect placing equipment into use with appropriate end-of-life arrangements. Financing, information and organisational systems help make collection and treatment possible. The exact duties follow applicable implementation; the introductory concept is that end-of-life burdens are connected with the product system rather than ignored.
What the Symbol Tells a User
A crossed-out wheeled bin indicates separate collection rather than unsorted municipal disposal. It says nothing by itself about recycled input content, biodegradability or complete absence of hazardous substances. Symbols should be interpreted for their actual information function.
A Programme’s Evidence Chain
Collection records show what entered the managed system. Storage records show what remains. Transfer records show where equipment went. Treatment outputs show reuse, recovery and residual outcomes. Each is useful evidence, but none should be substituted for another stage without the relevant data.
Jurisdiction Distinction: RoHS and WEEE are the EU frameworks named in this syllabus. Their names should not be used as interchangeable labels for every country’s e-waste requirements.
Worked Example 5.29: Treatment Transfer Is Not Final Recovery
Problem: A programme collects 800 kg, transfers 720 kg to treatment and records 80 kg in storage. Find transferred fraction.
Model / Approach: Collected inventory is denominator; not a legal target calculation.
Step 1: Fraction = 720/800 = 0.90.
Step 2: 90% has been transferred.
Step 3: Storage is 10% and closes the collection ledger.
Step 4: Downstream material outputs and residues are needed before claiming a recycling or recovery outcome.
Answer: 90% transferred; 10% recorded storage.
Check and Interpretation: A transfer receipt describes movement, not complete recovery.
17. Sustainable Manufacturing
Sustainable manufacturing delivers reliable function while reducing material, energy, water and environmental burdens across the production system. A single efficient machine does not represent the full line, which includes utilities, yield losses, cleaning and packaging.
Key Point: Useful Output Changes Intensity
Energy spent on rejected units still belongs to the stated batch. Dividing by accepted devices makes the effect of poor yield visible under that allocation.

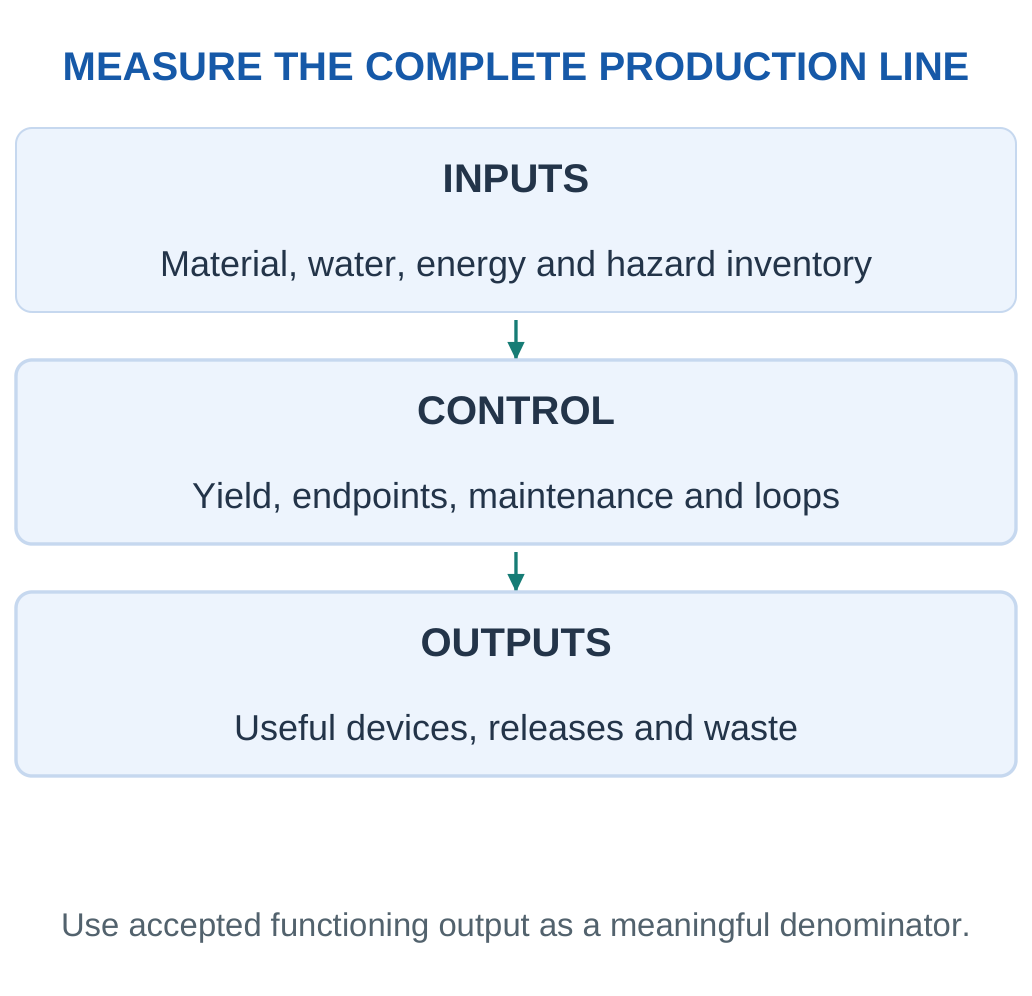
Material and Water Loops
Accurate deposition, appropriate material recovery and monitored rinse reuse can reduce demand. A closed loop still needs control of accumulating contaminants and a route for its purge or residue. Uncontrolled reuse can create defects or transfer pollution.
Energy and Quality
Compare power × time and include throughput. Count energy invested in rejected assemblies. Early defect detection, maintenance and real-time endpoints can prevent repeated scrap. Lower manufacturing demand is less useful if the change causes early product failure and frequent replacement.
Process Conditions
Containment, ventilation, compatible storage and managed effluents complement inherently safer chemistry. They address the actual operating situation rather than assuming a green product label eliminates the need for controls.
Useful Measures: Energy per accepted device, water per useful output, waste per product and retained service life. State included utilities, rejects and credits before comparing.
Yield Changes the Denominator
If a batch consumes energy and materials but rejects some assemblies, accepted devices carry the burden of the whole batch under the stated allocation. Improving yield can reduce material and energy demand per useful device even when machine power is unchanged.
Closed Loops Need a Purge Strategy
Repeated reuse can accumulate impurities. A controlled loop monitors quality, recovers useful material and manages any purge. A loop drawn as a perfect circle without losses or contaminant control is an incomplete engineering model.
Procurement and Design
A manufacturing choice should also preserve reliable service and appropriate treatment. A lower-temperature adhesive can save process energy but obstruct repair if it permanently bonds a replaceable module. Evaluate the consequence across stages.
First-Pass Yield and Rework
A device passing the required quality checks without rework preserves processing time and resources. Rework can recover some output but adds inputs and may introduce reliability concerns. Compare accepted output with all included processing rather than reporting the machine’s nominal throughput alone.
Utilities Outside the Main Machine
Ventilation, temperature control, water treatment and supporting equipment can contribute to facility demand. A machine-only comparison may be useful if clearly labelled, but it is narrower than a whole-line or whole-facility account. The appropriate boundary depends on the decision.
Closed-Loop Quality
A reused process liquid can accumulate contaminants. Monitoring, recovery and an appropriate purge maintain useful quality. A diagram with a perfect loop but no route for contamination is incomplete. The purge and recovery inputs belong in the environmental account.

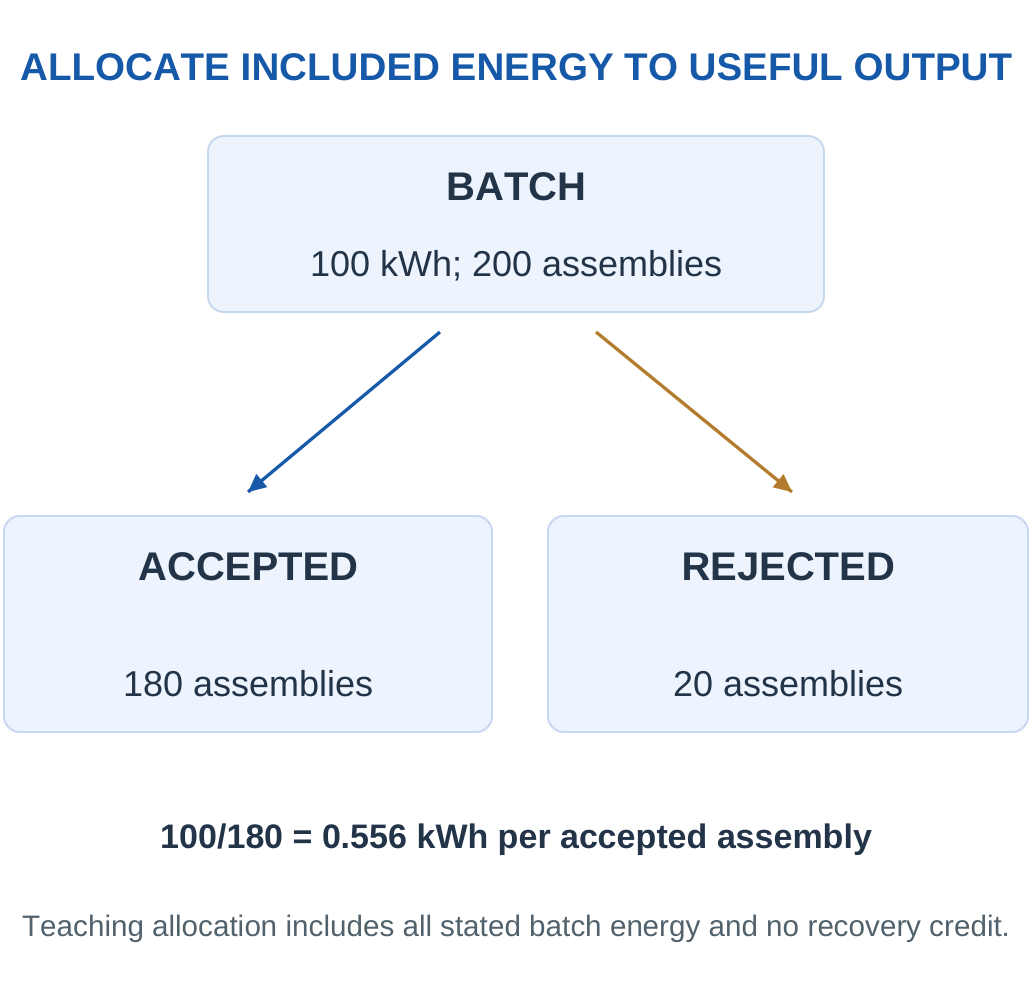
Reliability Connects Manufacture to Service
A change that lowers curing energy but shortens service life can increase total replacement demand. Conversely, improved quality can reduce both manufacturing scrap and later failures. Follow the consequence through the relevant life cycle instead of ranking a process only by one operating temperature.
Decision Case: Rework, Rejects and the Useful Denominator
A batch uses 120 kWh to produce 300 assemblies. Of these, 240 pass immediately and 60 require assessment. Rework uses a further 12 kWh and restores 40 of those assemblies; 20 remain rejected. The accepted products meet the same required specification.
Without Rework:
Useful output = 240 devices
Initial energy intensity = 120/240 = 0.500 kWh per device
With the Supplied Rework:
Total included energy = 120 + 12 = 132 kWh
Accepted output = 240 + 40 = 280 devices
Intensity = 132/280 ≈ 0.4714 kWh per accepted device
The batch uses more total energy but less energy per accepted output.


A Broader Comparison
Rework also uses time and potentially materials. Restored devices must meet the intended reliability, not only an immediate acceptance test. If rework creates a shorter service life, the apparent manufacturing improvement may not describe the same long-term function. Those questions extend the boundary beyond the supplied arithmetic.
How to Report It
State initial accepted output, reworked accepted output, remaining rejects and all included energy. Do not count the same reworked device once as an original output and again as an additional device. The total physical assembly count remains 300.
Lesson: More processing is not automatically worse per useful output, and a lower batch total is not automatically more efficient. Trace quantities and quality before calculating intensity.
Worked Example 5.30: Energy per Accepted Device
Problem: A batch uses 100 kWh and makes 200 assemblies, of which 20 fail acceptance. Find energy per accepted assembly.
Model / Approach: Allocate the stated batch energy to useful output; no rework credit supplied.
Step 1: Accepted count = 200 − 20 = 180.
Step 2: Intensity = 100/180.
Step 3: Result ≈ 0.556 kWh per accepted assembly.
Step 4: Using all 200 inputs would give 0.5 and hide the energy in rejects. Useful-output yield changes the meaningful denominator.
Answer: Approximately 0.556 kWh per accepted assembly.
Check and Interpretation: The useful-output intensity must rise when rejects consume energy.
Worked Example 5.31: Emissions from a Supplied Factor
Problem: A step uses 250 kWh with supplied accounting factor 0.6 kg CO₂e/kWh. Find energy-related emissions.
Model / Approach: Factor applies only to this energy boundary, not every location or whole device.
Step 1: Multiply energy by the stated factor.
Step 2: 250 × 0.6 = 150.
Step 3: Result is 150 kg CO₂e.
Step 4: Materials, transport and other stages are excluded unless separately added. The factor must match the energy and accounting purpose.
Answer: 150 kg CO₂e within the supplied boundary.
Check and Interpretation: kWh cancels, leaving kg CO₂ equivalent.
Worked Example 5.32: Compare Production on Accepted Output
Problem: Line A uses 200 kWh for 500 assemblies at 90% acceptance. B uses 210 kWh for 500 at 98% acceptance. Compare energy per accepted device.
Model / Approach: All stated batch energy is allocated to accepted output. There is no rework, recovery credit or performance difference in accepted devices.
Step 1: Line A
Accepted count = 500 × 0.90 = 450
Intensity = 200/450 ≈ 0.4444 kWh per accepted device
Step 2: Line B
Accepted count = 500 × 0.98 = 490
Intensity = 210/490 ≈ 0.4286 kWh per accepted device
Step 3: B has larger total batch energy but a lower useful-output intensity because substantially fewer assemblies are rejected. The reduction is about 3.57% relative to A.
Step 4: The comparison does not establish all manufacturing impacts. Material rejects, rework possibilities, utility boundaries and service reliability would extend the assessment.
Answer: A ≈0.444 kWh/device; B ≈0.429 kWh/device, on accepted output.
Check and Interpretation: Total energy and energy intensity can rank alternatives differently when useful yields differ.
18. Circular Economy in Electronics
A linear model extracts, manufactures, uses and discards. A circular model aims to retain useful product function, components and materials through managed loops. It is more than shredding everything at end of use.

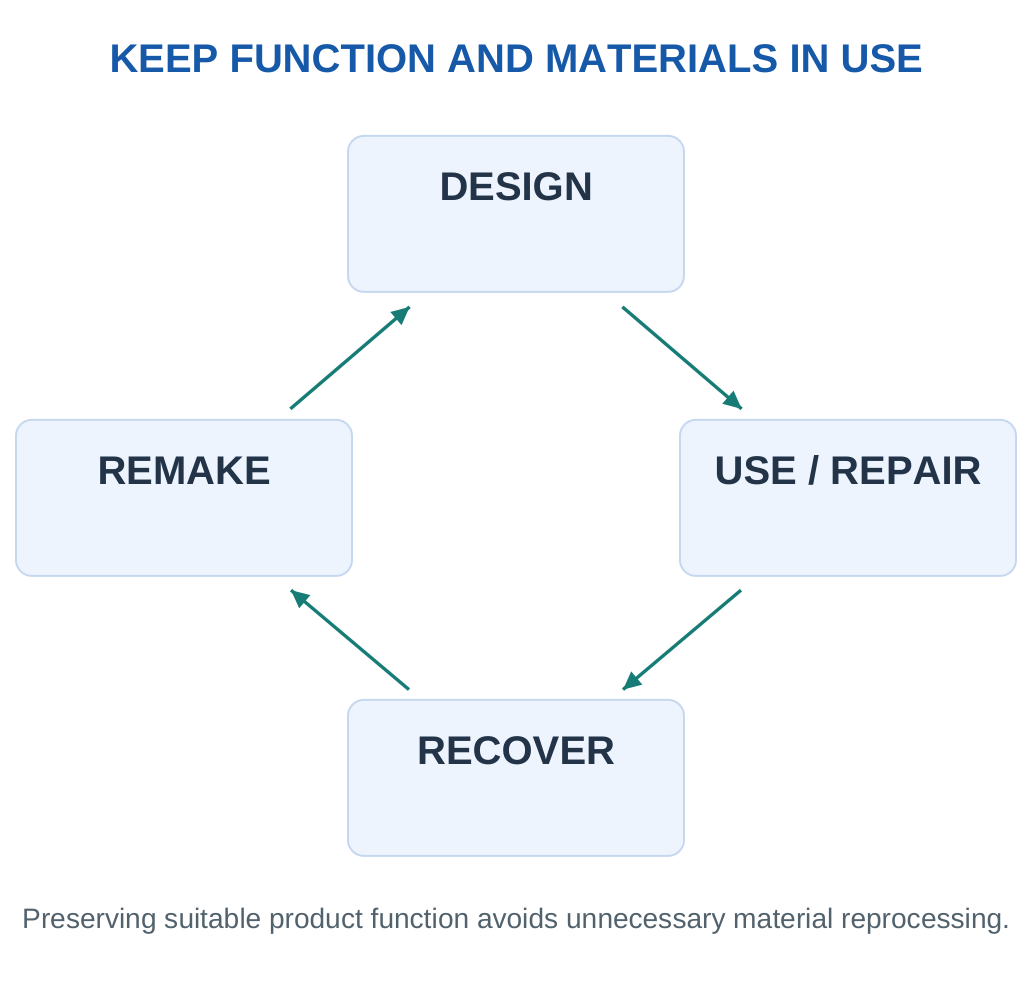
Ways to Retain Value
Maintain and repair to restore function. Reuse/refurbish through testing and preparation for another suitable service period. Remanufacture through a defined industrial process to the required specification. Recycle useful material when product or component service is unsuitable.
Design Enables the Loop
Replaceable batteries, modular parts, accessible fasteners, material identification, repair information and support can improve outcomes. Strong adhesives or laminates may improve sealing yet complicate separation. Balance reliability and access rather than assuming one construction is universally best.

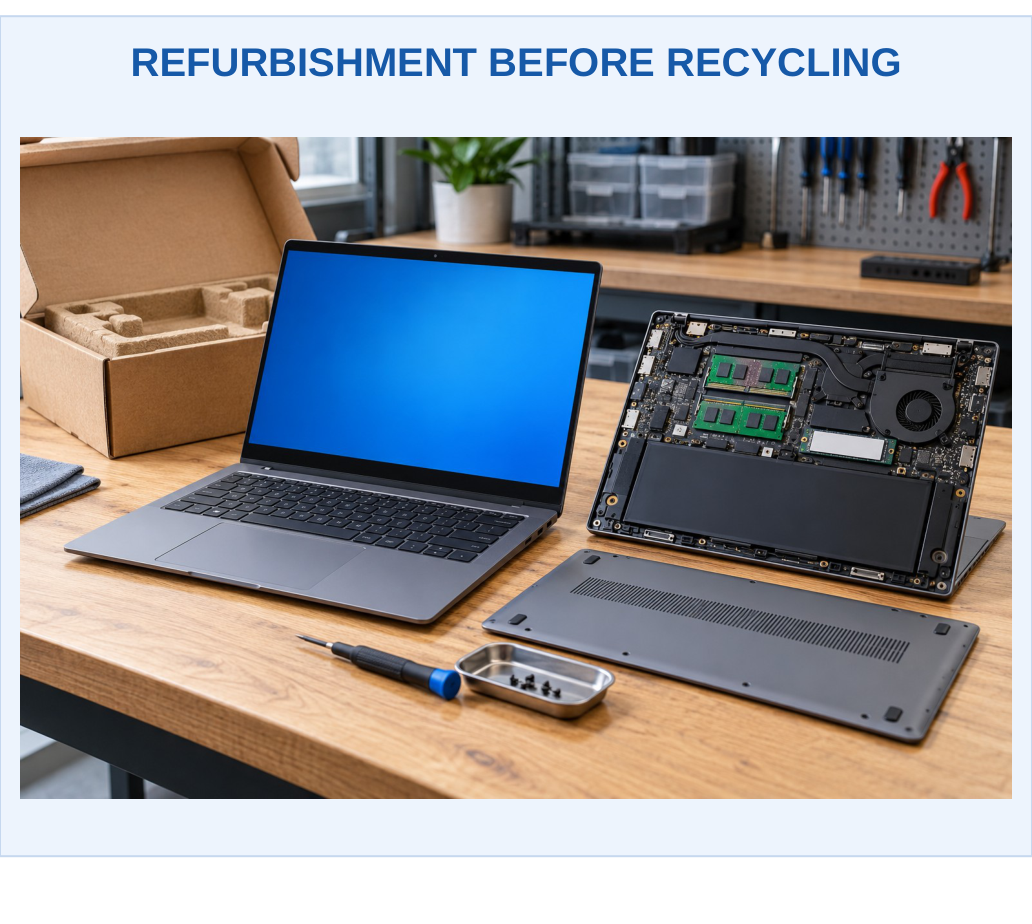
Verify the Claim: Recycled input content, collection fraction, reuse rate and material recovery describe different outcomes. One recycled part does not make the complete product circular.
Inner Loops and Outer Loops
Repair and reuse retain a product’s organisation and function. Component reuse preserves less of the complete system but more than raw-material recycling. Material recovery retains useful substances after much of the product structure has been lost. The most appropriate loop depends on condition and service suitability.
Business and Information Support
Take-back arrangements, spare-part access, repair information, testing and traceable material identity help loops operate. A design that is theoretically recyclable may still have poor outcomes if collection and suitable processing do not exist.
Circularity Evidence: Report useful service extension, verified redeployment, recovered output quality and managed residues. Do not add percentages measured on incompatible product and material bases.
Product Loops Retain Different Amounts of Organisation
Continued use retains the whole product. Repair restores a limited fault while preserving most of its organisation. Component reuse preserves a module but not necessarily the original device. Material recycling recovers substances after much of the product structure is lost. These routes are not equivalent just because each diverts material from disposal.
Design and Infrastructure Must Meet
A replaceable part is useful only when suitable replacements and repair capability exist. A recyclable material needs collection and a compatible process. A take-back scheme needs actual destinations and outcome records. Circularity therefore combines construction, information, logistics and processing.
A Service-Life Decision
A durable sealed product can resist moisture but be difficult to repair. A modular product can improve access but must still achieve mechanical and electrical reliability. The correct trade-off depends on service conditions and expected repair/recovery opportunities.
Reporting Circularity
Recycled input content describes origin of new input. Reuse describes equipment or components returning to service. Recycling/recovery describes useful outputs from treatment. Report period, unit and boundary. Do not add percentages on incompatible denominators into one apparently impressive score.
Practical Conclusion: Circular design is a managed route for useful function and materials, supported by actual outcomes rather than only theoretical separability.
Worked Example 5.33: Recycled Content Is an Input Metric
Problem: A housing contains 0.6 kg verified recycled aluminium and 0.4 kg primary aluminium. Find recycled input content.
Model / Approach: Count only the supplied aluminium inputs.
Step 1: Total aluminium = 0.6 + 0.4 = 1.0 kg.
Step 2: Recycled fraction = 0.6/1.0.
Step 3: Recycled input content = 60%.
Step 4: This is not the entire device fraction or its eventual recovery rate. Input content and end-of-life outcomes need separate boundaries.
Answer: 60% recycled aluminium input by mass.
Check and Interpretation: Recycled content does not establish future collection or recycling.
19. Life-Cycle Thinking and Fair Comparison
Life-cycle thinking follows materials, manufacture, transport, use, maintenance and end of life. A life-cycle assessment formalises the goal, functional unit, system boundary, inventory and impact evaluation. Data and allocation choices affect the result.


Functional Unit
“One device” can be an unfair comparison if devices last different times or deliver different service. Define a common requirement, such as a specified computing service over a fixed period.
Repair Versus Replacement
Repair adds a repair burden but can avoid replacement manufacture. A newer device may use less operating energy. Compare remaining lifetime, repair inputs, use pattern and manufacturing burden for the same service. Either option can be favoured under different supplied assumptions.
Multiple Impacts
A carbon estimate does not independently measure toxicity, water demand, resource depletion or ecosystem effects. A lower value in one category can coexist with a higher value in another. Report what the calculation actually covers.
Comparison Rule: Same service, same period, same boundary. A recycled-material credit needs a stated allocation method and evidence of displacement; do not count the same avoided production twice.
Sensitivity and Break-Even
A replacement can have an initial manufacturing burden but lower operating energy. The break-even time depends on annual savings and the remaining service period. A changing energy factor, early failure or different use pattern can move or remove the break-even point.


Limits of One Indicator
An emissions estimate is useful for the included greenhouse-gas boundary. Toxicity, water, resource use and ecosystem effects require their own information. State the conclusion precisely, and avoid turning a narrow arithmetic advantage into a claim about every environmental dimension.
Functional Unit and Reference Flow
A functional unit defines the service. The reference flow is the amount of product or activity needed to deliver it under the model. If one device lasts half as long, more units may be required for the same service. A one-device comparison can therefore hide replacement demand.
Boundary and Allocation
Include the stages relevant to the stated goal and disclose exclusions. Shared processes and recovered materials may need an allocation convention. The same avoided production should not be credited twice to different parts of the account without an explicit method.

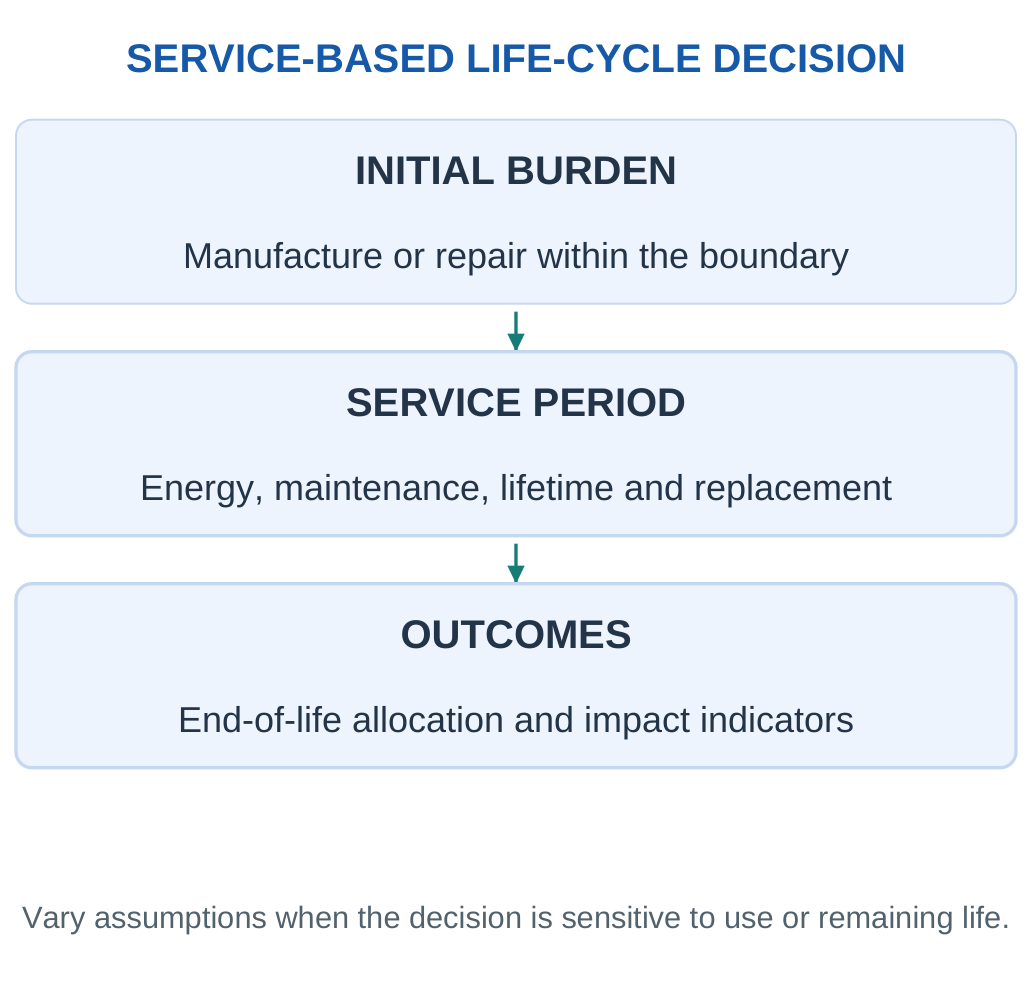
Scenario Sensitivity
Operating hours, energy factor, repair needs and remaining life can change repair-versus-replacement results. A break-even calculation is a model outcome under those assumptions. It should be tested against plausible changes instead of treated as a universal device rule.
Multiple Impact Categories
A carbon result expresses an included greenhouse-gas account. Water use, toxicity and resource concerns require other indicators. A decision can favour one option in one category and another elsewhere. State the trade-off and evidence rather than replacing an environmental assessment with a single unqualified number.
Application Workshop: Sensitivity Can Change a Decision
Two options provide the same three-year computing service.
- Repair: Initial burden 10 kg CO₂e; use 30 kWh/year.
- Replacement: Initial burden 50 kg CO₂e; use 10 kWh/year.
First use a supplied energy factor of 0.5 kg CO₂e/kWh, then test 1.0. No other stages or credits are included.
Step 1: Evaluate the First Scenario.
Repair = 10 + 3 × 30 × 0.5 = 55 kg CO₂e
Replacement = 50 + 3 × 10 × 0.5 = 65 kg CO₂e
Repair is lower by 10 kg under this model.
Step 2: Change Only the Factor.
At 1.0 kg CO₂e/kWh:
Repair = 10 + 3 × 30 × 1.0 = 100 kg CO₂e
Replacement = 50 + 3 × 10 × 1.0 = 80 kg CO₂e
The lower-use-energy replacement is now lower by 20 kg. The service, device data and period remain unchanged.


Step 3: Find the Threshold.
Let f be the factor.
Repair = 10 + 90f
Replacement = 50 + 30f
At equality:
10 + 90f = 50 + 30f
60f = 40
f = 2/3 kg CO₂e/kWh
Below that supplied-model threshold repair has lower carbon; above it replacement does.
Step 4: Interpret the Limit.
This is an included carbon comparison, not a complete environmental assessment. Device life, repair reliability, transport, other energy sources, material impacts and allocation can change the result. A local energy factor also needs appropriate evidence in a real study.
Workshop Conclusion: A conclusion should name the service, period, boundary and sensitive assumptions. Explaining when the ranking changes is often more useful than reporting one total without its model.
Worked Example 5.34: Repair Versus Replacement
Problem: For the same three-year service, repair adds 10 kg CO₂e and uses 30 kWh/year. Replacement adds 80 kg and uses 20 kWh/year. Use factor 0.5 kg CO₂e/kWh.
Model / Approach: Both last three years; include only stated initial and use burdens.
Step 1:
Repair = 10 + 3 × 30 × 0.5 = 55 kg CO₂e
Step 2:
Replacement = 80 + 3 × 20 × 0.5 = 110 kg CO₂e
Step 3: Repair is lower by 55 kg CO₂e in this model.
Step 4: Replacement saves operation energy but does not offset its larger initial burden over this period. Other indicators are not settled.
Answer: Repair 55; replacement 110 kg CO₂e.
Check and Interpretation: Same service and period make the comparison meaningful.
Worked Example 5.35: Simple Carbon Break-Even
Problem: Replacement adds 60 kg CO₂e initially but saves 20 kWh/year. Use factor 0.5 kg CO₂e/kWh. Find break-even.
Model / Approach: Constant factor, equivalent service and no other effects.
Step 1:
Annual saving = 20 × 0.5 = 10 kg CO₂e/year
Step 2:
Time = Additional initial burden / Annual saving
Step 3:
Break-even = 60/10 = 6 years
Step 4: A shorter available service period does not reach this model break-even. Changed use, grid factor or failure can alter it.
Answer: Simple break-even 6 years.
Check and Interpretation: Zero or negative annual saving would not give this positive result.
Worked Example 5.36: Account for Replacement Within a Service Period
Problem: The required service lasts 6 years. Device A lasts 3 years and has a 40 kg CO₂e manufacturing burden per unit. B lasts 6 years and has 65 kg per unit. Compare manufacturing burdens for the service.
Model / Approach: Equivalent function, no repair or second use, no manufacturing discounting and no use-phase/end-of-life terms in this narrow comparison.
Step 1: A requires two units to deliver six years of service under the supplied lifetime assumption.
A total = 2 × 40 = 80 kg CO₂e
Step 2: B requires one unit, giving 65 kg CO₂e. Although B has the larger per-device burden, it has the smaller manufacturing burden for the defined six-year service.
Step 3: Difference = 80 − 65 = 15 kg CO₂e in favour of B within this boundary. Comparing one A with one B would omit A’s replacement.
Step 4: Use-phase energy, repair opportunities and end-of-life allocation are not included. The example establishes why a functional service period matters, not which real product is universally best.
Answer: Six-year manufacturing burden: A 80 kg CO₂e; B 65 kg CO₂e.
Check and Interpretation: Count the products required for the same service before comparing their per-unit burdens.
20. Integrated Case: Campus Electronics
A campus laptop programme aims to provide reliable computing with less avoidable purchasing and unmanaged waste. Begin with an inventory of required performance, condition, support and remaining useful service.
Step 1: Preserve Suitable Function
Identify equipment that can continue, be repaired or be upgraded. Test restored devices and handle institutional data appropriately. Working hardware without required support may still be unsuitable for the intended service.
Step 2: Compare Alternatives
Use equivalent service years when comparing repair and replacement. Include major repair inputs, operating energy and expected lifetime. Do not assume either newest or oldest is always best.
Step 3: Manage Residual Equipment
Separate specialist components and direct remaining equipment to suitable treatment. Track boards, metals, plastics and residues. Use target inventories and final product quality when reporting metal recovery.
Step 4: Improve Purchasing
Select durable, maintainable equipment with suitable material information, spare parts and take-back arrangements. Feed observed repair and treatment outcomes into future procurement.
Integrated Answer: Connect prevention, material selection, life extension, collection, recovery, data responsibility and measurement. Explain relationships rather than adding unrelated environmental slogans.
Building an Institution-Level Plan
Start with the required service and a reliable equipment inventory. Separate devices suitable for continued use, repair candidates, reusable components and equipment requiring treatment. Record the reason for each route so later outcomes can be assessed against the original decision.
Procurement Feedback
If many devices fail at an inaccessible connector or unsupported battery, future purchasing can consider repair access and part availability. If a material stream repeatedly lacks a suitable destination, design and purchasing information can help avoid an unmanaged fraction. The programme learns from actual outcomes rather than buying on appearance alone.
Measure Results in Compatible Units
Report service-ready devices, added service years, collected equipment mass, useful metal output and managed residue separately. Each describes a different result. A combined dashboard can display them together without adding unlike units.
Review the System
Check whether repaired devices were actually redeployed, whether stored equipment is accumulating and whether recovery destinations remain appropriate. Compare expected and actual life. This connects green design, continued service and end-of-life management into one improving system instead of treating the final collection event as the whole sustainability programme.
Application Workshop: Audit a Circularity Claim
An institution reports that 90% of its collected equipment was recycled.
Its ledger shows:
- 1000 kg collected.
- 200 kg held in storage.
- 300 kg prepared and verified for a second service period.
- 500 kg sent to a treatment facility.
The facility reports 400 kg useful material outputs and 100 kg managed residuals from that 500 kg feed. These are supplied teaching data.
Step 1: Close the Institution Ledger.
Storage + Verified reuse + Treatment transfer
= 200 + 300 + 500
= 1000 kg
The equipment account closes.
Verified reuse = 300/1000 = 30% of collected mass
Treatment transfer = 500/1000 = 50%
Step 2: Identify the Treatment Result.
Useful material output = 400/500 = 80% of facility feed
On the institution’s collected-mass basis:
400/1000 = 40%
The two percentages use different denominators and describe different stages.
Key Point: Keep Count and Mass Distinct
Devices reused and kilograms of metal recovered can both be useful results. Report them separately unless a defined conversion or indicator explicitly combines them.

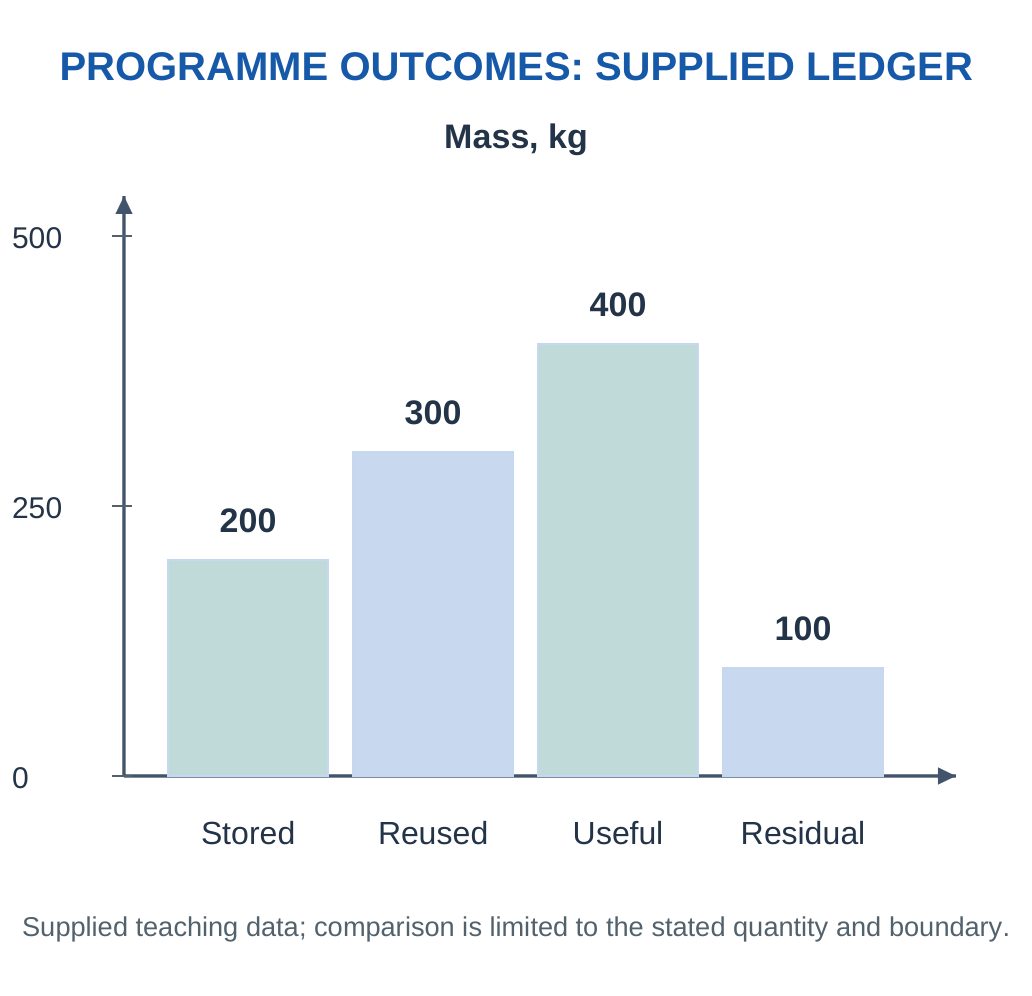
Step 3: Evaluate the Original Wording.
Neither the 80% facility result nor the 30% reuse result supports a 90% recycling claim for collected mass. Adding reuse and material output gives 700 kg of different useful outcomes on a common mass basis, but it should be labelled precisely rather than called all recycled material. The 200 kg stored has no completed use or treatment outcome yet.
Step 4: Retain Residual Accountability.
The 100 kg facility residual is not a useful recovered output. It still needs suitable management and destination records. A useful fraction does not erase the remainder.
Step 5: Improve the Report.
State collected equipment, verified redeployment, storage, treatment transfer, useful material output and managed residual separately. Add device counts or service years when they help describe preserved function.
Workshop Conclusion: Circularity evidence follows actual outcomes, period and denominator. A transparent set of smaller, well-defined measures is more informative than one inflated percentage.
Report-Writing Case: Turn an Inventory into a Useful Summary
A good institutional report separates at least four ideas: service retained, equipment awaiting action, equipment transferred and final material outcomes. A device can move from repair stock to service, while a residue can move from a treatment plant to a specialised management route. These movements should remain traceable.
A Concise Evidence Table
| Claim | Supporting Record |
|---|---|
| Equipment returned to service | Identity, condition, tests and deployment |
| Equipment held in storage | Opening stock, additions, removals and closing stock |
| Equipment transferred for treatment | Defined mass, period, receiver and route |
| Target metal recovered | Representative feed grade and useful target output |
| Product purity achieved | Target assay and total product mass |
| Environmental benefit estimated | Common service, boundary, data and indicators |
Make Limitations Useful
A statement such as “final metal output is not yet available” identifies a real information gap. Replacing it with an assumed complete recycling percentage makes the report less reliable. Similarly, a device prepared for reuse should not be described as redeployed until that outcome is known.
Close the Feedback Loop
Use recurring faults, difficult dismantling and poor material destinations to improve purchasing and design choices. Review whether repair and support arrangements actually extend useful life. Compare expected outcomes with actual records over the stated period.
Lesson: A professional sustainability account is clear about what happened, what was measured and what remains uncertain. Correctly named outcomes are more useful than a broad claim that hides different stages.
Worked Example 5.37: Keep Device Counts and Metal Mass Separate
Problem: A programme reuses 60 devices and sends a separate 100 kg residual stream with 12% copper to 75% copper recovery. Find recovered copper.
Model / Approach: Reuse count and residual mass are separate given quantities.
Step 1: Feed copper = 100 × 0.12 = 12 kg.
Step 2: Recovered copper = 12 × 0.75 = 9 kg.
Step 3: The other outputs contain 3 kg target under the closed inventory.
Step 4: Report 60 devices reused and 9 kg copper recovered separately. Counts cannot be added directly to kilograms.
Answer: 9 kg copper, alongside 60 reused devices reported separately.
Check and Interpretation: Do not double-count reused products as processed material.
Worked Example 5.38: A Complete Reuse-and-Recovery Report
Problem: A campus receives 100 devices weighing 200 kg. It redeploys 60 devices weighing 120 kg. The other 80 kg has 15% copper, recovered at 80% into a 90%-pure product. Report the separate outcomes.
Model / Approach: Redeployment is verified; only the residual mass enters recovery. Grade and recovery refer to copper in that residual feed.
Step 1: Reuse outcome is 60 devices and 120 kg equipment returned to service. It is not also counted as the material feed processed for copper.
Step 2:
Residual copper inventory = 80 × 0.15 = 12 kg
Recovered copper = 12 × 0.80 = 9.6 kg
Copper in other outputs = 12 − 9.6 = 2.4 kg
Step 3:
90%-pure product mass = 9.6/0.90 ≈ 10.667 kg
Non-copper portion ≈ 10.667 − 9.6 = 1.067 kg
Copper recovery remains 80%, not 90%.
Step 4: Report preserved product function and recovered material in their own units. The programme also needs appropriate records for non-copper fractions and residual treatment, rather than claiming the full 200 kg became metal.
Answer: 60 devices redeployed; 9.6 kg copper recovered in approximately 10.667 kg product.
Check and Interpretation: The device ledger and target-metal ledger describe complementary outcomes without double counting.
21. Formula Guide
| Relation | Basis |
|---|---|
| Atom economy = Desired stoichiometric product / Reactants × 100% | Balanced theoretical reaction |
| Yield = Actual / Theoretical product × 100% | Same product/purity |
| PMI = Included input / Product | Explicit input boundary |
| E-factor = Included waste / Product | Explicit waste convention |
| E-factor = PMI − 1 | Same closed product-plus-waste boundary |
| Target inventory = Feed × Grade | Grade as a fraction |
| Recovered target = Inventory × Recovery | Recovery as a fraction |
| Sequential recovery = r₁r₂… | Each stage’s inlet basis |
| Product mass = Target mass / Purity | Purity as target fraction |
| Energy = Power × Time | kW × h = kWh |
| Emissions = Energy × Supplied factor | Matching energy/accounting boundary |
| ppm = Mass fraction × 10⁶ | 0.1% = 1000 ppm; 0.01% = 100 ppm |
Before and After Working
Identify period, boundary and useful output. Convert percentage to fraction. Distinguish equipment mass, homogeneous-material mass and target-metal mass. After calculation, check units and conservation. Target recovery cannot exceed the supplied inventory without an additional input or inconsistency.
Key Point: A Narrow Calculation Gives a Narrow Conclusion
An energy-related carbon estimate does not independently measure toxicity, water demand or resource depletion. State included processes and indicators instead of claiming universal sustainability.

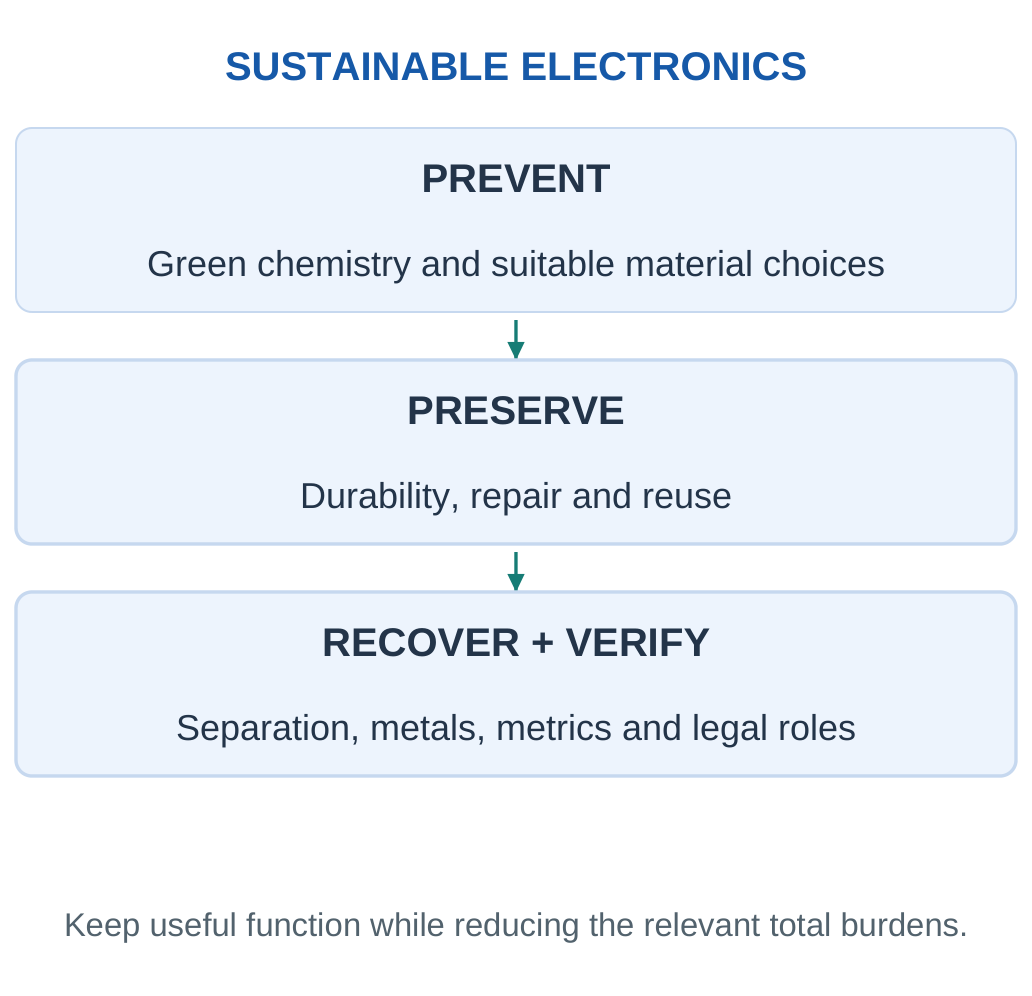
22. Short-Answer Revision
1. How Does Green Chemistry Differ from Treatment?
It changes product/process design to prevent waste and hazardous chemistry at source. Treatment manages waste already created.
2. Can Yield Be High While Atom Economy Is Low?
Yes. A reaction can deliver most theoretical product while inherently forming substantial by-products. The ratios answer different questions.
3. Is Renewable Automatically Biodegradable?
No. Renewable describes source replenishment; biodegradation describes biological transformation in an environment.
4. Is Water Always the Best Solvent?
No universal choice follows from its name. Drying energy, cleaning effectiveness, wastewater and device compatibility must be assessed.
5. When Does E-factor Equal PMI Minus One?
Only when the same closed boundary accounts for included input as useful product or waste, without incompatible exclusions or credits.
6. What Distinguishes Transient and Biodegradable Electronics?
Transient function ends or transforms after a trigger/time. Dissolution or disintegration does not necessarily prove biological transformation.
7. Why Is E-waste Both Valuable and Concerning?
It contains useful materials alongside constituents and stored energy requiring suitable treatment. Recovering value and controlling releases are both necessary.
8. Why Avoid Uncontrolled Burning?
It can release contaminated particles and hazardous products while losing material quality. Visible recovered metal does not account for those outputs.
9. What Is Depollution?
Suitable removal/management of designated hazardous constituents or components. It is different from final refining.
10. What Is Liberation?
Freeing joined materials so separation can use their physical differences. Poor liberation can trap target metal in mixed particles.
11. Is a Concentrate Pure Metal?
Not necessarily. It is an enriched stream whose grade and later processing determine usefulness.
12. How Do Recovery and Purity Differ?
Recovery compares target in output with target in feed. Purity compares target in product with total product mass.
13. Why Multiply Sequential Recoveries?
Each stage acts on the target reaching that stage. Percentages on successive inlet bases therefore multiply.
14. What Does RoHS Address?
Listed substance concentrations in homogeneous materials of covered equipment, subject to relevant scope and exemptions.
15. What Does WEEE Address?
Equipment waste collection, treatment, recovery and producer responsibility in the EU framework.
16. What Does the Crossed-Out Bin Mean?
Separate collection rather than unsorted municipal disposal. It does not certify biodegradability or complete recycling.
17. Why Can Repair Reduce Burden?
It can avoid replacement manufacture and preserve useful function. Remaining life, support, repair inputs and use energy determine the comparison.
18. What Makes a Life-Cycle Comparison Fair?
Equivalent service and period with consistent boundaries and allocation conventions. Report excluded impacts rather than claiming a universal result.
23. Complete Examination Answers
1. Green Chemistry Principles in Electronics
Green chemistry connects useful function with prevention of avoidable waste and hazard. Its principles address waste prevention, atom economy, less hazardous synthesis and safer products; safer auxiliaries, energy efficiency, renewable feedstocks and fewer unnecessary derivatives; catalysis, appropriate degradation, timely analysis and inherently safer choices.
Selective coating can prevent waste, safer cleaning chemistry can reduce a particular hazard, and endpoint feedback can avoid excess reagent use.
2. Biodegradable Electronic Systems
Biodegradation is biological transformation under specified conditions. It differs from transient loss of function, dissolution and fragmentation.
A complete device contains a substrate, conductors, active components, possible energy storage and encapsulation, each with a potentially different fate. A degradable support does not establish a degradable complete circuit.
The design must retain service stability and then allow the intended end-of-life transformation. Environment, time, component coverage and products are necessary evidence.
3. E-waste Treatment Sequence
Collection and triage preserve reuse potential and identify special streams. Suitable equipment can be repaired or refurbished, tested and returned to service with appropriate data handling.
Remaining equipment undergoes suitable depollution and dismantling, followed by controlled liberation and separation. Metal-rich and other fractions then enter appropriate recovery, refining or residual-management routes. Batteries and certain components require specialised arrangements.
Dust, emissions, effluent and residues belong in the process account alongside valuable outputs. A closed ledger and traceable destinations are stronger evidence than collected mass alone.
4. Industrial Metal-Recovery Routes
Pyrometallurgy uses high-temperature operations and subsequent refining for suitable feed. Hydrometallurgy uses controlled solution chemistry, separation and recovery. Bio-assisted routes use biological agents to support selected extraction stages.
Feed compatibility, target selectivity, rate, energy/reagent demand and required product quality determine the useful combination.
Thermal processes need emissions and solid-residue management; solution and biological routes still need controlled liquids and residual solids. A dissolved metal is an intermediate, not automatically a finished product. Recovery and purity describe different outcomes and should both be followed through the route.
5. RoHS and WEEE
RoHS addresses listed hazardous substances in homogeneous materials of covered electronic equipment, with applicable scope and exemptions. The relevant denominator is the material itself; averaging it with an unrelated heavy housing does not change its composition.
WEEE addresses discarded equipment, separate collection, appropriate treatment, recovery and producer responsibility in the EU framework. The crossed-out bin indicates separate collection rather than harmlessness or biodegradability.
The two frameworks act at different stages.
6. Sustainable Manufacturing and Circular Design
A production account follows material, water, energy, emissions and waste per useful output. Better selectivity, first-pass yield, maintenance and timely control can avoid repeated scrap. Monitored loops can reduce fresh demand while managing accumulated contaminants.
Circular design extends suitable service through maintenance, repair, refurbishment and modular construction; material recycling retains useful substances when product service is unsuitable.
Accessible parts, support, traceability and appropriate treatment make these loops practical.
7. Repair Compared with Replacement
A fair comparison provides the same defined service over the same period. Continued use includes repair inputs and future operation; replacement includes manufacture and other stages selected by the boundary.
A more efficient new device can save operating energy but may need time to offset an additional initial burden. Remaining life, support, use pattern and energy factors can change the result.
Recovery credits require consistent allocation and must not be counted twice. A favourable carbon calculation supports that included indicator; it does not independently settle toxicity, water use or every environmental concern.
Final Check: Use a defined system, correct denominator, explicit units and conservation. Preserve suitable function, recover materials through appropriate routes and account for what remains.
Solved Concept Clinic: High Recycling Capture, Impure Product
A separator captures most feed copper but produces a concentrate containing substantial polymer and other metals. There is no contradiction: recovery measures captured copper relative to feed copper, while purity measures copper relative to total concentrate.
The next process must handle the non-target fraction and achieve the required final quality. A high capture number alone does not establish a finished reusable metal.
Improving grade may divert some copper to another output, so the complete route should track both quantities and remaining streams.
The correct report states recovery, grade and downstream requirements rather than relabelling concentrate mass as pure copper.
Solved Concept Clinic: A Disappearing Substrate with Persistent Parts
A test shows that a paper-like support loses visible structure, while a chip and conducting residues remain. The observation supports a change in the support under that environment, not complete-device biodegradation.
Dissolution, fragmentation and biological transformation are different mechanisms, and visible loss does not identify the final products. A small remaining fraction can still be relevant to hazard and mobility.
The assessment needs component identity, environment, time and product fate. The device must also have completed its intended service before transformation.
A responsible claim therefore names the tested component and outcome instead of extending it automatically to the complete assembly.
Solved Concept Clinic: A Compliant Material Is Still Equipment Waste
A product-composition assessment indicates that a tested material meets its applicable substance comparison. At end of use, the complete equipment still requires an appropriate waste route.
RoHS concerns listed product substances within its framework; WEEE concerns equipment waste management. One does not replace the other.
A below-limit result for one material also does not prove every material, substance and documentation requirement for the complete product. Separate collection remains a distinct outcome from final material recovery.
The correct explanation follows composition and end-of-life responsibilities as complementary stages, rather than treating a product label as permission for ordinary mixed disposal.
Solved Concept Clinic: The Lowest-Power Process Uses More Resources
A process runs at lower power but for much longer and with more rejected output. Lower power is a reduced energy-use rate, not necessarily lower total energy or useful-output intensity.
Multiply power by operating time, include the stated utilities and divide by accepted functioning output. Additional rework inputs and reliability can further change the comparison.
A narrow machine reading can still be useful when labelled accurately, but it is not a whole-life conclusion.
The better supported decision follows the same service, useful output and boundary, and reports material, energy and relevant hazard indicators without assuming they always move in the same direction.
Study Resources
Revise these Applied Chemistry for Smart Systems Unit 5 Notes with the green chemistry principles, worked examples, material balances, e-waste treatment mechanisms, formula guide and examination answers.
- More Study Material: https://www.notesgallery.com
- University: https://aktu.ac.in