
Course Code: BP104T
Unit V Introduction
Cardiovascular system. The heart and blood vessels maintain a continuous, directed blood supply. This unit connects their anatomy with electrical activation, pressure generation, circulation and the mechanisms of cardiovascular disease. Blood must reach tissues at an adequate flow and pressure. The right heart sends blood through the lungs, while the left heart supplies the systemic circulation. Valves keep flow one-way; specialised conducting tissue coordinates contraction; vessel walls distribute and regulate flow. A useful disease explanation identifies the disturbed variable: vessel resistance, coronary supply, rhythm, ventricular filling or pumping. These disturbances often interact. Sustained hypertension can increase cardiac workload; coronary disease can damage myocardium; an arrhythmia can reduce effective output.
Topics Covered – Complete Syllabus Map
| Required topic | Notes sections |
|---|---|
| Heart anatomy and valves | 5.1–5.4 |
| Blood circulation | 5.5–5.6 |
| Arteries, veins and capillaries | 5.7–5.9 |
| Conduction, heartbeat and autonomic regulation | 5.10–5.13 |
| Cardiac output and cardiac cycle | 5.14–5.17 |
| Blood-pressure regulation and pulse | 5.18–5.21 |
| Electrocardiogram | 5.22–5.23 |
| Hypertension | 5.24–5.25 |
| Cardiac arrhythmias | 5.26–5.27 |
| Congestive heart failure | 5.28–5.29 |
| Atherosclerosis and coronary artery disease | 5.30–5.31 |
| Angina and myocardial infarction | 5.32–5.33 |
| Revision, cases and examination practice | 5.34–5.35 |
Learning outcomes
Label chambers, valves, great vessels and the heart wall.
Trace pulmonary, systemic and coronary circulation.
Compare artery, vein and capillary structure with function.
Follow an impulse through the cardiac conducting system.
Relate autonomic effects to rate, conduction and contractility.
Explain valve events, pressure and volume changes in the cardiac cycle.
Calculate cardiac output, stroke volume, ejection fraction and an approximate mean arterial pressure.
Explain neural, hormonal, renal and local regulation of circulation.
Identify basic ECG waves and intervals.
Connect each listed disease to its causes, mechanism and functional consequences.
Essential vocabulary
| Term | Meaning |
|---|---|
| Systole | Contraction phase of a chamber |
| Diastole | Relaxation and filling phase |
| Stroke volume | Blood ejected by a ventricle per beat |
| Cardiac output | Blood pumped by a ventricle per minute |
| Preload | Myocardial stretch before contraction |
| Afterload | Load opposing ventricular ejection |
| Ischaemia | Inadequate tissue blood supply |
| Infarction | Tissue death caused by prolonged ischaemia |
| Arrhythmia | Abnormal rate, rhythm or conduction |
| Congestion | Blood/fluid accumulation upstream of impaired pumping |
Central question How does a change in pressure, resistance, electrical timing or muscle function alter tissue perfusion?
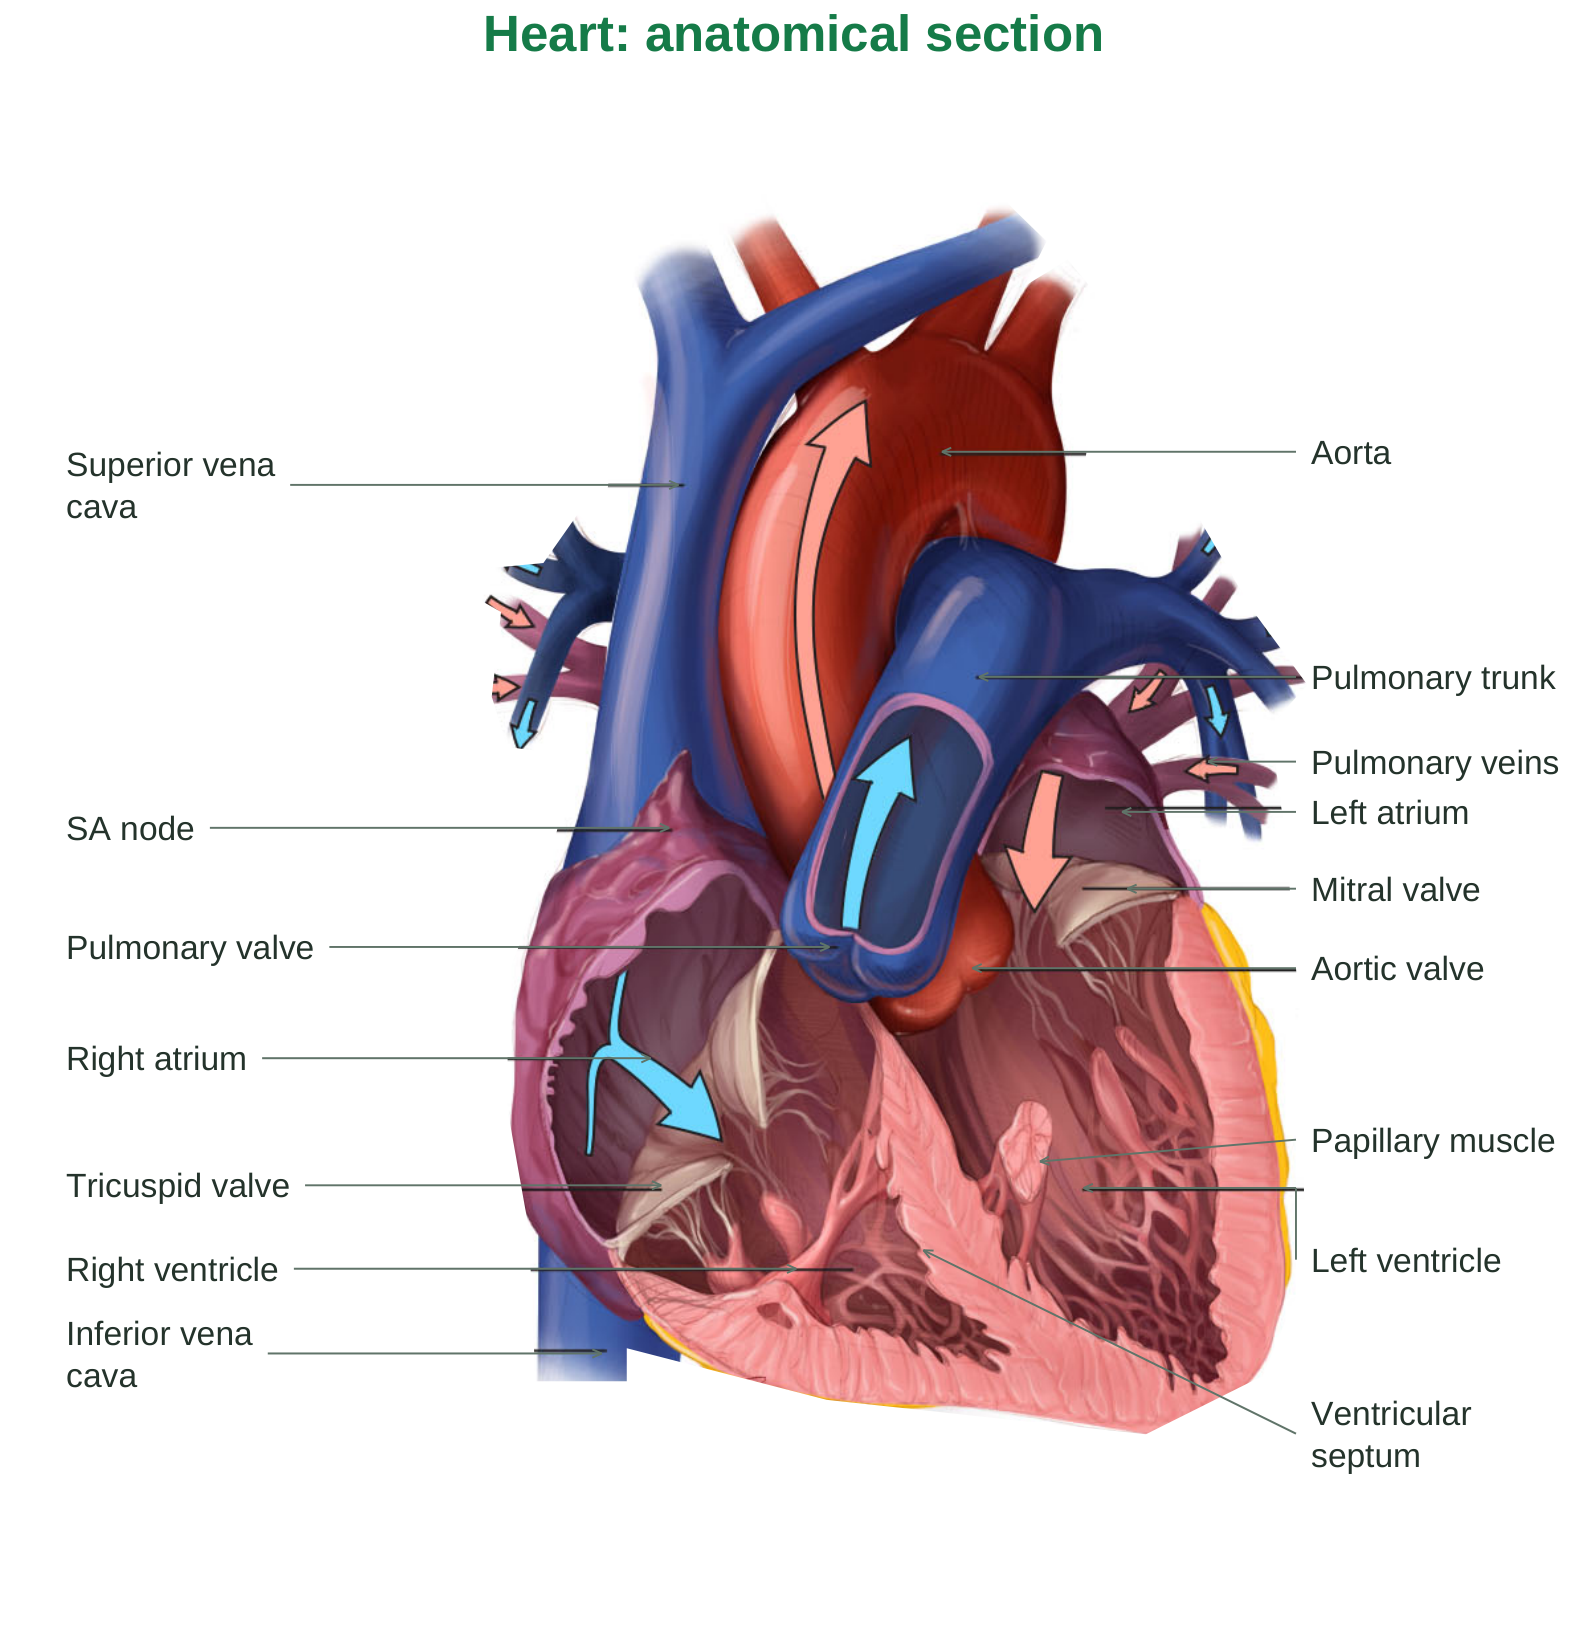
Diagram labels: Heart: anatomical section; Superior vena cava; SA node; Right atrium; Tricuspid valve; Right ventricle; Inferior vena cava; Aorta; Pulmonary trunk; Pulmonary veins; Left atrium; Mitral valve; Aortic valve; Pulmonary valve; Left ventricle; Papillary muscle; Ventricular septum.
Read the section: venae cavae → right atrium → tricuspid valve → right ventricle → pulmonary valve → pulmonary trunk. Pulmonary veins → left atrium → mitral valve → left ventricle → aortic valve → aorta.
5.1 Position and external features of the heart
The heart is a hollow muscular organ in the middle mediastinum, enclosed by the pericardium. It lies between the lungs, behind the sternum and above the diaphragm. Its long axis runs downward, forward and towards the left. Most of its mass lies to the left of the midline. The apex, formed mainly by the left ventricle, points inferiorly and leftward; its impulse is commonly located near the left fifth intercostal space at the midclavicular line. The base faces posteriorly and is formed mainly by the left atrium, with a contribution from the right atrium. These anatomical terms do not simply mean the top and bottom of an upright diagram.
Surfaces and grooves
The anterior surface is mainly right ventricle; the diaphragmatic surface includes both ventricles; the left pulmonary surface is mainly left ventricle. The coronary sulcus separates atria from ventricles. Interventricular grooves mark the ventricular boundary and contain coronary vessels. Great vessels connect directly to chambers: venae cavae enter the right atrium; pulmonary veins enter the left atrium; the pulmonary trunk leaves the right ventricle; the aorta leaves the left ventricle.
5.2 Pericardium and heart-wall layers
The fibrous pericardium is a tough outer sac that limits excessive distension and anchors the heart. Serous pericardium has a parietal layer lining the sac and a visceral layer covering the heart. The small fluid-containing space between them reduces friction during movement.
Heart wall
| Layer | Structure and function |
|---|---|
| Epicardium | Visceral serous pericardium; outer covering with connective tissue, fat and vessels |
| Myocardium | Cardiac muscle; generates force for pumping |
| Endocardium | Endothelium and supporting tissue lining chambers and valves |
The left ventricular myocardium is thicker than the right because systemic circulation requires a higher pressure. Both ventricles normally eject the same average volume over time; wall thickness reflects workload, not a different long-term flow requirement.
Functional relevance
A large or rapidly accumulating pericardial effusion can compress chambers and impair filling. Diseased myocardium can weaken pumping or stiffen the ventricle. Damage to the endocardial/valvular surface can disturb flow and favour thrombosis.
5.3 Chambers and internal anatomy
Right atrium: receives systemic venous blood through the superior and inferior venae cavae and coronary venous blood through the coronary sinus. Pectinate muscles are prominent in the auricle. The interatrial septum contains the fossa ovalis, a remnant of fetal circulation. Right ventricle: receives blood through the tricuspid valve and ejects it through the pulmonary valve. Trabeculae carneae line much of its cavity. Papillary muscles and chordae tendineae support atrioventricular valve leaflets. The outflow tract leads into the pulmonary trunk. Left atrium: receives oxygenated blood, usually through four pulmonary veins, and delivers it through the mitral valve. Much of the atrial wall is smooth. Left ventricle: has a thick muscular wall, a relatively high-pressure chamber and an aortic outflow tract. The interventricular septum separates the ventricles and contains part of the conduction system.
Septa and the fibrous skeleton
The interatrial and interventricular septa normally prevent direct mixing between the two sides. Fibrous connective tissue supports valve rings and electrically insulates atrial muscle from ventricular muscle. The atrioventricular bundle provides the normal specialised conducting connection through this insulating region.
5.4 Valves: pressure-driven one-way flow
| Valve | Position | Prevents backflow into |
|---|---|---|
| Tricuspid | Right atrium to right ventricle | Right atrium |
| Pulmonary | Right ventricle to pulmonary trunk | Right ventricle |
| Mitral / bicuspid | Left atrium to left ventricle | Left atrium |
| Aortic | Left ventricle to aorta | Left ventricle |
Valves open and close passively according to pressure differences. A valve does not actively contract. Forward pressure opens it; reversal of the pressure gradient brings its leaflets together.
Chordae and papillary muscles
During ventricular systole, papillary muscles contract and keep chordae tense. This prevents atrioventricular leaflets from prolapsing into the atria. They do not pull the valves open. Semilunar valves have pocket-like cusps and do not have chordae tendineae.
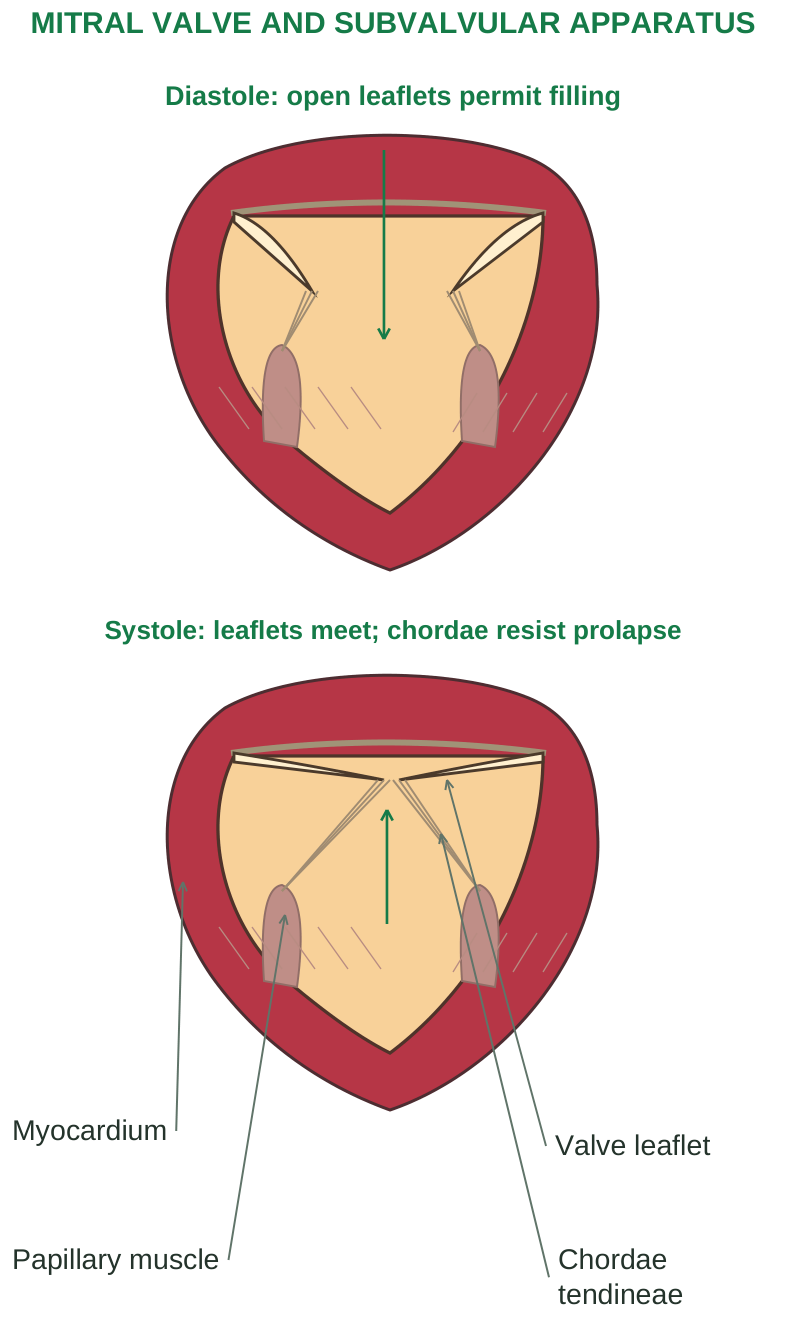
Diagram labels: MITRAL VALVE AND SUBVALVULAR APPARATUS; Diastole: open leaflets permit filling; Systole: leaflets meet; chordae resist prolapse; Valve leaflet; Chordae tendineae; Papillary muscle; Myocardium.
Valve disease
Stenosis narrows the opening, increasing the pressure required to drive forward flow. Regurgitation permits backward flow, creating volume loading and reducing effective forward output. Valve disease may produce murmurs and eventually contribute to ventricular dysfunction.
Exam distinction The valve responds to a pressure gradient. Papillary muscles stabilise AV valve closure; they are not the main force closing the valve.
5.5 Pulmonary and systemic circulation
The circulation is a closed double circuit. Blood passes through the heart twice in a complete pulmonary-systemic journey. The right and left pumps operate in series, so a persistent imbalance between their outputs causes blood accumulation in one circuit.
Trace the complete route
Step 1: systemic veins return oxygen-poor blood to the right atrium through the venae cavae.
Step 2: the tricuspid valve directs blood into the right ventricle; ventricular contraction ejects it through the pulmonary valve into the pulmonary trunk and pulmonary arteries.
Step 3: blood reaches pulmonary capillaries. Carbon dioxide leaves the blood and oxygen enters it across the respiratory membrane.
Step 4: pulmonary veins return oxygen-rich blood to the left atrium, and the mitral valve directs it into the left ventricle.
Step 5: the left ventricle ejects through the aortic valve into systemic arteries. Tissue capillaries exchange gases, nutrients, water and wastes; venules and veins complete the return.
Compare the circuits
| Feature | Pulmonary | Systemic |
|---|---|---|
| Pump | Right ventricle | Left ventricle |
| Main role | Gas exchange | Tissue delivery and waste transport |
| Typical pressure/resistance | Lower | Higher |
| Arterial blood | Relatively oxygen-poor | Relatively oxygen-rich |
An artery carries blood away from the heart and a vein carries it towards the heart. Oxygen content does not define either vessel type. The pulmonary vessels are the important adult exception to the usual oxygenation association.
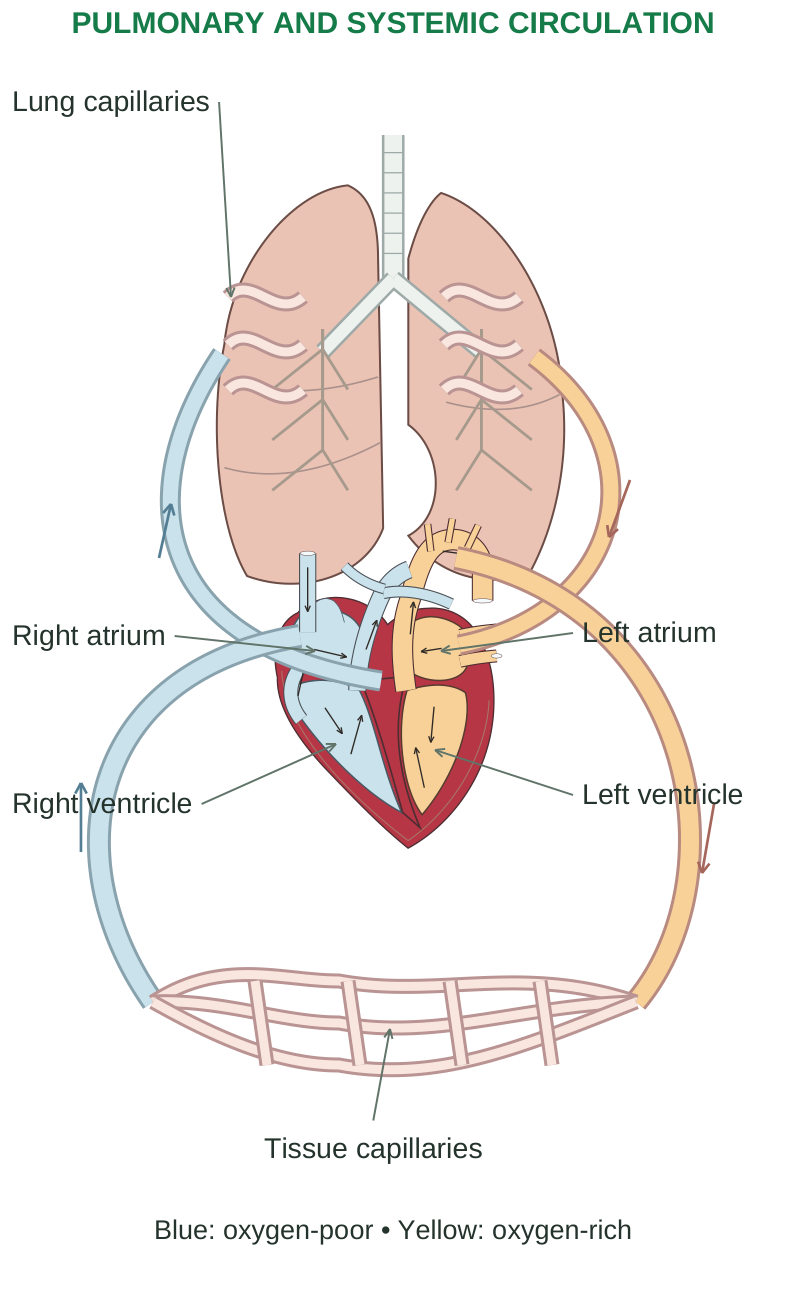
Diagram labels: PULMONARY AND SYSTEMIC CIRCULATION; Lung capillaries; Right atrium; Right ventricle; Left atrium; Left ventricle; Tissue capillaries; Blue: oxygen-poor; Yellow: oxygen-rich.
5.6 Coronary circulation
The right and left coronary arteries arise from the aortic root near the aortic valve. They supply the myocardium, which cannot receive enough oxygen by diffusion from blood inside the chambers alone.
Main arterial territories
The left coronary artery commonly divides into the anterior interventricular artery (left anterior descending, LAD) and circumflex artery. The LAD supplies much of the anterior left ventricle and anterior septum. The circumflex supplies lateral/posterolateral regions. The right coronary artery supplies right-sided structures and, in many people, nodal tissue and part of the inferior/posterior left ventricle. Dominance depends on the artery giving rise to the posterior interventricular artery; individual anatomy varies.
Venous blood returns mainly through cardiac veins into the coronary sinus, which enters the right atrium. Some small veins drain directly into chambers.
Why diastole matters
Left ventricular coronary flow occurs predominantly during diastole because systolic contraction compresses intramyocardial vessels. Tachycardia both increases oxygen demand and shortens the diastolic perfusion period. A fall in aortic diastolic pressure or a rise in ventricular filling pressure can also reduce the coronary perfusion gradient.
5.7 Arteries and arterioles
Most larger arteries have three coats: tunica intima, tunica media and tunica adventitia. The intima includes endothelium and supporting tissue; the media contains smooth muscle and elastic elements; the adventitia provides connective-tissue support. Large vessels may have vasa vasorum supplying their outer wall. Elastic arteries, such as the aorta, expand during systole and recoil during diastole. This stores energy and smooths pulsatile flow. Muscular arteries distribute blood to organs. Arterioles contain smooth muscle and are major adjustable resistance vessels.
Radius and resistance
Resistance increases as a vessel becomes narrower. For ideal laminar flow, R = 8ηL / (πr^4), where η is viscosity, L length and r radius. The fourth-power relation explains why modest arteriolar constriction can greatly reduce flow. Real vessels are compliant and branching, so the equation is a teaching model rather than an exact description of every vascular bed. Endothelium also regulates tone: nitric oxide favours relaxation, while mediators such as endothelin can favour constriction. It influences permeability, inflammation and clotting; it is not merely an inert lining.
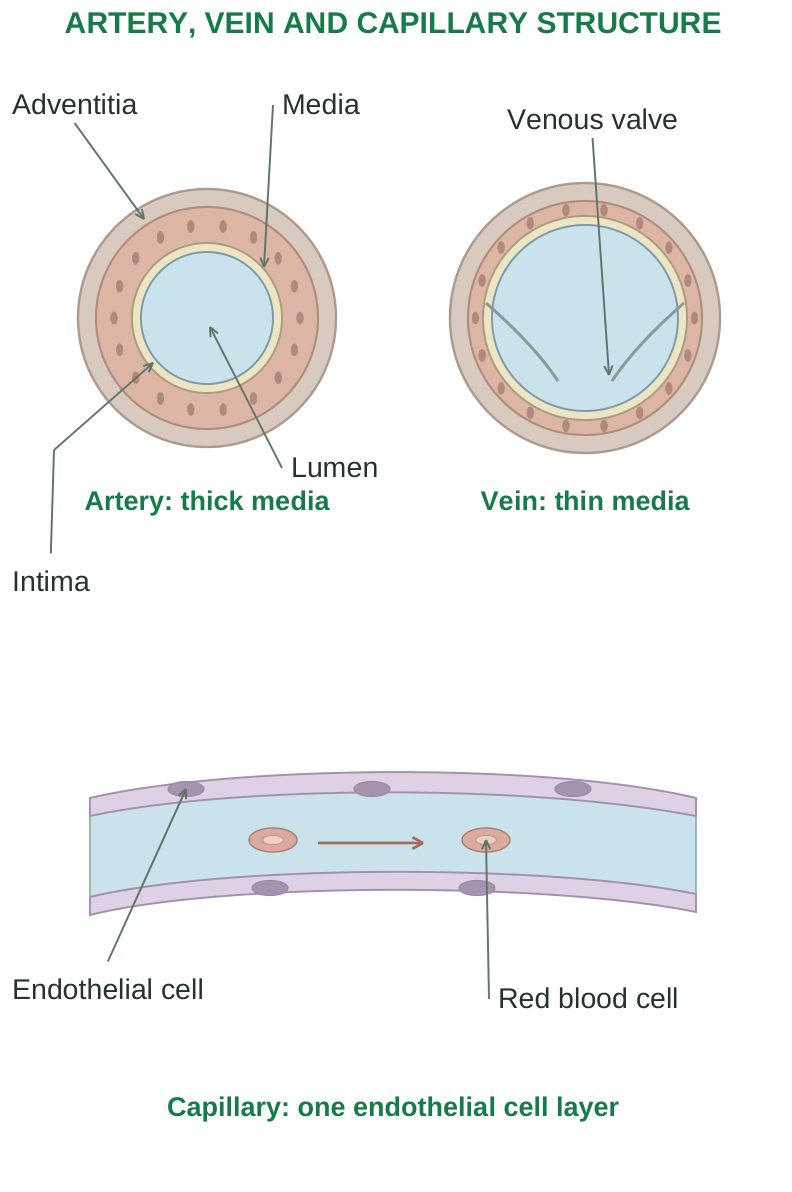
Diagram labels: ARTERY, VEIN AND CAPILLARY STRUCTURE; Artery: thick media; Vein: thin media; Adventitia; Media; Intima; Lumen; Venous valve; Endothelial cell; Red blood cell; Capillary: one endothelial cell layer.
5.8 Veins, valves and venous return
Veins generally have thinner walls and a larger, more compliant lumen than corresponding arteries. Their lower-pressure system holds a large fraction of the blood volume. Venules collect blood from capillaries, and larger veins return it to the heart. Valves, especially in limb veins, reduce backward flow. Not all veins have valves. The skeletal-muscle pump compresses veins during movement; valves guide the displaced blood towards the heart. The respiratory pump uses pressure changes during inspiration to favour venous return. Sympathetic venoconstriction reduces venous capacity and moves blood towards the central circulation. Venous return also depends on blood volume and the pressure gradient towards the right atrium. Standing still promotes dependent pooling; muscle activity assists return.
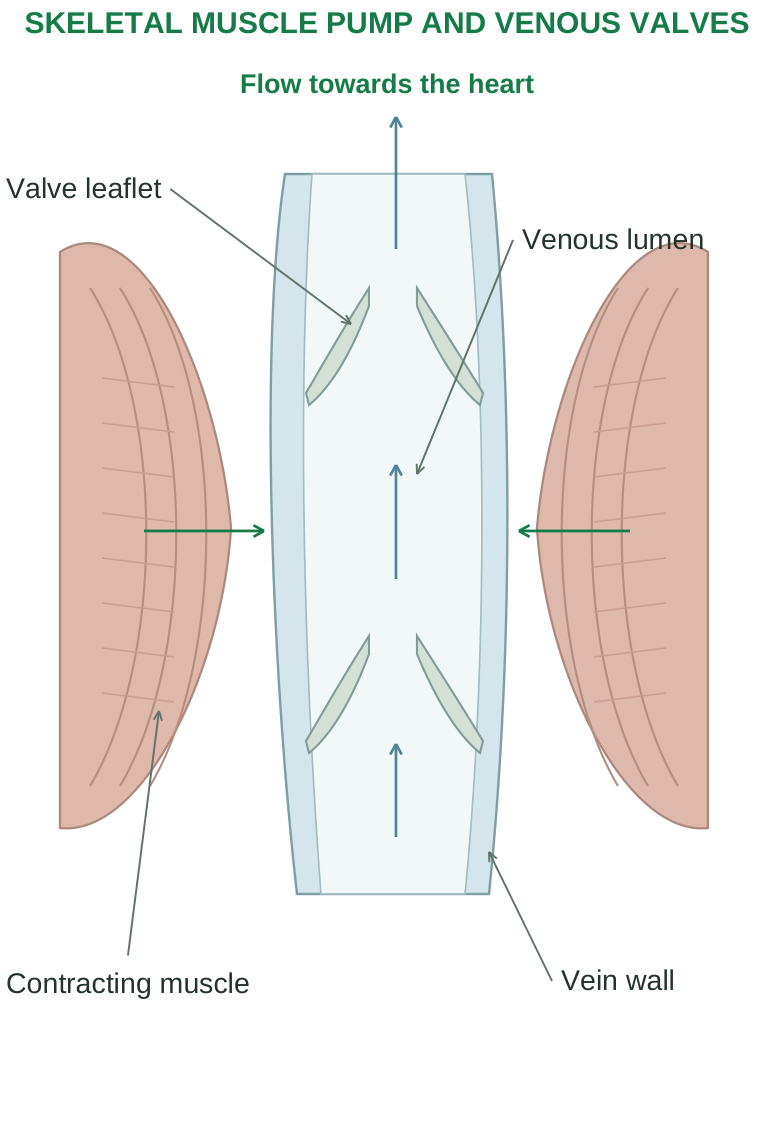
Diagram labels: SKELETAL MUSCLE PUMP AND VENOUS VALVES; Flow towards the heart; Valve leaflet; Venous lumen; Contracting muscle; Vein wall.
5.9 Capillaries and exchange
Capillaries consist mainly of a single endothelial layer, a basement membrane and associated supporting cells such as pericytes. Their thin wall and large total surface area permit exchange. Red cells pass through many capillaries in single file.
| Type | Barrier features | Examples |
|---|---|---|
| Continuous | Relatively uninterrupted endothelium | Muscle, skin; specialised tight barrier in brain |
| Fenestrated | Endothelial pores enhance exchange | Kidney, intestine, endocrine organs |
| Sinusoidal / discontinuous | Wider lumen and larger gaps | Liver, spleen, bone marrow |
Diffusion is central for gas and small-solute exchange. Hydrostatic and oncotic forces influence water movement. Net filtration varies with the tissue and endothelial glycocalyx; lymphatics return excess filtered fluid and proteins. Avoid assuming that all capillaries reabsorb most fluid at their venous end.
Oedema can follow raised venous/capillary pressure, reduced plasma oncotic pressure, increased permeability or impaired lymph drainage. These causes explain why heart failure, low albumin and inflammation can produce swelling by different mechanisms.
5.10 Cardiac conducting system
Specialised cardiac cells generate and distribute impulses. Automaticity means spontaneous impulse generation; excitability means response to a stimulus; conductivity means impulse propagation; contractility means force generation. These properties are related but are not interchangeable.
Normal activation sequence
Step 1: the sinoatrial (SA) node, near the superior vena cava-right atrial junction, initiates the normal rhythm.
Step 2: excitation spreads across atrial muscle and towards the atrioventricular (AV) node, activating the atria.
Step 3: relatively slow AV nodal conduction provides a delay so atrial contraction can assist ventricular filling before ventricular activation.
Step 4: the AV bundle crosses the fibrous skeleton and divides into right and left bundle branches in the interventricular septum.
Step 5: Purkinje fibres distribute excitation rapidly through ventricular muscle, coordinating contraction and ejection.
Pacemaker hierarchy
The SA node normally dominates because its spontaneous depolarisation reaches threshold fastest. If it fails or impulses cannot reach the ventricles, a subsidiary pacemaker may produce an escape rhythm, generally at a slower rate. An ectopic focus can generate impulses outside the normal pacemaker.
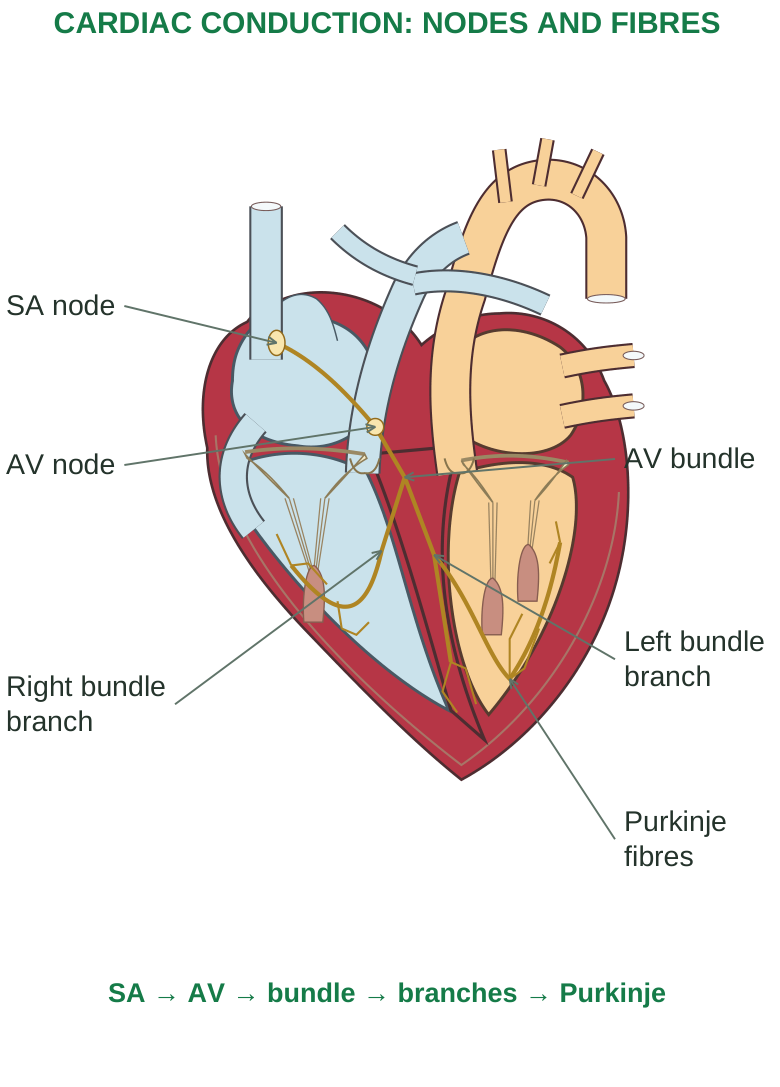
Diagram labels: CARDIAC CONDUCTION: NODES AND FIBRES; SA node; AV node; Right bundle branch; AV bundle; Left bundle branch; Purkinje fibres; SA → AV → bundle → branches → Purkinje.
5.11 Electrical basis of the heartbeat
Nodal pacemaker cells
There is no stable resting potential. Gradual phase-4 depolarisation involves inward pacemaker currents, reduced outward potassium current and calcium-channel activity. Calcium entry drives the nodal upstroke; potassium efflux produces repolarisation. The next spontaneous depolarisation starts another cycle.
Ventricular contractile cells
The rapid upstroke is mainly sodium entry. A brief early repolarisation is followed by a plateau, during which calcium entry and outward potassium currents balance. Later potassium efflux returns the membrane towards its resting potential. Calcium entry triggers additional calcium release from the sarcoplasmic reticulum. Calcium binds troponin, permits actin-myosin interaction and generates contraction. Calcium removal supports relaxation. The long refractory period prevents sustained tetanic contraction and allows the heart to refill between effective beats.
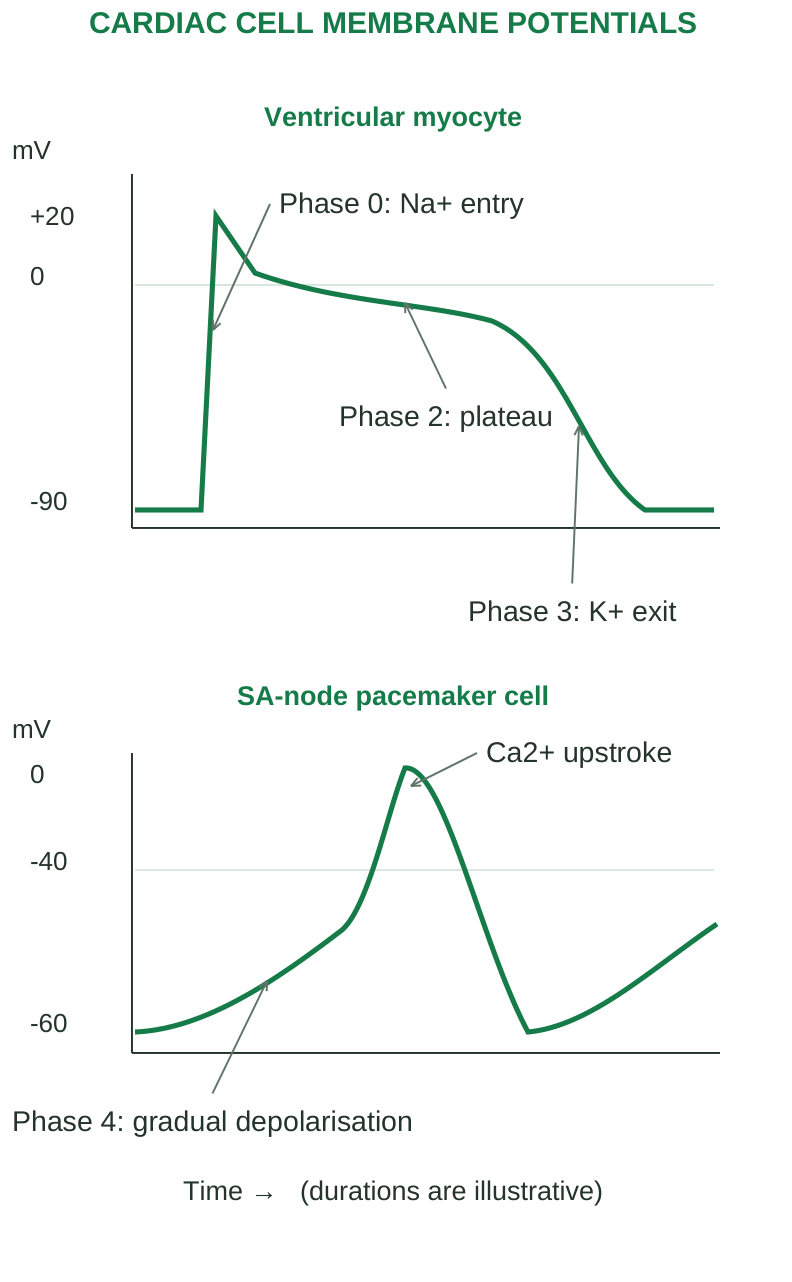
Diagram labels: CARDIAC CELL MEMBRANE POTENTIALS; Ventricular myocyte; mV; SA-node pacemaker cell; mV; +20; 0; -90; Phase 0: Na+ entry; Phase 2: plateau; Phase 3: K+ exit; 0; -40; -60; Phase 4: gradual depolarisation; Ca2+ upstroke; Time → (durations are illustrative).
Electrical versus mechanical events
Depolarisation precedes contraction; repolarisation precedes or accompanies relaxation. A surface ECG records the summed electrical activity, not the pressure or strength of contraction. A heart can have electrical activity with inadequate mechanical pumping.
5.12 Autonomic control of heartbeat
The heart can generate beats without external motor commands. Autonomic nerves modify pacemaker activity, AV conduction and myocardial performance according to physiological needs.
| Control | Main transmitter/receptor | Major effects |
|---|---|---|
| Sympathetic | Noradrenaline at β1 receptors | Increases rate, AV conduction, contractility and relaxation rate |
| Parasympathetic | Acetylcholine at M2 receptors | Slows SA rate and AV conduction; stronger effects in atria/nodes than ventricles |
Sympathetic β1 activation increases cyclic AMP and calcium handling. The SA node reaches threshold sooner, while ventricular contraction becomes stronger. Vagal activity increases potassium conductance and reduces pacemaker signalling, slowing impulse formation and conduction. Resting vagal tone usually keeps the heart rate below the intrinsic SA nodal rate. Both divisions can change activity rapidly; one does not simply switch on whenever the other switches off.
Reflex and higher-centre control
Brainstem cardiovascular centres integrate arterial baroreceptor input with other signals. Higher centres, emotion, pain and exercise can influence autonomic output. Circulating adrenaline also stimulates the heart. Temperature and electrolyte disturbances affect rate and conduction independently of nerve activity.
5.13 Heart rate and integrated responses
A typical resting adult rate is around 60–100 beats/min, with context important. Trained people may have a lower resting rate without disease. Tachycardia or bradycardia describes rate; it does not by itself establish the underlying rhythm or clinical significance.
During dynamic exercise
Parasympathetic withdrawal and sympathetic activation raise rate and contractility. Muscle/respiratory pumps improve venous return. Active muscle vasodilates, so flow is redistributed while cardiac output increases. The pressure response depends on the type and intensity of exercise.
During standing
Gravity initially reduces central venous return, ventricular filling and stroke volume. Baroreceptor-mediated tachycardia and vasoconstriction support arterial pressure. Failure of these responses can contribute to postural symptoms.
Key distinction Chronotropy concerns rate; dromotropy concerns conduction; inotropy concerns contraction strength; lusitropy concerns relaxation.
5.14 Cardiac output and its determinants
Cardiac output (CO) is the volume ejected by one ventricle in one minute. Right and left ventricular outputs normally match on average. Do not add them to obtain the systemic cardiac output. CO = heart rate (HR) × stroke volume (SV). If HR is 70 beats/min and SV is 70 mL/beat, CO = 4,900 mL/min = 4.9 L/min. This is an illustrative resting example, not a fixed value for every individual. SV = end-diastolic volume (EDV) – end-systolic volume (ESV). EDV is the ventricular volume before systole; ESV is the volume remaining after ejection.
Factors controlling stroke volume
| Factor | Meaning | Typical effect within physiological limits |
|---|---|---|
| Preload | Stretch related to end-diastolic filling | Greater filling can increase force and SV |
| Contractility | Force at a given preload/afterload | Increased contractility reduces ESV and raises SV |
| Afterload | Load opposing ejection | Increased load can raise ESV and reduce SV |
Ejection fraction (EF) = SV / EDV × 100%. It is the fraction of the filled ventricular volume ejected, not the fraction of total body blood pumped. A preserved EF does not guarantee normal filling or exclude heart failure.
Cardiac index and reserve
Cardiac index = CO / body surface area, commonly expressed as L/min/m^2. It permits comparison between people of different size. Cardiac reserve is the ability to increase output above resting requirements; disease may reduce reserve before obvious resting symptoms develop.
5.15 Frank-Starling law: length-dependent autoregulation
The Frank-Starling law of the heart describes the relationship between initial myocardial fibre length and the force of contraction. Greater venous return increases ventricular filling and stretches myocardial fibres. Within an appropriate physiological range, this increases force generation and stroke volume. It helps the heart match ejection to the returning blood and helps balance the two ventricles. This mechanism is distinct from sympathetic stimulation: sympathetic activation changes contractility, whereas increased filling changes initial fibre length. Excessive dilatation or severe myocardial dysfunction may limit the useful response.
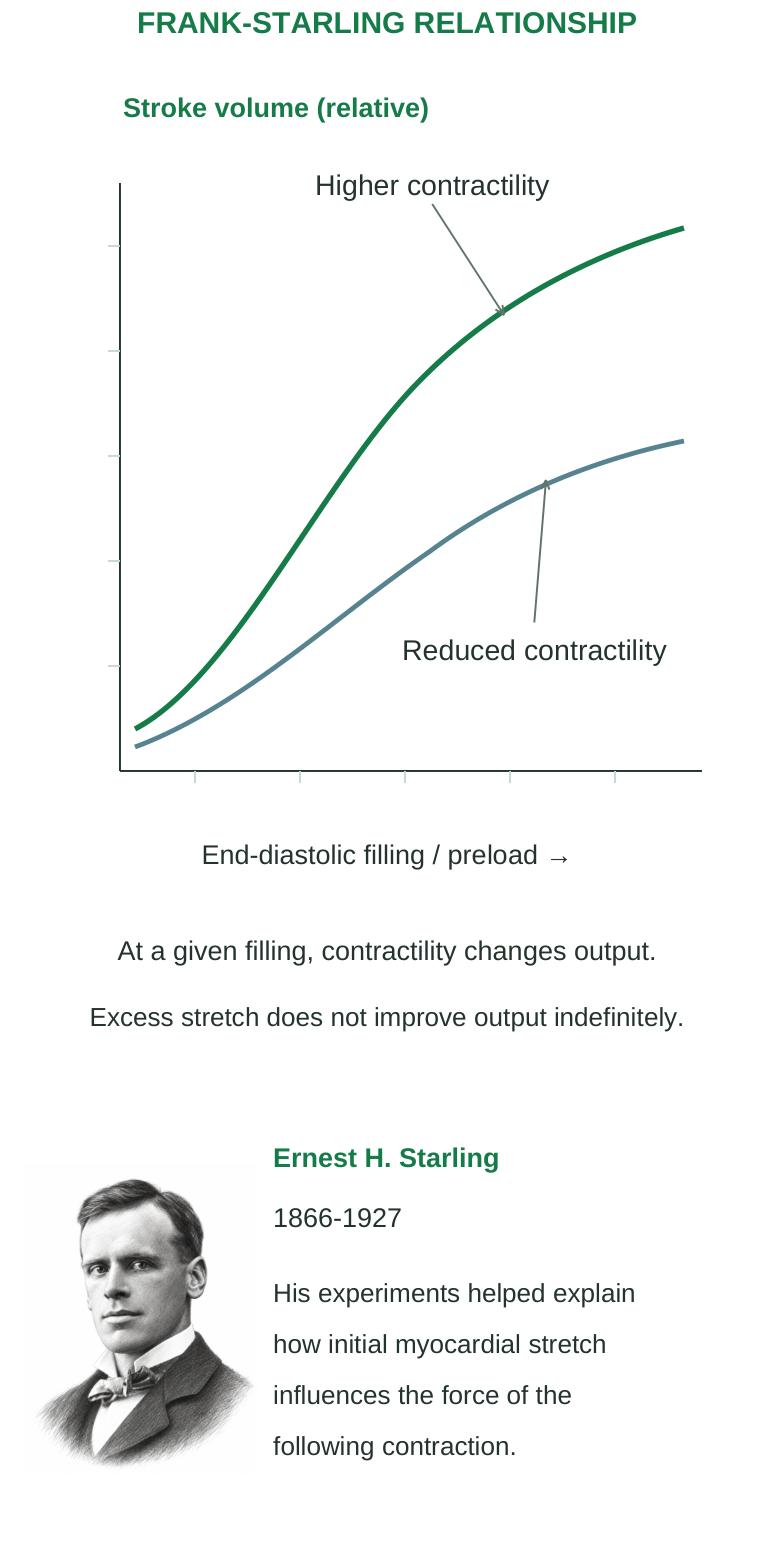
Diagram labels: FRANK-STARLING RELATIONSHIP; Stroke volume (relative); End-diastolic filling / preload →; Higher contractility; Reduced contractility; At a given filling, contractility changes output; Excess stretch does not improve output indefinitely; Ernest H. Starling; 1866–1927; His experiments helped explain how initial myocardial stretch influences the force of the following contraction.
Why faster is not always better
Moderate increases in rate can raise CO. Very high rates shorten diastole and can reduce filling and coronary perfusion enough to lower stroke volume. A poorly coordinated rhythm may therefore produce a rapid pulse yet inadequate output.
Numerical example
EDV = 125 mL, ESV = 50 mL, HR = 72/min. SV = 75 mL/beat; EF = 75/125 × 100 = 60%; CO = 72 × 75 = 5,400 mL/min = 5.4 L/min. Show each unit and convert mL to L only after multiplication.
5.16 Cardiac cycle: pressure, valves and volume
The cardiac cycle includes the electrical and mechanical events of one heartbeat. Atrial and ventricular systole/diastole overlap; the entire heart is not alternately contracting and relaxing as a single chamber. Cycle duration = 60 / HR seconds. At 75 beats/min, one cycle lasts 0.8 s. Phase durations change with rate, especially diastole, so textbook timing values are illustrative rather than universal constants.
Step 1: ventricular filling
Ventricular pressure is below atrial pressure; AV valves are open and semilunar valves closed. Blood flows into relaxed ventricles. Most resting filling is passive; atrial systole adds the final contribution, which becomes especially important in some stiff ventricles.
Step 2: isovolumetric contraction
Ventricular activation initiates contraction. Rising ventricular pressure closes AV valves. Semilunar valves have not yet opened, so all valves are closed and volume remains at EDV while pressure rises.
Step 3: ventricular ejection
When ventricular pressure exceeds pressure in the outflow artery, the semilunar valve opens. Ventricular volume falls as blood is ejected. AV valves remain closed. Ejection slows as contraction wanes; blood left at the end is ESV.
Step 4: isovolumetric relaxation
Falling ventricular pressure allows semilunar valves to close. AV valves initially remain closed. With all valves shut, pressure falls without a change in ESV. AV valves open once ventricular pressure falls below atrial pressure, beginning the next filling phase.
Reading pressure and volume together
An open valve permits flow only along its forward pressure gradient. The same ventricular volume may occur at very different pressures during different phases. Isovolumetric does not mean the muscle is inactive; it means chamber volume is not changing.
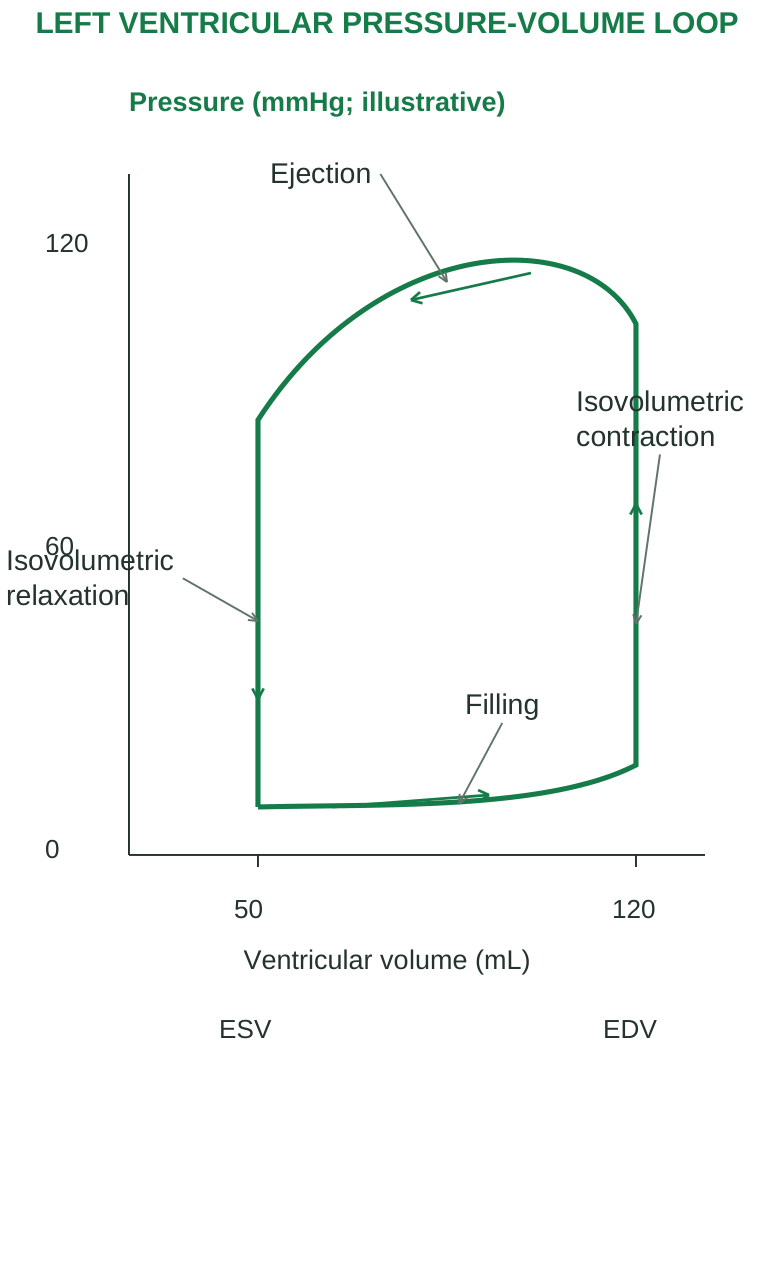
Diagram labels: LEFT VENTRICULAR PRESSURE-VOLUME LOOP; Pressure (mmHg; illustrative); Ventricular volume (mL); 0; 60; 120; 50; 120; Ejection; Isovolumetric contraction; Isovolumetric relaxation; Filling; ESV; EDV.
5.17 Heart sounds and mechanical events
S1 occurs around closure of the AV valves at the beginning of ventricular systole. S2 occurs around closure of the semilunar valves at the beginning of ventricular diastole. Valve closure sets surrounding blood and tissues into vibration; the sound is not just two rigid surfaces striking. Physiological splitting of S2 can occur with inspiration because pulmonary valve closure is delayed relative to aortic closure. S3 relates to early rapid filling; its significance depends on age and context. S4 relates to atrial contraction into a relatively stiff ventricle and requires organised atrial contraction.
Murmurs
Turbulent flow may create a murmur. Timing, location and clinical context help relate it to stenosis, regurgitation or increased flow. A systolic murmur does not automatically mean one specific valve defect.
Recall table
| Phase | AV valves | Semilunar valves | Ventricular volume |
|---|---|---|---|
| Filling | Open | Closed | Rises |
| Isovolumetric contraction | Closed | Closed | Constant at EDV |
| Ejection | Closed | Open | Falls |
| Isovolumetric relaxation | Closed | Closed | Constant at ESV |
5.18 Blood pressure and haemodynamics
Blood pressure is the force exerted by blood on a vessel wall, usually expressed as mmHg. In routine clinical use it commonly refers to systemic arterial pressure measured at an arm. Pulmonary, capillary and venous pressures have different magnitudes and functions. Systolic pressure (SBP) is the peak arterial pressure during ventricular ejection. Diastolic pressure (DBP) is the lowest pressure before the next beat. Elastic recoil maintains arterial flow during diastole. Pulse pressure = SBP – DBP; it is influenced by stroke volume and arterial compliance. Mean arterial pressure (MAP) is the time-average arterial pressure, not simply the arithmetic mean of SBP and DBP. At a usual resting rate, MAP ≈ DBP + (SBP – DBP)/3. The approximation changes when waveform shape or heart rate changes markedly.
Flow requires a pressure difference
Flow Q = ΔP / R. A higher driving pressure or lower resistance increases flow if other conditions remain comparable. For systemic circulation, MAP – right atrial pressure ≈ CO × systemic vascular resistance (SVR). Neglecting the normally small right atrial pressure gives the useful simplified relation MAP ≈ CO × SVR.
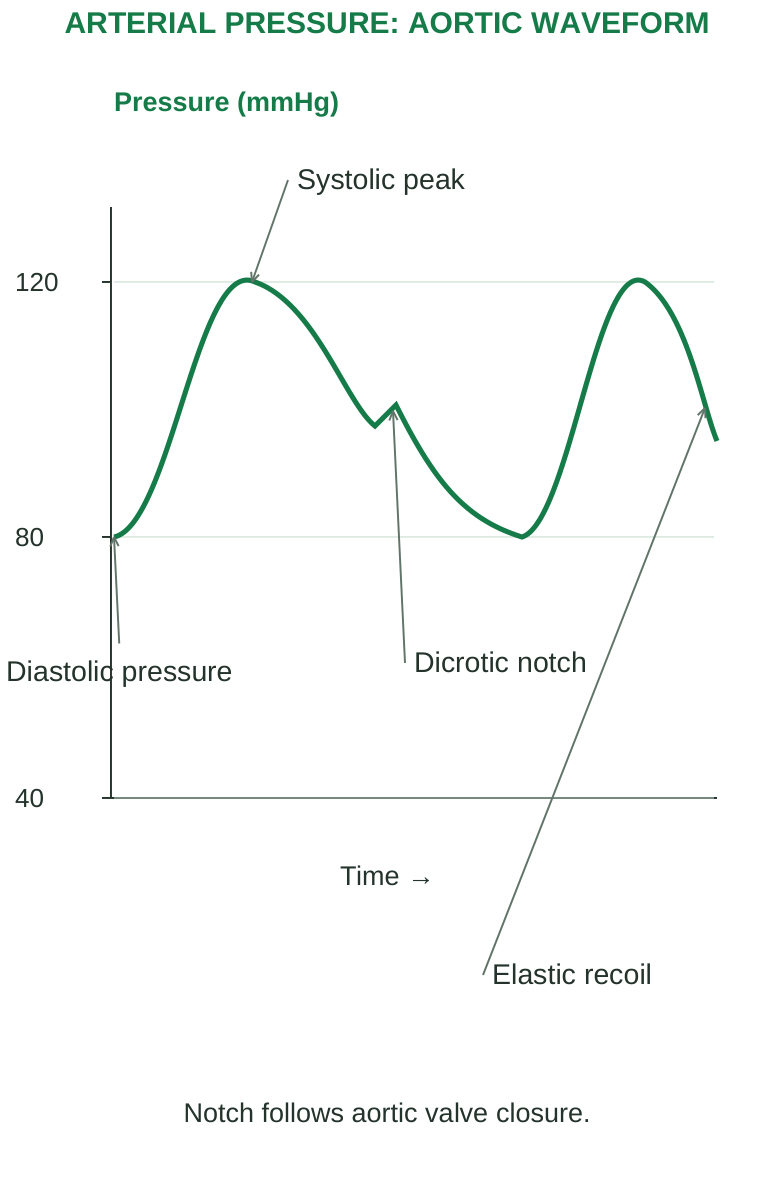
Diagram labels: ARTERIAL PRESSURE: AORTIC WAVEFORM; Pressure (mmHg); 120; 80; 40; Systolic peak; Diastolic pressure; Dicrotic notch; Elastic recoil; Time →; Notch follows aortic valve closure.
Important variables
| Variable | How it can influence pressure/flow |
|---|---|
| Cardiac output | More effective pumping tends to raise flow and pressure |
| Arteriolar radius | Constriction raises resistance; dilation lowers it |
| Blood volume | Changes venous return and filling |
| Arterial compliance | Stiffer arteries generally increase pulsatile pressure |
| Viscosity | Greater viscosity increases resistance under comparable conditions |
A high pressure does not ensure good local flow. A severely narrowed coronary artery may restrict supply even when arm pressure is elevated.
5.19 Short-term blood-pressure regulation
Arterial baroreceptors are stretch-sensitive endings in the carotid sinus and aortic arch. Their firing informs the brainstem about pressure changes. Carotid signals travel mainly through cranial nerve IX; aortic signals through X.
When arterial pressure rises
Step 1: increased stretch increases baroreceptor firing.
Step 2: brainstem integration reduces sympathetic drive and increases cardiac vagal influence.
Step 3: heart rate, contractility and vascular tone fall as appropriate, limiting the pressure rise.
When arterial pressure falls
Reduced firing shifts the response towards sympathetic activation and reduced vagal activity. Heart rate and contractility rise, arterioles constrict and veins mobilise blood towards the heart.
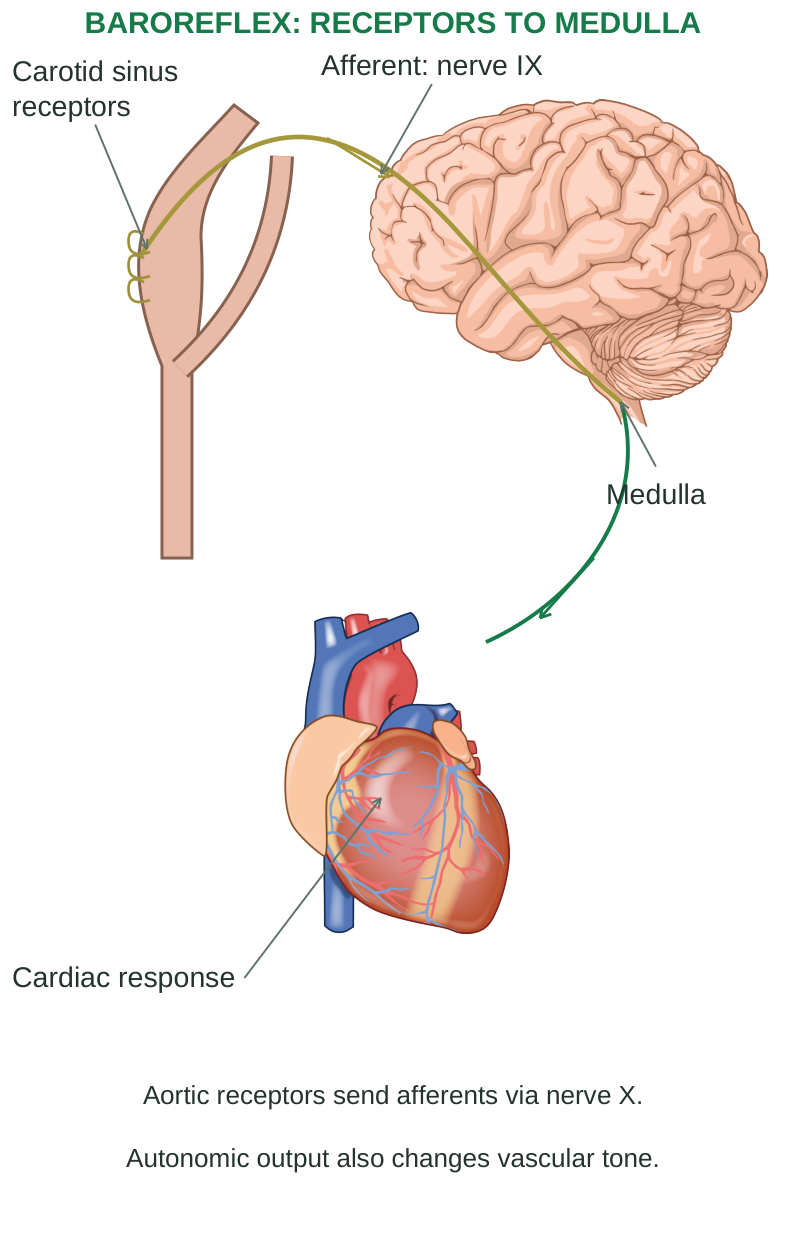
Diagram labels: BAROREFLEX: RECEPTORS TO MEDULLA; Carotid sinus receptors; Afferent: nerve IX; Medulla; Cardiac response; Aortic receptors send afferents via nerve X; Autonomic output also changes vascular tone.
The reflex acts quickly but can reset during sustained hypertension, so it does not provide the sole long-term pressure control. Chemoreceptor responses to oxygen, carbon dioxide and pH changes can also influence cardiovascular regulation, especially during severe disturbances.
5.20 Renal, hormonal and local regulation
The kidneys influence long-term arterial pressure by controlling sodium balance, extracellular fluid volume and thus venous return. Pressure-dependent sodium excretion helps link blood pressure with renal output; impaired renal regulation can sustain hypertension.
Renin-angiotensin-aldosterone system
Step 1: reduced renal perfusion, reduced distal sodium-chloride delivery or sympathetic β1 stimulation can promote renin release.
Step 2: renin acts on angiotensinogen to form angiotensin I; angiotensin-converting enzyme contributes to formation of angiotensin II.
Step 3: angiotensin II causes vasoconstriction and supports sodium retention, thirst and aldosterone release.
Step 4: aldosterone increases renal sodium retention. Water follows retained solute, supporting circulating volume and pressure.
Other controls
Antidiuretic hormone (vasopressin) favours water conservation; higher concentrations also have vasoconstrictor effects. Atrial natriuretic peptide responds to atrial stretch and favours sodium/water loss, opposing volume expansion. Local metabolites and myogenic responses adjust organ blood flow according to tissue conditions. Nitric oxide helps regulate vascular tone. A useful distinction is systemic pressure control versus local flow regulation. An exercising muscle can vasodilate while sympathetic tone constricts other beds. A systemic hormonal response need not produce identical flow changes in every organ.
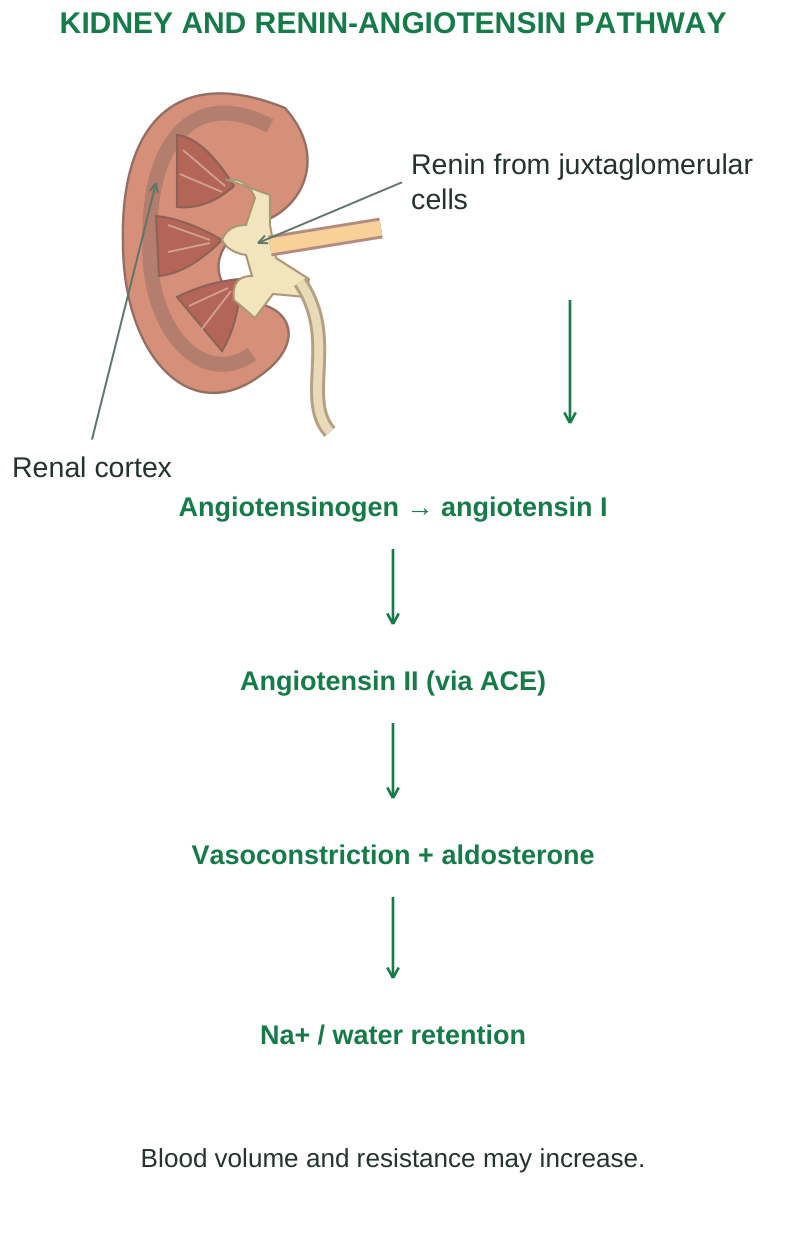
Diagram labels: KIDNEY AND RENIN-ANGIOTENSIN PATHWAY; Renal cortex; Renin from juxtaglomerular cells; Angiotensinogen → angiotensin I; Angiotensin II (via ACE); Vasoconstriction + aldosterone; Na+ / water retention; Blood volume and resistance may increase.
5.21 Pulse: formation, sites and assessment
The arterial pulse is a pressure/distension wave generated by ventricular ejection. It travels along arteries faster than the blood itself moves. Feeling a pulse is not feeling the same packet of blood moving from the heart to the wrist.
Common sites
| Site | Landmark/use |
|---|---|
| Radial | Wrist, thumb side; routine rate and rhythm |
| Carotid | Neck; central arterial pulse |
| Brachial | Medial arm/antecubital region; BP assessment |
| Femoral | Groin; proximal lower-limb circulation |
| Dorsalis pedis / posterior tibial | Foot/ankle; peripheral perfusion assessment |
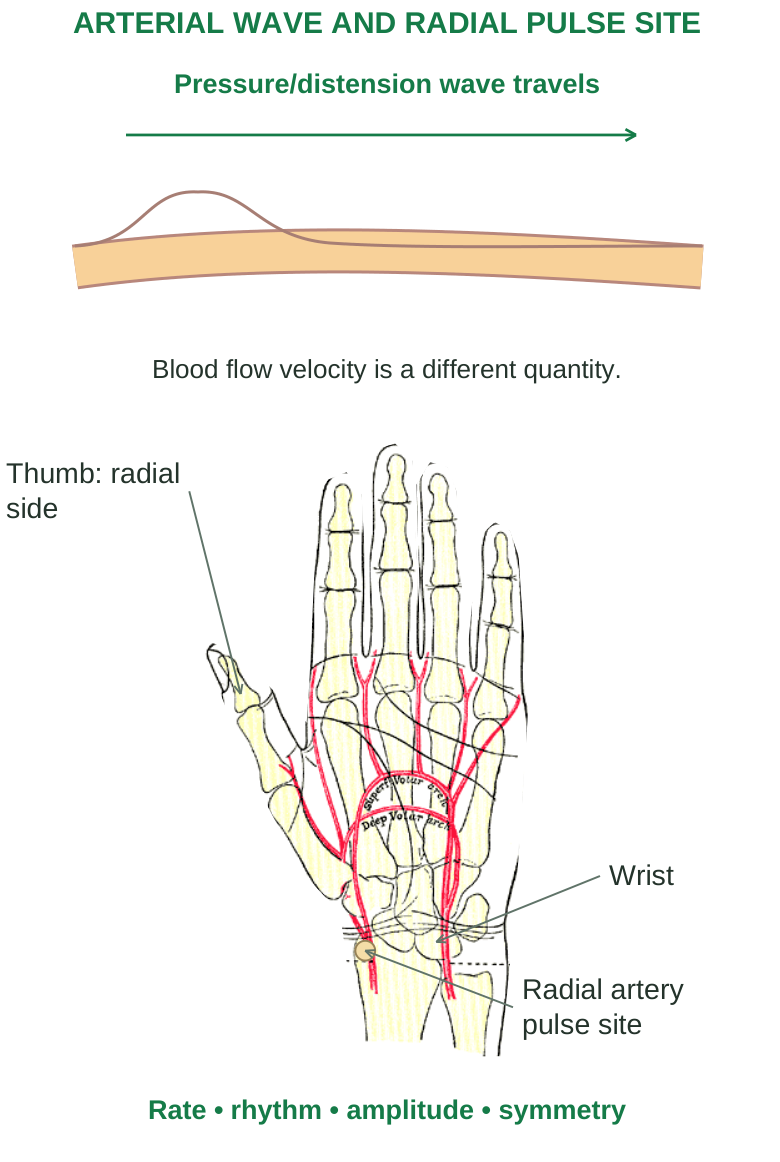
Diagram labels: ARTERIAL WAVE AND RADIAL PULSE SITE; Pressure/distension wave travels; Blood flow velocity is a different quantity; Thumb: radial side; Wrist; Radial artery pulse site; Rate; rhythm; amplitude; symmetry.
Assess rate, rhythm, amplitude, symmetry and character. Compare findings with the person’s state and other observations. A pulse deficit occurs when some heart contractions do not generate a palpable peripheral beat; the apical rate can then exceed the radial rate.
Blood-pressure measurement principle
A correctly fitted arm cuff temporarily compresses the brachial artery. With auscultation, the first Korotkoff sounds during deflation indicate systolic pressure; disappearance generally indicates diastolic pressure in adults. Rest, arm position, cuff size and repeated measurements affect accuracy. A single reading after activity is not sufficient to establish chronic hypertension.
5.22 Electrocardiogram: waves and meaning
An electrocardiogram (ECG) records voltage differences associated with the heart’s electrical activity using electrodes on the body. It is a surface electrical record, not a direct recording of blood flow, cardiac output or valve movement.
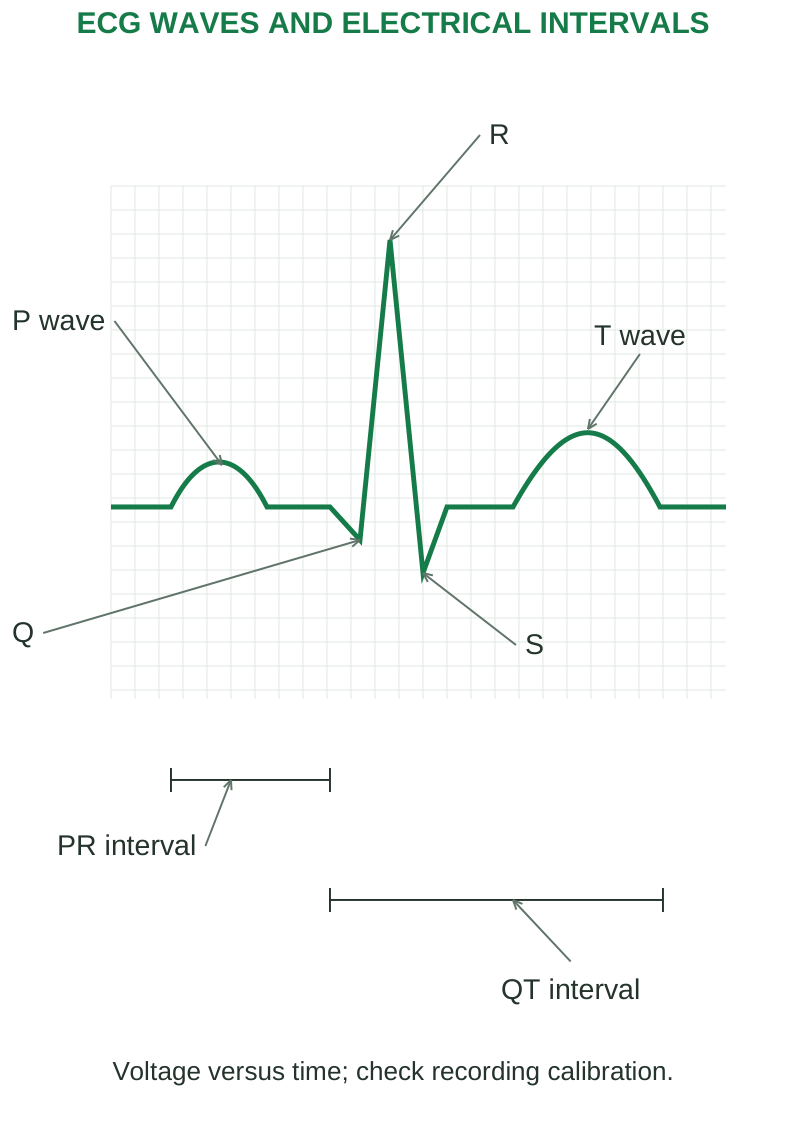
Diagram labels: ECG WAVES AND ELECTRICAL INTERVALS; P wave; Q; R; S; T wave; PR interval; QT interval; Voltage versus time; check recording calibration.
| Component | Main electrical event |
|---|---|
| P wave | Atrial depolarisation |
| QRS complex | Ventricular depolarisation |
| T wave | Ventricular repolarisation |
| PR interval | Start of atrial to start of ventricular depolarisation |
| ST segment | Period after ventricular depolarisation and before repolarisation is evident |
| QT interval | Overall duration of ventricular depolarisation and repolarisation |
Atrial repolarisation is usually hidden within the QRS complex. Electrical events precede their related mechanical events. A T wave should not be described as ventricular contraction.
Basic timing and calibration
At 25 mm/s, one small 1-mm horizontal square represents 0.04 s; a large 5-mm square represents 0.20 s. At standard gain of 10 mm/mV, a 10-mm vertical deflection represents 1 mV. Calibration must be checked before measuring intervals. For an adult, a typical PR interval is about 0.12–0.20 s and a normal QRS duration is under 0.12 s. QT depends on heart rate and requires appropriate correction for clinical interpretation; do not apply one unqualified fixed QT value to every rate.
5.23 Leads, rate calculation and basic reading
A lead is a view of electrical activity, not the physical electrode itself. A standard 12-lead ECG uses ten electrodes to provide twelve views: I, II, III, aVR, aVL, aVF and V1–V6. Limb leads view the frontal plane; chest leads provide horizontal-plane information.
Read in a consistent sequence
Step 1: check identity, recording quality, speed and gain.
Step 2: assess rate and whether R-R intervals are regular.
Step 3: inspect P waves and their relationship to QRS complexes.
Step 4: measure PR and QRS; assess QT with rate in mind.
Step 5: inspect ST/T changes across appropriate leads and relate them to the clinical context. For a regular rhythm at 25 mm/s, rate ≈ 300 / number of large squares between R peaks, or 1,500 / small squares. For an irregular rhythm, a longer timed sample is more useful; count QRS complexes in ten seconds and multiply by six.
Worked example
Four large squares separate successive R peaks: HR ≈ 300/4 = 75/min. Five large squares would indicate about 60/min. These shortcuts assume a standard recording speed and a suitable rhythm.
Common error A normal-looking tracing cannot by itself exclude all heart disease. Interpret ECG findings with symptoms, examination and appropriate investigations.
5.24 Hypertension: causes and mechanisms
Hypertension is persistently elevated arterial pressure. It increases vascular and cardiac workload and may remain asymptomatic despite ongoing organ damage. Diagnosis uses properly obtained repeated readings and the applicable clinical criteria; thresholds differ among guidelines and measurement settings. Primary hypertension has no single identifiable cause. Genetic susceptibility interacts with renal sodium handling, sympathetic activity, vascular function, environment and behaviour. Secondary hypertension results from an identifiable condition such as renal disease, renal artery stenosis, endocrine disease, obstructive sleep apnoea or certain medicines/substances.
Mechanism chain
Step 1: altered renal, neural or vascular regulation changes circulating volume, cardiac output and/or peripheral resistance.
Step 2: sustained arteriolar constriction and structural remodelling maintain increased resistance; endothelial dysfunction reduces appropriate vasodilation.
Step 3: pressure loading increases left ventricular wall stress and promotes hypertrophy.
Step 4: continuing vascular injury and cardiac remodelling damage target organs and may impair ventricular relaxation or systolic function. Salt intake, adiposity, inactivity, excess alcohol and tobacco exposure influence overall cardiovascular risk, although hypertension is not explained by one lifestyle factor alone. Age-related arterial stiffening can increase systolic pressure and widen pulse pressure.
5.25 Consequences and control principles
| Target | Important consequences |
|---|---|
| Heart | Hypertrophy, coronary disease and heart failure |
| Brain | Stroke and vascular injury |
| Kidneys | Progressive damage with further impairment of pressure regulation |
| Retina | Vascular damage and visual complications |
| Arteries | Accelerated vascular disease and increased aortic risk |
A reinforcing loop
Renal injury can reduce effective sodium excretion, sustaining volume and pressure. High pressure further damages renal vessels. Similarly, ventricular hypertrophy may initially compensate for workload but eventually impair filling and increase oxygen demand.
Recognition and management logic
Assessment distinguishes persistent elevation from temporary responses and considers secondary causes, target-organ damage and total cardiovascular risk. Healthy diet, sodium moderation, activity and weight management support control. Prescribed treatment may lower volume, vascular resistance or neurohormonal drive according to patient needs; drugs are not interchangeable simply because they lower a cuff reading. Hypertensive emergency means severe pressure elevation with acute target-organ injury, not merely an isolated high number. New neurological symptoms, chest pain or severe breathlessness require urgent assessment. The disease mechanism and organ effects should lead an examination answer; do not replace them with an unspecific list of medicines.
5.26 Cardiac arrhythmias: electrical disturbances
An arrhythmia is an abnormality of impulse formation, conduction, rhythm or rate. It may be transient and well tolerated or may seriously reduce cardiac output. Importance depends on the rhythm, duration, haemodynamic effect and underlying disease.
Main mechanisms
Abnormal automaticity: a pacemaker fires at an inappropriate rate, or an ectopic focus competes with the SA node. Triggered activity: afterdepolarisations following an action potential can initiate an extra impulse. Electrolyte changes, medicines and cellular calcium disturbances may contribute. Re-entry: an impulse repeatedly circulates through a conducting pathway and re-excites recovered tissue. A suitable circuit, differing conduction/recovery properties and unidirectional block can permit this mechanism. Conduction block: impulses are delayed or fail to pass through part of the normal pathway. An escape rhythm may maintain ventricular activity, but its rate may be insufficient.
Predisposing influences
Ischaemia, myocardial scar, chamber enlargement, hypoxia, autonomic imbalance, electrolyte disturbance and drug effects can alter conduction or excitability. A mechanism-based answer should explain why these conditions disturb electrical stability rather than merely naming them.
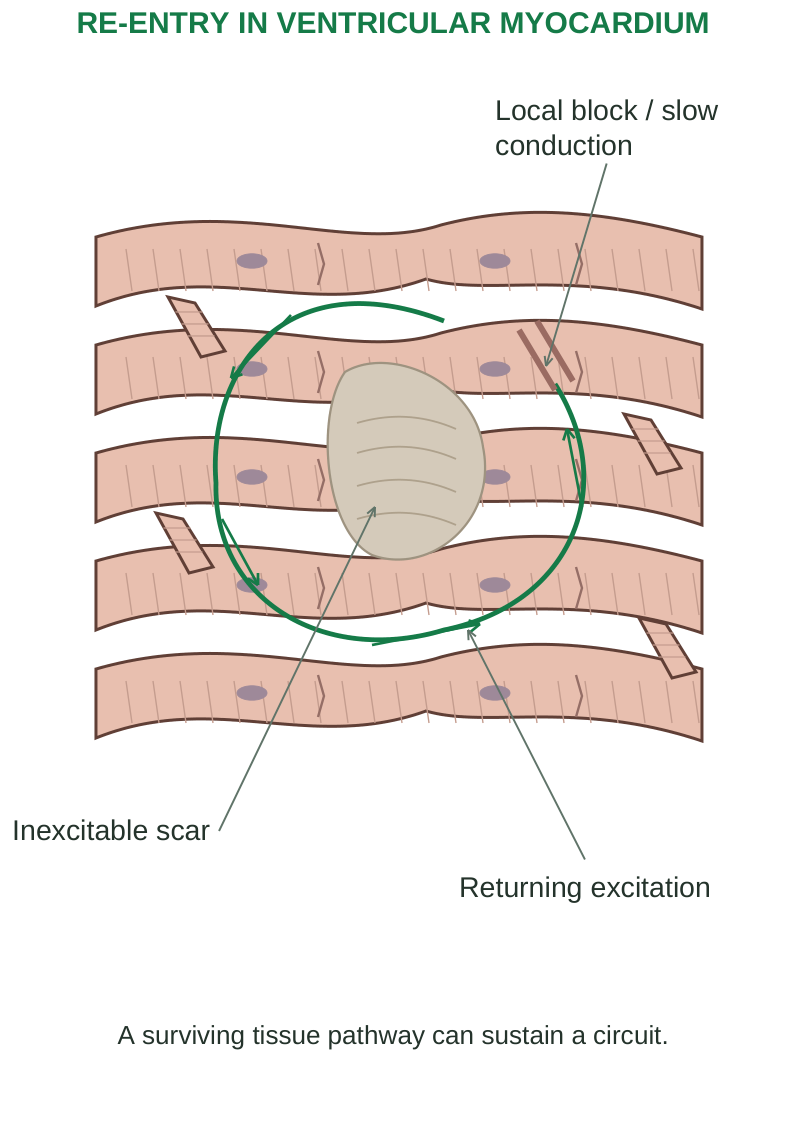
Diagram labels: RE-ENTRY IN VENTRICULAR MYOCARDIUM; Local block / slow conduction; Inexcitable scar; Returning excitation; A surviving tissue pathway can sustain a circuit.
5.27 Important rhythm patterns and consequences
| Pattern | Basic feature | Functional concern |
|---|---|---|
| Sinus tachycardia | SA-driven faster rate | Can be an appropriate response; persistent excess increases demand |
| Sinus bradycardia | SA-driven slower rate | May be physiological; can reduce output when inappropriate |
| Atrial fibrillation | Disorganised atrial activity; irregular ventricular rhythm | Loss of coordinated atrial contraction and thromboembolic risk |
| AV block | Impaired atrioventricular conduction | Dropped ventricular beats or atrioventricular dissociation |
| Ventricular tachycardia | Rapid ventricular-origin rhythm | Poor filling, reduced output and possible deterioration |
| Ventricular fibrillation | Chaotic ventricular activity | No effective coordinated ventricular pumping |
Why rhythm changes affect perfusion
Very slow rates may provide too few effective ejections. Very fast rhythms shorten filling time. Loss of atrial coordination matters particularly when ventricular filling is impaired. Ventricular dyssynchrony can weaken ejection even when rate is not extremely abnormal. Palpitations, dizziness, syncope, breathlessness or chest discomfort may occur, but some arrhythmias are detected incidentally. ECG and longer rhythm monitoring help identify the disturbance. Treatment depends on the rhythm and stability and may involve correction of a cause, medicines, pacing or other procedures. Ventricular fibrillation is an emergency requiring immediate resuscitation and defibrillation.
5.28 Congestive heart failure: pumping and filling
Heart failure is a syndrome in which structural or functional cardiac impairment prevents adequate output at normal filling pressures, or requires abnormally high filling pressures to maintain output. The heart has not necessarily stopped, and ejection fraction may be reduced or preserved.
Major causes
Myocardial infarction, long-standing hypertension, valve disease, cardiomyopathy and sustained arrhythmia can impair performance. A weak ventricle may not eject adequately; a stiff ventricle may not fill adequately. Both abnormalities can coexist.
Compensatory mechanisms
Step 1: reduced effective arterial perfusion activates sympathetic and renal neurohormonal responses.
Step 2: increased rate, contractility and vasoconstriction temporarily support pressure, while sodium/water retention increases filling.
Step 3: persistent volume and pressure loading raise wall stress, oxygen demand and congestion.
Step 4: progressive hypertrophy, dilatation, fibrosis and adverse remodelling worsen cardiac function. Initially helpful compensation can therefore become harmful. Retained fluid does not necessarily improve useful forward output; it can mainly increase venous pressure and oedema.
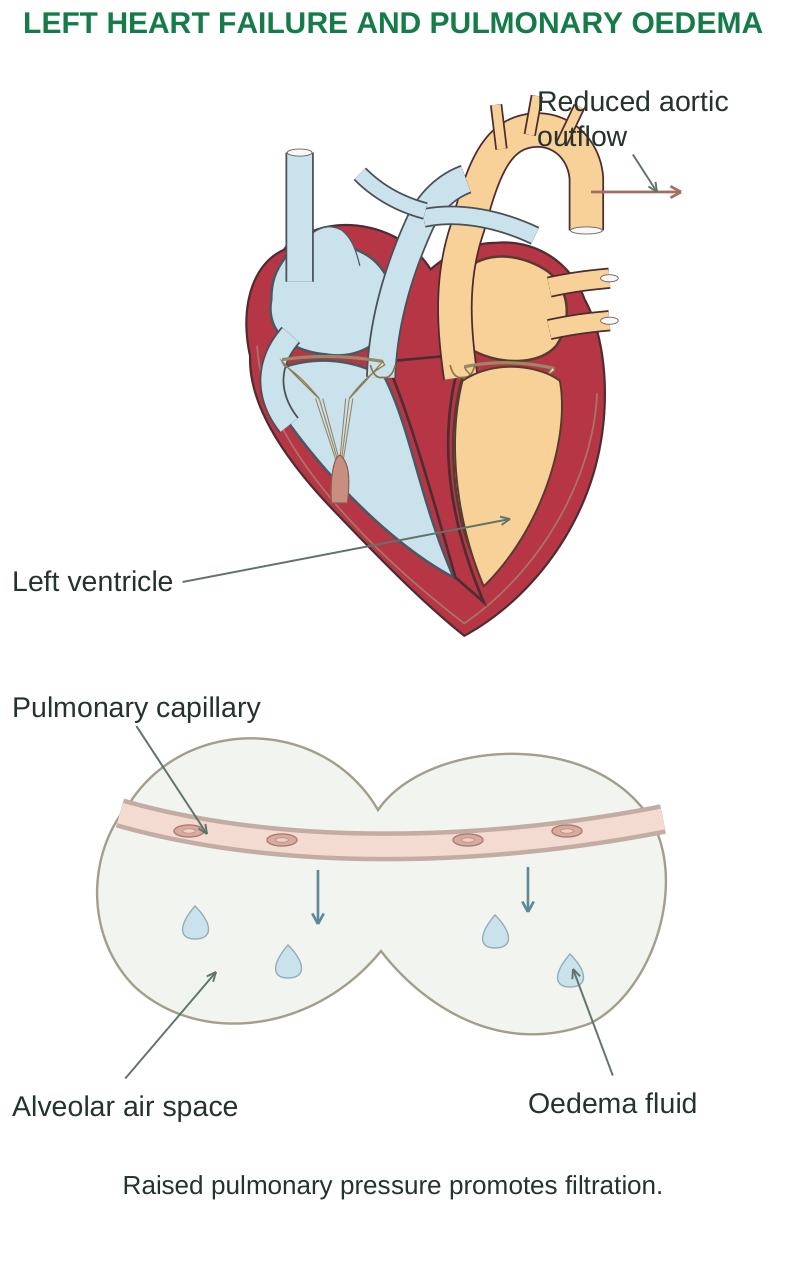
Diagram labels: LEFT HEART FAILURE AND PULMONARY OEDEMA; Reduced aortic outflow; Left ventricle; Pulmonary capillary; Alveolar air space; Oedema fluid; Raised pulmonary pressure promotes filtration.
Ejection fraction groups
Reduced-EF failure is associated with impaired systolic ejection. Preserved-EF failure commonly involves impaired relaxation and increased stiffness despite a preserved fraction ejected. EF alone does not measure all dimensions of cardiac function.
5.29 Left-sided, right-sided and combined failure
| Predominant side | Backward effects | Common manifestations |
|---|---|---|
| Left heart | Increased pulmonary venous pressure | Breathlessness, orthopnoea and pulmonary congestion/oedema |
| Right heart | Increased systemic venous pressure | Peripheral oedema, raised neck venous pressure and hepatic/abdominal congestion |
| Both | Pulmonary and systemic congestion | Combined findings with reduced exercise capacity |
Forward consequences include fatigue, reduced exercise tolerance and impaired renal perfusion. Left-sided failure can lead to right-sided failure through increased pulmonary pressures; right failure can also arise from primary lung/pulmonary vascular disease.
Clinical reasoning
Dyspnoea in heart failure relates to increased pulmonary fluid/pressure and reduced reserve, not simply to a low oxygen content in every patient. Ankle oedema suggests fluid accumulation but has several possible causes; it does not independently establish cardiac failure. Management aims to relieve congestion, reduce adverse neurohormonal effects, address the cause and support appropriate function. Diuretics remove retained salt/water; disease-modifying therapies and selected devices/procedures are chosen according to the syndrome. Medicine selection and doses require clinical assessment; an anatomy answer should focus on their physiological purpose.
Recall Forward failure reduces effective organ delivery. Backward failure raises upstream venous pressure. Both may occur together.
5.30 Atherosclerosis: an inflammatory arterial lesion
Atherosclerosis is a disease of the arterial intima characterised by lipid accumulation, inflammation and fibrous plaque formation. It particularly affects medium and large arteries. It is not merely passive fat sticking to a pipe wall.
Plaque development
Step 1: endothelial dysfunction and susceptible arterial sites favour entry and retention of atherogenic lipoproteins in the intima.
Step 2: modified lipoproteins and inflammatory signals recruit monocytes; macrophages take up lipid and become foam cells.
Step 3: smooth-muscle cells migrate/proliferate and produce extracellular matrix. A fibrous cap develops over a lipid-rich, sometimes necrotic core.
Step 4: progressive plaque may narrow the lumen and limit the ability to increase flow. Calcification and remodelling may also occur.
Step 5: plaque rupture or erosion can expose a thrombogenic surface, promoting platelet activation and clot formation. Acute thrombosis can suddenly obstruct a previously incompletely narrowed artery.
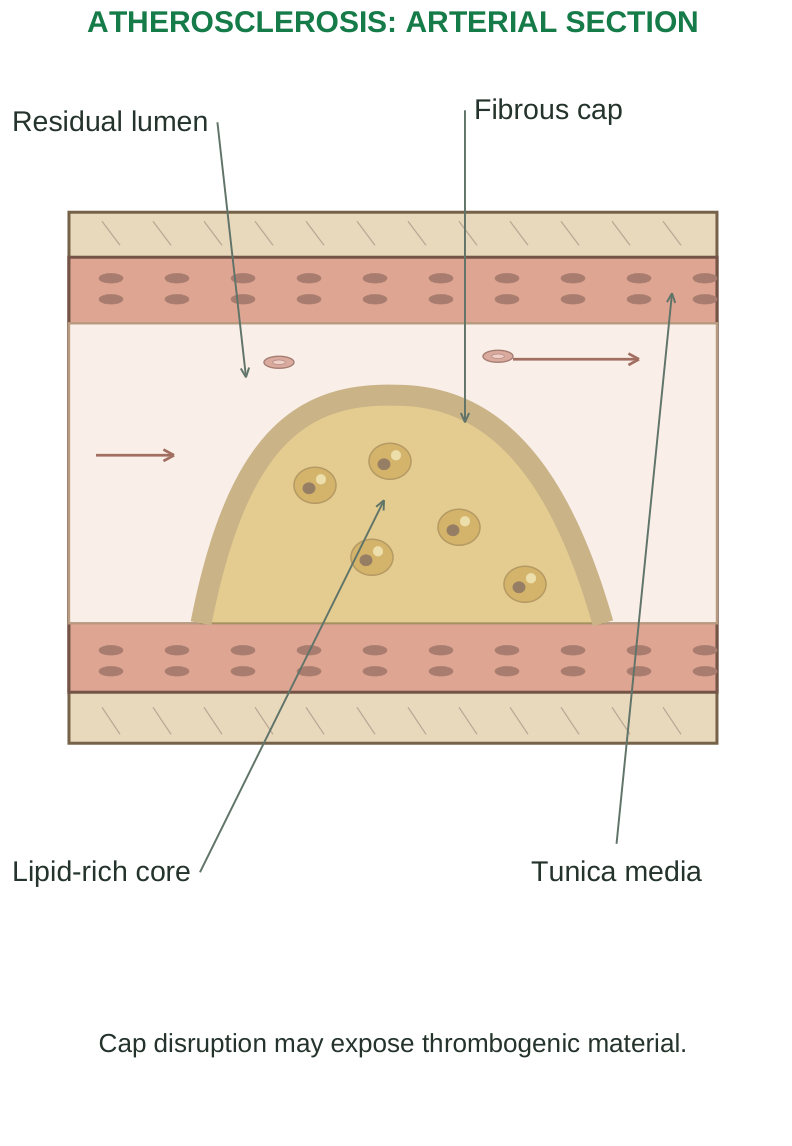
Diagram labels: ATHEROSCLEROSIS: ARTERIAL SECTION; Residual lumen; Fibrous cap; Lipid-rich core; Tunica media; Cap disruption may expose thrombogenic material.
Risk factors and complications
Atherogenic lipid levels, smoking, hypertension, diabetes and chronic kidney disease raise risk; age, family history and inherited factors also matter. Complications include chronic ischaemia, acute thrombosis, embolisation and weakening of some arterial walls. A plaque’s tendency to rupture is not determined only by its percentage narrowing.
5.31 Coronary artery disease and oxygen balance
Coronary artery disease (CAD) commonly results from atherosclerosis of coronary arteries. It can reduce myocardial oxygen supply, especially when demand rises. A fixed stenosis may permit adequate resting flow but reduce coronary reserve during exertion.
Supply-demand determinants
| Oxygen supply | Oxygen demand |
|---|---|
| Coronary flow and perfusion gradient | Heart rate |
| Coronary patency and vascular tone | Contractility |
| Duration of diastole | Ventricular wall stress/load |
| Arterial oxygen content / haemoglobin | Working myocardial mass |
Tachycardia can worsen both sides of the balance: greater demand and less diastolic perfusion time. Anaemia or hypoxaemia can reduce supply even without a new coronary occlusion. Severe pressure loading can increase myocardial demand.
Stable versus acute disturbance
A chronic flow-limiting lesion often produces predictable exertional symptoms. Plaque disruption with thrombosis can produce acute coronary syndromes, including unstable angina and myocardial infarction. Vasospasm and microvascular dysfunction are additional causes of myocardial ischaemia; not every ischaemic episode is caused by the same large-artery plaque mechanism. Long-term prevention addresses smoking, lipid levels, pressure, diabetes and other risk factors. Symptom relief and restoration of flow have different purposes and must be matched to the clinical condition.
5.32 Angina pectoris: reversible myocardial ischaemia
Angina is discomfort caused by transient myocardial ischaemia without the defining acute myocardial necrosis of infarction. A pressure/tightness sensation may occur in the chest and may radiate, but presentation varies; a symptom description alone does not prove the diagnosis.
Main patterns
| Pattern | Typical mechanism / behaviour |
|---|---|
| Stable angina | Predictable demand-related ischaemia, often with fixed flow limitation |
| Unstable angina | New/worsening or rest symptoms associated with an acute supply disturbance; no infarction evidence |
| Vasospastic angina | Transient coronary spasm, often occurring at rest |
| Microvascular angina | Dysfunction of small coronary vessels contributing to ischaemia |
During ischaemia, reduced oxygen delivery limits aerobic ATP production. Metabolic and ionic changes impair relaxation and contraction and can destabilise the electrical system. Relief of a short episode allows function to recover, but repeated symptoms indicate an important supply-demand problem.
Management logic
Reducing cardiac workload or improving coronary supply can relieve symptoms. Risk-factor control and appropriate antithrombotic/lipid-lowering strategies address underlying risk where indicated. New, persistent or worsening chest pain requires urgent assessment; do not assume that improvement after a particular medicine reliably rules out infarction.
5.33 Myocardial infarction: irreversible injury
Myocardial infarction (MI) is myocardial cell death due to prolonged ischaemia, identified clinically using evidence of acute myocardial injury together with evidence of ischaemia. A rise/fall in cardiac troponin alone can occur with non-ischaemic injury and is not sufficient for every MI diagnosis.
Common mechanism
Step 1: a coronary plaque ruptures or erodes, promoting an acute thrombus.
Step 2: flow falls sharply and oxygen delivery becomes inadequate.
Step 3: ATP depletion, calcium disturbance, membrane dysfunction and electrical instability develop.
Step 4: sustained severe ischaemia produces irreversible injury; inflammation clears dead tissue and healing creates scar. Not all MI is caused by plaque rupture; a severe oxygen supply-demand mismatch can also cause infarction in appropriate settings. Infarct size depends on the affected territory, severity/duration of impaired flow, collateral supply and restoration of perfusion.
Consequences and complications
Acute loss of contractile tissue reduces pump function. Arrhythmias may occur early. Complications include heart failure, cardiogenic shock, mechanical rupture/acute valve dysfunction, pericardial inflammation and later ventricular remodelling or aneurysm. Scar lacks the contractile function of the lost myocardium. ST-elevation and non-ST-elevation MI are clinical/ECG categories; they should not be equated perfectly with a full-thickness versus partial-thickness infarct. ECG, serial biomarkers and clinical assessment are interpreted together. Rapid medical care and appropriate reperfusion can limit injury when indicated.
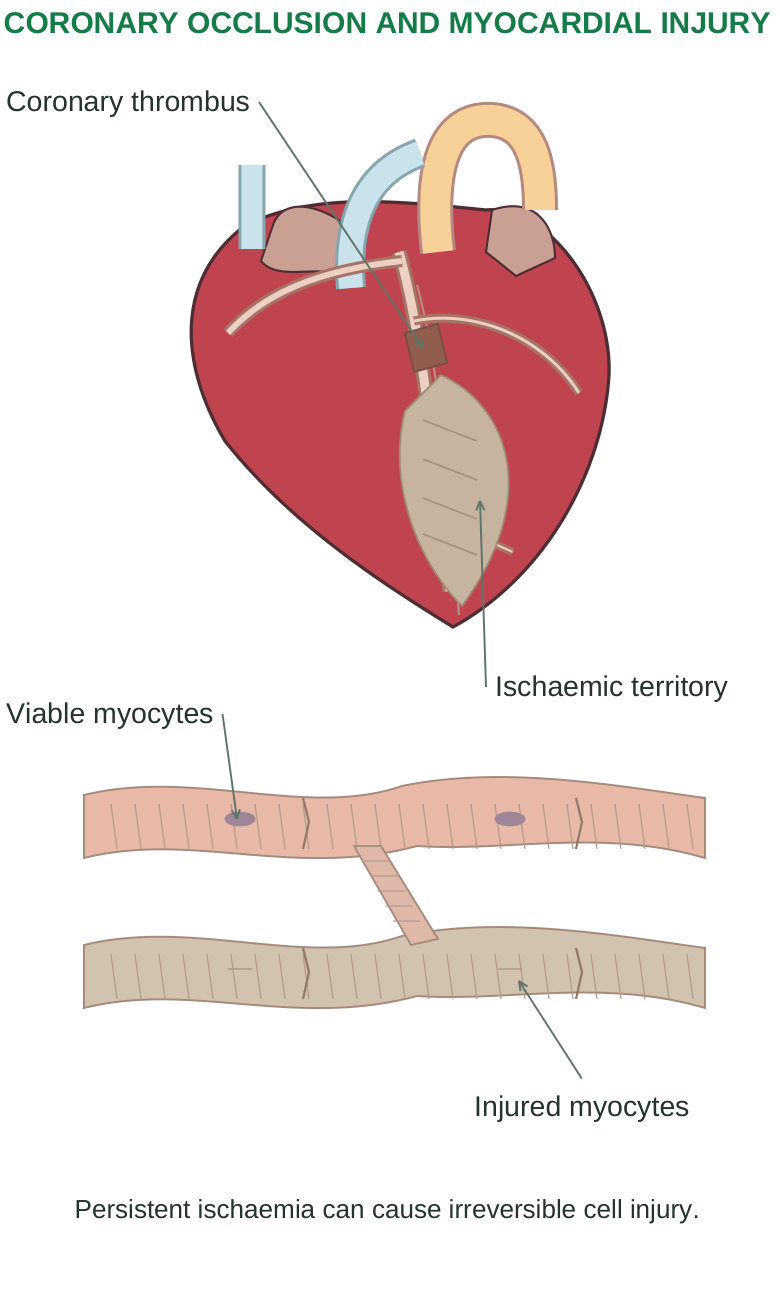
Diagram labels: CORONARY OCCLUSION AND MYOCARDIAL INJURY; Coronary thrombus; Ischaemic territory; Viable myocytes; Injured myocytes; Persistent ischaemia can cause irreversible cell injury.
Essential distinction Angina is transient ischaemia without defining infarction; MI involves ischaemic myocardial necrosis. Neither symptom intensity nor one isolated ECG finding is a complete diagnosis.
5.34 Integrated revision and worked cases
Formula sheet
| Quantity | Relationship |
|---|---|
| Stroke volume | SV = EDV – ESV |
| Cardiac output | CO = HR × SV |
| Ejection fraction | EF = SV / EDV × 100% |
| Cycle duration | 60 / HR seconds |
| Pulse pressure | SBP – DBP |
| Approximate resting MAP | DBP + pulse pressure/3 |
| Flow | Q = ΔP / R |
| Systemic haemodynamics | MAP – right atrial pressure ≈ CO × SVR |
Mechanism cases
Case 1: rapid rhythm with poor perfusion. Very short diastole reduces filling and coronary perfusion. If SV falls enough, increasing HR no longer increases effective CO. Check the rhythm and haemodynamic condition rather than assuming a rapid rate is beneficial.
Case 2: pulmonary congestion after ventricular injury. Impaired left ventricular pumping raises filling and pulmonary venous pressures. Increased filtration can produce pulmonary oedema and breathlessness. This connects local myocardial damage with a backward circulatory consequence.
Case 3: high pressure and a thick ventricular wall. Sustained afterload promotes compensatory hypertrophy. Later stiffness can impair filling and produce heart failure even before obvious reduction in EF.
5.35 Examination practice
Long-answer questions
1. Explain heart anatomy with a labelled section and valves.
2. Trace pulmonary, systemic and coronary circulation.
3. Compare arteries, veins and capillaries.
4. Explain conduction and autonomic regulation of heartbeat.
5. Describe cardiac-cycle pressure, volume and valve events.
6. Explain cardiac output and its determinants.
7. Explain neural, renal and hormonal BP regulation.
8. Describe ECG waves, intervals and rate calculation.
9. Explain hypertension and arrhythmia mechanisms.
10. Explain congestive heart failure and its consequences.
11. Relate atherosclerosis and CAD to angina and MI.
Short-answer questions
Why is left ventricular muscle thicker?
What do the SA node and AV delay achieve?
Explain chordae, S1 and S2.
Define MAP, pulse pressure and pulse deficit.
Distinguish an ECG lead from an electrode.
Why can tachycardia reduce coronary supply?
Compare ischaemia, infarction and cardiac arrest.
Case 4: exertional pain at a previously tolerable workload. A coronary lesion reduces reserve. Increased demand during exertion can exceed the available supply. A new/worsening pattern changes the urgency of assessment.
Errors to avoid
Arteries/veins are defined by direction, not oxygen content.
Both ventricles pump equal average volumes; systemic pressure is higher.
Chordae prevent AV leaflet prolapse; they do not open the valve.
Both isovolumetric phases have all valves closed.
P, QRS and T describe electrical events, not valve sounds.
EF is a fraction; a preserved EF does not exclude failure.
Hypertension, CAD, angina and MI are related but distinct diagnoses.
Heart failure is not synonymous with cardiac arrest.
Answer-building method
Start with the definition. Draw the relevant labelled structure or mechanism. Explain the normal relationship, then identify what changes and why. Link the change to symptoms/complications. Add a comparison or formula where it strengthens the explanation.
Solved numerical practice
1. SV, EF and CO: EDV 120 mL; ESV 48 mL; HR 75/min. SV = 120 – 48 = 72 mL/beat. EF = 72/120 × 100 = 60%. CO = 75 × 72 = 5,400 mL/min = 5.4 L/min.
2. Pressure: BP 126/78 mmHg. Pulse pressure = 126 – 78 = 48 mmHg. Approximate resting MAP = 78 + 48/3 = 94 mmHg. This is a calculation, not a diagnosis.
3. Regular ECG: six large squares between R peaks at 25 mm/s. HR = 300/6 = 50/min; significance depends on rhythm and context.
4. Cycle duration: HR 80/min. Duration = 60/80 = 0.75 s per whole cycle.
Solved application
Can heart failure occur with preserved EF? Yes. A stiff ventricle may fill inadequately or require high filling pressure. A preserved fraction ejected does not guarantee adequate filling or exclude congestion.
Answer-writing checklist
Label correct chambers, valves and flow direction.
State formula, assumptions and units.
Distinguish electrical and mechanical events.
Explain disease cause, mechanism and effect.
Unit V Complete
Structure directs blood; electrical timing coordinates pumping; pressure and resistance distribute flow.