Course Code: BP106T
Unit I Introduction
Pharmaceutical analysis determines the identity, strength, purity and quality of medicines. This unit introduces analytical techniques and concentration units, then explains standards, errors and impurity testing.
Accurate measurement requires suitable reagents, calibrated apparatus and clear reporting. Precision describes agreement between repeated results; accuracy describes closeness to an accepted value.
Limit tests compare a prepared sample with a permitted impurity standard under matched conditions. Understanding their reactions, apparatus and interferences connects laboratory observations with pharmaceutical quality control.
Topics Covered – Complete Syllabus Map
| Required topic | Notes sections |
|---|---|
| Analysis and techniques | 1.1–1.2 |
| Strength of solutions and calculations | 1.3–1.5 |
| Primary and secondary standards | 1.6–1.7 |
| Errors, accuracy and precision | 1.8–1.9 |
| Minimising errors; significant figures | 1.10–1.11 |
| Impurities and regulatory importance | 1.12–1.14 |
| Limit-test principles | 1.15 |
| Chloride and sulphate tests | 1.16–1.17 |
| Iron and arsenic tests | 1.18–1.19 |
| Lead and heavy-metal tests | 1.20–1.21 |
| Modified chloride/sulphate tests | 1.22 |
| Comparison and revision | 1.23–1.24 |
Learning outcomes
Distinguish identification, assay and impurity testing.
Express solution strength and solve dilution calculations.
Select and handle primary and secondary standards.
Explain error sources, accuracy and precision.
Apply significant figures and minimise analytical errors.
Describe impurity sources and their quality significance.
Explain and label the prescribed limit-test apparatus.
Compare sample and standard without introducing bias.
Essential vocabulary
| Term | Meaning |
|---|---|
| Analyte | Substance being determined |
| Assay | Quantitative determination of content |
| Molarity | Moles of solute per litre of solution |
| Standardization | Determining actual reagent strength |
| Accuracy | Closeness to an accepted value |
| Precision | Agreement among repeated results |
| Bias | Systematic displacement of a result |
| Impurity | Unwanted substance in a material |
| Limit test | Comparison with a specified impurity limit |
| Blank | Matching preparation without the analyte |
Central question How do controlled measurements and impurity comparisons establish that a pharmaceutical material meets its quality requirements?
1.1 Introduction to pharmaceutical analysis
Pharmaceutical analysis applies chemical, physical and instrumental methods to determine what a medicine contains and whether it meets defined quality requirements. It is used for raw materials, active pharmaceutical ingredients, excipients, intermediate materials and finished dosage forms.
An analysis may answer four different questions. Identity asks whether the expected substance is present. Strength asks how much is present. Purity asks which unwanted components are present and at what levels. Performance asks whether a dosage form has the required behaviour, such as dissolution or disintegration.
Qualitative and quantitative analysis
| Approach | Question and example |
|---|---|
| Qualitative | What is present? Chloride gives a characteristic silver chloride precipitate. |
| Quantitative | How much is present? A titration estimates the amount of an acid or base. |
| Limit test | Is an impurity within its permitted level? Compare sample turbidity with a standard. |
| Assay | What is the content of the named active substance? Report percentage or mass per dosage unit. |
An identity reaction alone cannot establish purity. Many samples can contain the expected active ingredient together with contamination. Similarly, passing one impurity test does not demonstrate that every other impurity is absent.
Sampling comes before measurement
The laboratory sample must represent the batch. Sampling only a clear upper layer of a poorly mixed suspension can give a misleading assay even when the measurement itself is excellent. A suitable sampling plan specifies the number, position, quantity and handling of samples.
Step 1: Define the problem. Identify the analyte, sample type, expected concentration and required decision.
Step 2: Obtain a representative sample. Avoid contamination, moisture exchange and selective sampling.
Step 3: Prepare the sample. Dissolve, extract or digest it without losing the analyte or creating interference.
Step 4: Measure with controls. Use appropriate standards, blanks and calibrated instruments.
Step 5: Calculate and interpret. Apply factors, units and reporting rules; compare with the requirement.
Step 6: Record and review. Preserve observations, calculations, preparation details and the final conclusion.
Why analysis matters in pharmacy
An incorrect active content can affect the delivered dose.
Impurities may affect safety, colour, stability or compatibility.
Reliable analysis helps monitor manufacturing consistency and storage changes.
Documented results support a justified quality decision rather than visual guesswork.
Memory key Identity – strength – purity – performance. These are related quality questions, but each requires suitable evidence.
1.2 Different techniques of analysis
Analytical techniques are commonly divided into classical chemical methods and instrumental methods. Classical methods measure reaction stoichiometry, volume or mass. Instrumental methods measure a physical response linked to the analyte.
Classical methods
Volumetric or titrimetric analysis: measure the volume of a standard solution needed to react with a known sample quantity. The reaction must be sufficiently rapid, complete and of known stoichiometry. The end point must be detectable and close to the equivalence point.
Types include acid-base, redox, precipitation, complexometric and non-aqueous titrations. These types are developed in later units; here the essential idea is the relation between amount and measured volume.
Gravimetric analysis: convert the analyte into a compound of known composition, isolate it and weigh it. Precipitation, filtration, washing, drying or ignition and weighing are critical stages. For sulphate, a barium sulphate precipitate can be used quantitatively after suitable treatment.
Gasometric analysis: measure the volume or amount of a gas produced or consumed in a defined reaction. Temperature, pressure, gas solubility and leakage affect the result.
Instrumental methods
| Technique | Measured property and typical use |
|---|---|
| UV-visible spectrophotometry | Absorption of light; assay of suitable absorbing substances or coloured complexes |
| Infrared spectroscopy | Characteristic molecular vibrations; supports identification |
| Flame emission / atomic absorption | Element-dependent optical signals; measurement of selected metals |
| Potentiometry | Electrical potential; pH measurement or titration end-point detection |
| Conductometry | Electrical conductance; ionic content or reaction progress |
| Chromatography | Separation followed by detection; related substances, identity and assay |
| Thermal analysis | Mass or energy changes with temperature; material characterisation |
Chromatography separates components rather than relying on a bulk property alone. In HPLC, components move through a column under different interactions; a detector records peaks. A peak area may support quantitation after a suitable calibration and validated separation.
Choosing a method
Consider analyte concentration, selectivity, matrix interference, required uncertainty, sample stability, available equipment and the decision to be made. An inexpensive titration may suit a pure concentrated substance; a low-level impurity in a complex formulation may require a selective instrumental method.
Sensitivity describes how strongly the measured response changes with concentration. Selectivity describes the ability to measure the intended component in the presence of others. A strong signal is not automatically a selective signal.
Titration: the key distinction
The equivalence point is the stoichiometric completion point. The end point is the observed indication, such as an indicator colour change. Their difference contributes to titration error.
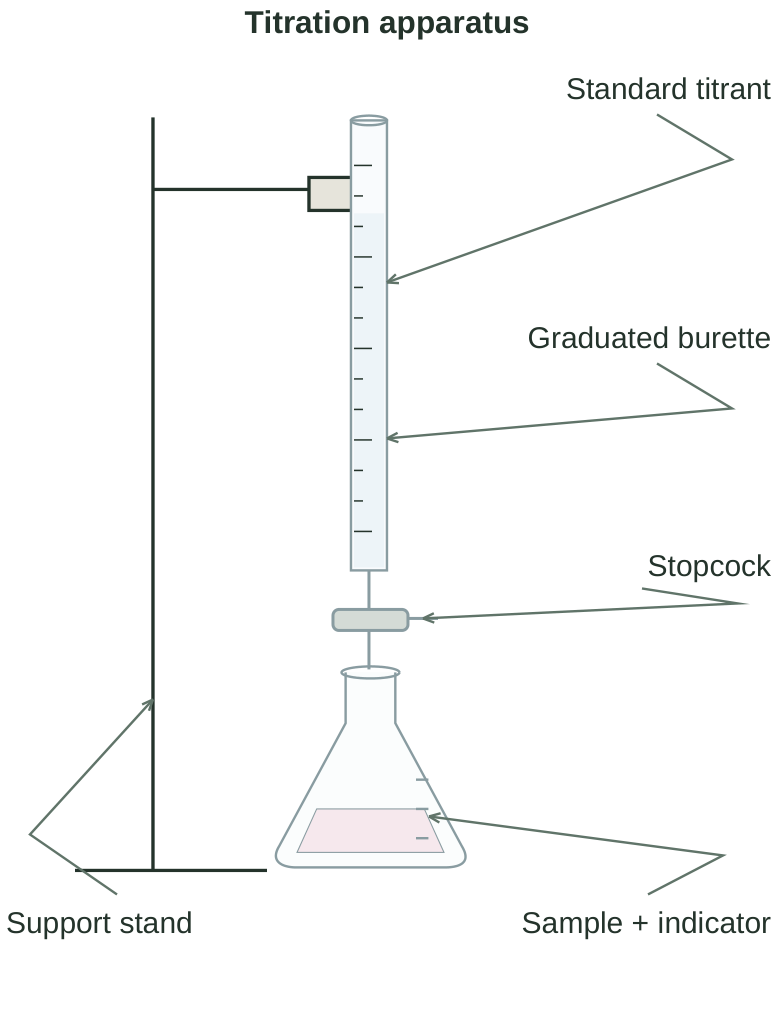
Diagram labels: Titration apparatus; Standard titrant; Graduated burette; Stopcock; Sample + indicator; Support stand.
Gravimetric calculation
If a precipitate has known composition, analyte mass = precipitate mass × gravimetric factor. For sulphate determined as BaSO4, the factor for SO4 is approximately 96.06 / 233.39 = 0.4116. Thus 0.2000 g BaSO4 represents about 0.08232 g SO4. This is an assay calculation, not a visual limit-test calculation.
Exam distinction Titrimetry measures volume; gravimetry measures mass. A limit test compares a signal with a permitted standard and normally does not give an exact concentration.
1.3 Methods of expressing strength of solutions
Solution strength describes the amount of solute relative to a defined amount of solution or solvent. Always identify both the numerical value and its basis. A bare statement such as “5%” is incomplete when more than one concentration convention is possible.
Percentage expressions
| Expression | Definition |
|---|---|
| % w/w | Grams of solute in 100 g of solution |
| % w/v | Grams of solute in 100 mL of solution |
| % v/v | Millilitres of liquid solute in 100 mL of solution |
Percentage = (amount of solute / amount of solution on the stated basis) × 100.
Example: 2% w/v NaCl. Dissolve 2 g and make the final solution volume 100 mL. It does not mean add 2 g to 100 mL of water, because the final volume may differ.
Example: 5% w/w preparation. A 200 g batch requires 10 g solute and enough other material to make a final mass of 200 g. If there are only two components, the other component contributes 190 g.
Example: 70% v/v ethanol. Measure the required ethanol volume and dilute to the final marked volume after temperature equilibration. Volumes of mixed liquids are not always strictly additive.
Mass concentration
Common units are g/L, mg/mL, mg/L and μg/mL. These express solute mass per solution volume.
1 g/L = 1 mg/mL.
1 mg/L = 1 μg/mL.
1% w/v = 1 g/100 mL = 10 g/L = 10 mg/mL.
0.1% w/v = 1 mg/mL. Worked conversion: 250 mg in 50.0 mL gives 5.00 mg/mL = 5.00 g/L = 0.500% w/v. Keep the volume in the denominator throughout the conversion.
Ratio strength
1 in n means one part of solute in n parts of final preparation on the stated basis. For a solid dissolved in a liquid, a ratio such as 1 in 1000 is often used on a w/v basis; state that basis explicitly.
For the same basis: percentage strength = 100 / n; n = 100 / percentage strength.
Example: 1 in 1000 w/v = 1 g in 1000 mL = 0.1% w/v = 1 mg/mL. A 1 in 5000 w/v solution is 0.02% w/v.
Parts per million and parts per billion
For a mass fraction, 1 ppm = 1 μg/g = 1 mg/kg. Likewise, 1 ppb = 1 ng/g = 1 μg/kg. These are ratios of like quantities; ppm is not inherently a volume concentration.
For a very dilute aqueous solution with density close to 1 kg/L, 1 ppm is approximately 1 mg/L. This approximation should not be transferred automatically to dense liquids or concentrated solutions.
Impurity example: 12 μg impurity in 2.00 g sample corresponds to 12 / 2.00 = 6.0 μg/g = 6.0 ppm by mass.
Density-dependent conversion
If density ρ is in g/mL, % w/v = (% w/w) × ρ. A 10.0% w/w solution of density 1.20 g/mL contains 12.0 g per 100 mL and is therefore 12.0% w/v. The density and temperature should be specified when accuracy matters.
Common mistake The denominator is usually the final solution or preparation, not the amount of solvent originally taken. Molality is an important exception because its denominator is solvent mass.
1.4 Molarity, molality and normality
Molarity
Molarity (c or M) is the amount of solute, in moles, per litre of solution.
M = moles of solute / solution volume in L.
Moles = mass in g / molar mass in g/mol.
Mass required (g) = M × molar mass × final volume in L.
Example: for 250.0 mL of 0.1000 mol/L NaCl, mass = 0.1000 × 58.44 × 0.2500 = 1.461 g. Dissolve the calculated mass in a portion of water and make up to 250.0 mL.
Molarity depends on solution volume, so it can change with temperature. Dissolve and cool a solution to the appropriate temperature before making up to a calibration mark.
Molality
Molality (m) is the amount of solute, in moles, per kilogram of solvent.
m = moles of solute / solvent mass in kg.
Example: 0.200 mol solute dissolved in 0.500 kg solvent gives 0.400 mol/kg. The denominator is not total solution mass.
Because mass does not change merely with thermal expansion, molality is not directly affected by the volume changes that alter molarity. Molarity and molality become numerically similar only under appropriate dilute-solution and density conditions.
Normality and equivalent mass
Normality (N) is the number of equivalents of solute per litre of solution for a specified reaction. Normality is reaction-dependent; it should never be assigned without stating the chemical change.
N = equivalents / solution volume in L.
Equivalent mass = molar mass / n-factor.
N = M × n-factor.
The n-factor is the number of relevant reactive units per formula unit: protons exchanged in a stated acid-base reaction, electrons exchanged in a redox reaction, or charge units involved in an appropriate precipitation reaction.
Acid-base examples
HCl supplies one proton per molecule in neutralisation: n = 1 and N = M.
H2SO4 has n = 2 for complete neutralisation of both acidic protons: N = 2M.
Na2CO3 has n = 2 when fully neutralised to carbonic acid / CO2 and water; n = 1 for conversion only to bicarbonate.
Redox example: permanganate
For MnO4 – reduced to Mn2+ in acid, n = 5. Therefore 0.0200 M KMnO4 corresponds to 0.100 N for that reaction. If reduced to MnO2 in a different medium, n = 3. The same molarity then corresponds to a different normality.
Equivalent mass in acid: 158.03 / 5 = 31.606 g/equivalent. Do not use this value for every permanganate reaction.
Mole fraction
Mole fraction xᵢ = moles of component i / total moles of all components. It is dimensionless and the mole fractions sum to 1. A mixture with 1 mol component A and 3 mol component B has xA = 0.25 and xB = 0.75.
| Quantity | Denominator |
|---|---|
| Molarity | Litre of solution |
| Molality | Kilogram of solvent |
| Normality | Litre of solution; reaction must be stated |
| Mole fraction | Total moles in mixture |
Memory key Molarity: solution volume. Molality: solvent mass. Normality: reaction equivalents.
1.5 Preparation, dilution and worked calculations
Correct solution preparation
Step 1: Calculate. Identify the concentration basis, final volume, chemical form, molar mass and any stated purity correction.
Step 2: Weigh or measure. Use an appropriate balance or calibrated volumetric device. Record the actual amount.
Step 3: Dissolve. Use less than the final solvent volume. Allow any heat of dissolution to dissipate.
Step 4: Transfer quantitatively. Rinse the vessel and funnel into the volumetric flask so that no measured solute remains behind.
Step 5: Make up to the mark. Use a dropper near the mark; read the appropriate meniscus at eye level.
Step 6: Mix and label. Invert the stoppered flask repeatedly. Record identity, concentration, solvent, preparation date and any applicable standardisation information.
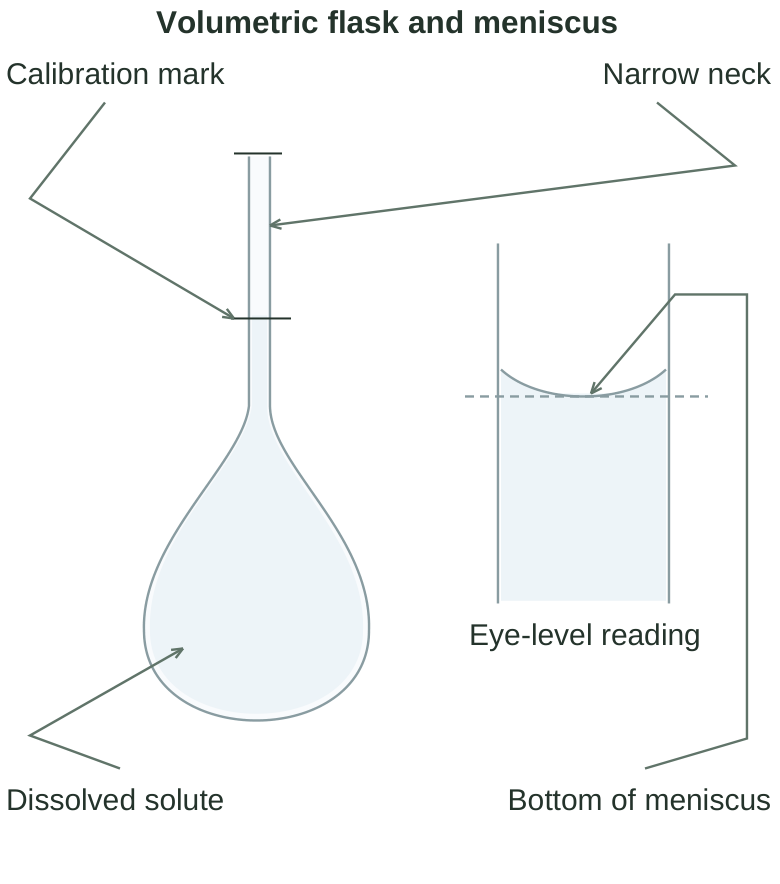
Diagram labels: Volumetric flask and meniscus; Calibration mark; Narrow neck; Dissolved solute; Eye-level reading; Bottom of meniscus.
Simple dilution
When the solute amount is conserved and the same concentration basis is used, C1V1 = C2V2. Dilution changes concentration but does not remove the measured solute.
Example: prepare 100.0 mL of 0.0100 M solution from 0.1000 M stock. V1 = (0.0100 × 100.0) / 0.1000 = 10.00 mL. Transfer 10.00 mL stock and dilute to 100.0 mL; do not add exactly 100.0 mL water.
Dilution factor (DF) = final volume / transferred aliquot volume. For the example, DF = 10. If a diluted sample measures 0.80 mg/mL, the original concentration is 8.0 mg/mL when there are no other preparation factors.
Serial dilution
For successive dilutions, the overall factor is the product of the individual factors. A 1:10 dilution followed by a 1:5 dilution gives an overall factor of 50. A final measured value of 2.0 μg/mL corresponds to 100 μg/mL in the original solution.
Reaction quantities are not always 1:1
For aA + bB → products, use nA / a = nB / b. If H2SO4 reacts fully with NaOH, one mole acid reacts with two moles base. Therefore MA VA × 2 = MB VB; alternatively NA VA = NB VB when both normalities are correctly defined for that reaction.
Worked example: acid standardisation
25.00 mL of 0.05000 M Na2CO3 requires 24.80 mL HCl for complete neutralisation. Moles carbonate = 0.05000 × 0.02500 = 0.001250 mol. Moles HCl = 2 × 0.001250 = 0.002500 mol. HCl molarity = 0.002500 / 0.02480 = 0.1008 M.
Hydrate and purity corrections
If a salt is weighed as a hydrate, use the molar mass of that hydrate, not the anhydrous compound. For a material with stated mass fraction purity P, required mass = theoretical pure mass / P, where P is expressed as a decimal. This correction is valid only when the impurity does not interfere with the intended use.
Example: if 1.000 g of pure compound is needed and usable material is 99.0% pure, the corrected mass is 1.000 / 0.990 = 1.010 g. Use a certified composition basis when preparing quantitative standards.
Quick calculation checklist
Convert mL to L before using molarity with moles.
Check whether the concentration is w/w, w/v or v/v.
State the reaction before using normality.
Include every extraction, aliquot and dilution factor.
Retain guard digits and round only the final result.
1.6 Primary and secondary standards
A standard solution has an accurately established concentration. Its concentration may be established by direct preparation from a suitable primary standard or by standardisation against a standard with an appropriately established concentration.
Primary standard
A primary standard is a sufficiently pure, stable substance whose amount can be determined accurately by weighing and used to establish a solution concentration or reaction amount.
Desirable properties include known high purity, stable composition, low moisture uptake, non-volatility, suitable solubility, a definite stoichiometric reaction and a reasonably high molar mass. A higher molar mass reduces the relative influence of a fixed absolute weighing error.
Examples include anhydrous sodium carbonate for acid standardisation, potassium hydrogen phthalate (KHP) for base standardisation and suitable certified potassium dichromate for specified redox work. Preparation and drying conditions depend on the material and method.
Important qualification: a chemical name alone does not guarantee primary-standard quality. Hydration state, purity certification, stability, conditioning and reaction suitability must be considered. “Primary” describes suitability for a stated analytical purpose.
Secondary standard
A secondary standard solution has its concentration established by standardisation against a primary standard or another appropriately established standard. It is used routinely when direct preparation alone cannot give a sufficiently reliable concentration.
Examples include HCl, NaOH, KMnO4 and sodium thiosulphate solutions under their respective procedures. HCl concentration can be affected by handling and volatility. NaOH takes up moisture and CO2. Permanganate may contain or form MnO2 and its strength may change during storage. Thiosulphate requires suitable preparation and stability control.
| Primary standard substance | Secondary standard solution |
|---|---|
| Can establish amount accurately by suitable direct weighing | Actual concentration is determined through standardisation |
| Requires known purity and stable composition | May change during preparation or storage |
| Used as a reference in the reaction | Used as routine titrant after its strength is established |
| Example: KHP | Example: standardised NaOH |
Standardisation in practice
Step 1: prepare an approximately required titrant strength.
Step 2: take an accurately known amount of primary standard.
Step 3: carry out the appropriate titration with a blank correction if required.
Step 4: calculate actual concentration from stoichiometry.
Step 5: assess concordance and assign the concentration with a date.
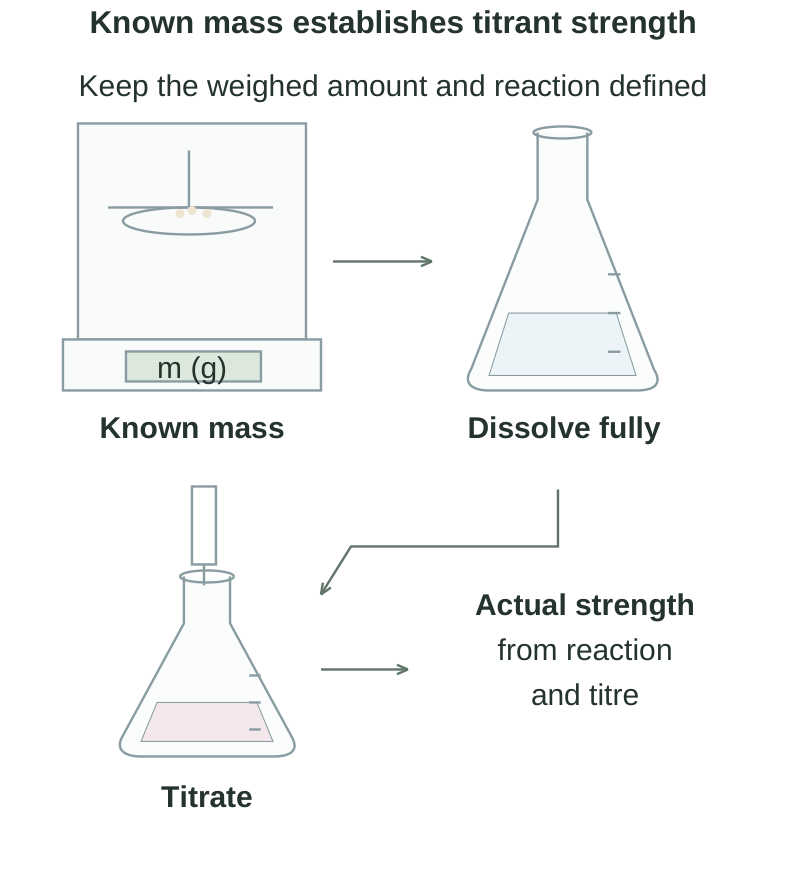
Diagram labels: Known mass establishes titrant strength; m (g); Known mass; Dissolve fully; Titrate; Actual strength; from reaction; and titre; Keep the weighed amount and reaction defined.
Factor of a standard solution
Factor f = actual concentration / nominal concentration. If a nominal 0.1000 M titrant is actually 0.09870 M, f = 0.9870. A volume multiplied by f can be treated as an equivalent volume of the nominal strength, if the calculation convention is clearly defined.
KHP worked example
KHP is monoprotic in its reaction with NaOH. A 0.5106 g sample with molar mass 204.22 g/mol contains 0.002500 mol to the shown precision. If it requires 24.70 mL NaOH, the NaOH molarity is 0.002500 / 0.02470 = 0.1012 M. The endpoint, blank and purity basis must be appropriate.
Common mistake Weighing pellets and diluting NaOH to a mark does not by itself establish an exact concentration. Its hygroscopic behaviour and CO2 uptake require standardisation and suitable storage.
1.7 Use and care of analytical standards
Primary standard preparation
Condition a primary standard only as required for that material. Drying is not a universal treatment: some materials have a defined hydrated form or can decompose when heated. After appropriate drying, cool in a desiccator and weigh without unnecessary exposure to the atmosphere.
For quantitative transfer, rinse all contacted surfaces into the receiving vessel. Dissolve fully before making up volume. A few crystals left on weighing paper or a funnel are part of the weighed amount and their loss makes the prepared concentration lower than calculated.
Titrant preparation and storage
Use containers compatible with the solution. Protect light-sensitive solutions where required and minimise evaporation. NaOH solutions need appropriate protection from CO2; a tightly closed suitable container reduces carbonate formation. Label both nominal and actual strength when the laboratory procedure requires them.
Re-standardisation is needed at a suitable interval or after a change that can affect concentration. A previous standardisation does not permanently guarantee current strength. Record observations that suggest deterioration, such as a deposit, contamination or evaporation.
Blanks and standard additions
A reagent blank contains the reagents and solvent but omits the sample analyte. It can reveal reagent contamination or a background response. A process blank goes through the preparation steps and can reveal contamination introduced during preparation.
A spiked sample contains a known added amount of analyte. Its measured recovery helps assess whether the sample matrix suppresses or enhances the response or whether preparation causes loss. Recovery is not a replacement for all other method suitability checks.
Recovery (%) = [(result for spiked sample – result for unspiked sample) / amount added] × 100, with all results on the same amount basis.
Example: an unspiked sample gives 8.0 μg, an added 10.0 μg gives a spiked result of 17.5 μg. Recovery = (17.5 – 8.0) / 10.0 × 100 = 95%. Decide acceptability against a justified method requirement, not an assumed universal range.
Standard and reference material are related terms
A reference material may support identification, calibration, assay or impurity testing. A certified reference material provides assigned property values with appropriate documentation and uncertainty. A standard solution is a prepared liquid with established strength; it is not automatically a certified reference material.
Concordant results
Concordant titres agree within a predetermined tolerance. The tolerance depends on the procedure and required measurement quality. Agreement among replicate titres supports precision, but an incorrect primary-standard mass or end point can still bias all results together.
Example: three closely agreeing titres obtained with a wrongly calibrated pipette can all be biased. Repeatability checks and calibration checks address different problems.
Practical record
Record the standard identity, lot or source identifier where applicable, purity basis, conditioning, actual mass, flask volume, reaction, titres, blank, calculation, factor and date. In a student answer, explain the sequence and chemical relationship rather than merely writing “standardise the solution.”
Memory key Known amount → defined reaction → measured volume → actual strength. Storage control preserves that strength; re-standardisation checks it again.
1.8 Errors in pharmaceutical analysis
Measurement error is the difference between a measured value and an appropriate reference value. Because a true value is not normally known exactly, an accepted or certified reference value is often used for evaluating accuracy.
Absolute error E = measured value – reference value.
Relative error = E / reference value.
Percentage relative error = (E / reference value) × 100.
The sign indicates direction. A positive error means the result is high; a negative error means it is low. Error magnitude may be expressed as an absolute value when direction is not required.
Example: a result of 9.80 mg compared with 10.00 mg gives E = -0.20 mg and relative error = -2.0%. This is different from a relative standard deviation, which describes spread.
Systematic or determinate errors
These have an identifiable cause that produces a consistent tendency. They may be approximately constant in amount or proportional to the analyte quantity.
Instrumental: incorrect balance calibration, a biased burette scale, detector drift or an unsuitable wavelength setting.
Method: incomplete reaction, analyte loss, interfering reaction, co-precipitation or an end point displaced from equivalence.
Personal / operational: consistently reading a meniscus from above or consistently overshooting an indicator end point.
Reagent: contaminated water, impure reagent or incorrectly assigned titrant strength. Constant error: a fixed 0.05 mL blank contribution has a greater relative effect on a small titre than a large titre. Proportional error: a titrant concentration that is 1% too high produces an approximately proportional calculation bias.
Random or indeterminate errors
These produce unpredictable small variations among repeated observations. Examples include small reading differences, short-term detector noise and minor environmental fluctuations. Individual deviations can be positive or negative.
Replicate measurements help estimate the spread and can reduce uncertainty in the average when the measurements are independent. They do not remove a common systematic bias.
Gross errors or blunders
These are avoidable mistakes such as recording 12.6 as 21.6, using the wrong reagent, losing part of the sample or applying a wrong dilution factor. They are investigated as mistakes rather than accepted as ordinary random scatter.
| Type | Typical pattern and response |
|---|---|
| Systematic | Consistent bias; identify and correct the cause |
| Random | Scatter around a central value; control conditions and use suitable replication |
| Gross | Wrong operation or record; investigate and correct with documentation |
Sources across the analytical process
Sampling: poor mixing or an unrepresentative portion. Preparation: incomplete extraction, transfer loss or contamination. Measurement: calibration error, parallax or instrument instability. Calculation: wrong units, hydrate mass or stoichiometry. Reporting: excessive rounding or transcription errors.
The largest error may occur before the instrument measurement. A sophisticated instrument cannot repair an unrepresentative sample.
Common mistake “Human error” is too vague for an examination answer. State the operation, how it affects the result and the practical control.
1.9 Accuracy and precision
Accuracy describes closeness of agreement between a measured result and a reference value. Precision describes closeness of agreement among repeated measurements under stated conditions. Closely agreeing results can still be far from the reference value.
Repeatability concerns precision under closely similar conditions, such as the same method, equipment, operator and short time interval. Intermediate precision concerns variations within a laboratory, such as different days or operators. Reproducibility commonly concerns results under changed conditions between laboratories.
Mean and deviations
Mean x̄ = Σxᵢ / n. A deviation is dᵢ = xᵢ – x̄. Deviations describe how individual values differ from the average, not how far the average is from the reference value.
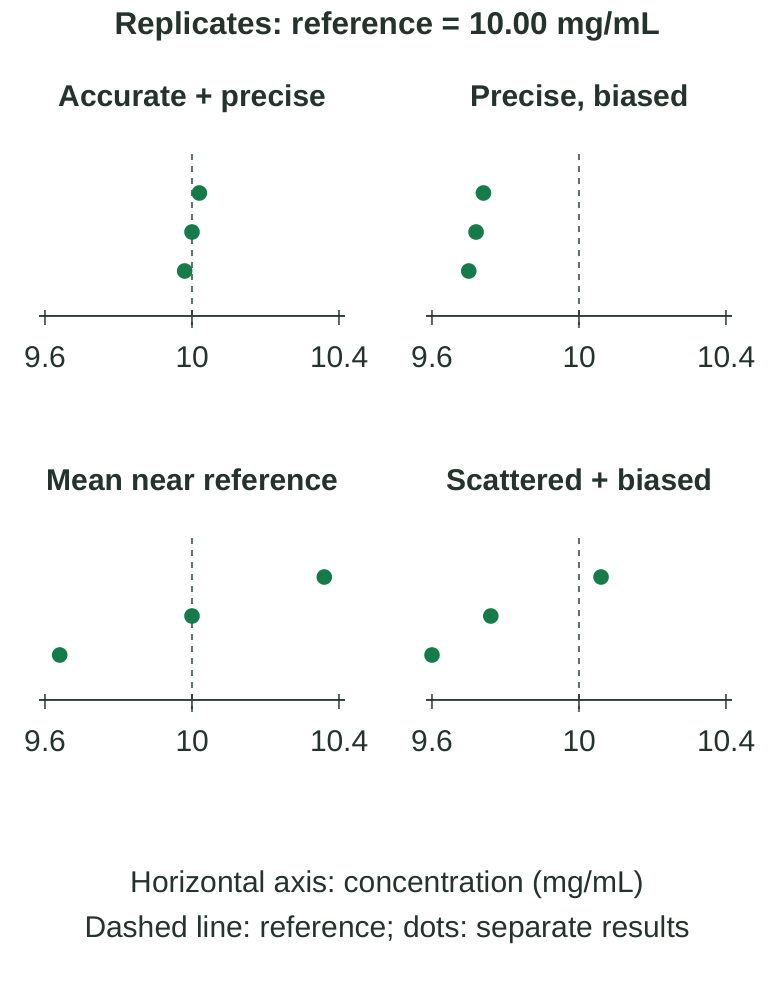
Diagram labels: Replicates: reference = 10.00 mg/mL; Accurate + precise; 9.6; 10; 10.4; Precise, biased; 9.6; 10; 10.4; Mean near reference; 9.6; 10; 10.4; Scattered + biased; 9.6; 10; 10.4; Horizontal axis: concentration (mg/mL); Dashed line: reference; dots: separate results.
Sample standard deviation s = √[Σ(xᵢ – x̄)^2 / (n – 1)]. It has the same units as the observations. Relative standard deviation (RSD%) = (s / x̄) × 100, commonly used when the mean is positive and not close to zero.
Worked example
Suppose a preparation with reference concentration 10.00 mg/mL gives 9.80, 9.82 and 9.84 mg/mL. The mean is 9.82 mg/mL. Deviations are -0.02, 0 and +0.02 mg/mL. s = √[(0.0004 + 0 + 0.0004) / 2] = 0.020 mg/mL.
RSD = 0.020 / 9.82 × 100 = 0.204%. Bias of the mean = 9.82 – 10.00 = -0.18 mg/mL, or -1.8%. The results are closely grouped but biased low. Small RSD does not establish accuracy.
Improving the result
If calibration is wrong, calibration correction addresses accuracy. If the sample preparation is inconsistent, controlling mixing, temperature and timing addresses precision. A reliable procedure needs both suitable accuracy and precision for its purpose.
Error versus uncertainty
Error concerns a difference from a reference value. Measurement uncertainty characterises the dispersion of values reasonably attributable to the measured quantity. Uncertainty may include calibration, weighing, volume, preparation and repeatability contributions.
It is misleading to claim that an analytical result has “zero error.” A result should be reported at a resolution consistent with measurement quality. A measured concentration of 10.123456 mg/mL is not justified merely because a calculator displays six decimal places.
Common analytical interpretations
Closely grouped values around the reference: good precision and good accuracy in the illustrated conditions.
Closely grouped values away from the reference: good precision with systematic bias.
Widely scattered values centred near the reference: poor precision, even if the mean happens to be close.
Widely scattered values away from the reference: poor precision and bias.
Memory key Accuracy = closeness to reference. Precision = closeness to one another. Repetition estimates precision; comparison with a suitable reference helps assess accuracy.
1.10 Methods of minimising errors
Control errors at their source
Sampling control: use an appropriate sampling plan, mix where required and protect the sample from contamination or degradation. Label the sample unambiguously.
Instrument control: calibrate balances and volumetric equipment appropriately, verify instrument performance and use stable operating conditions. Warm-up and baseline requirements depend on the equipment.
Method control: select a suitable reaction or separation, establish recovery and address matrix interference. Use the prescribed pH, temperature, reaction time and reagent sequence.
Reagent control: use reagents of appropriate quality, clean water and properly established standards. Run blanks where the method requires them.
Operator control: use consistent technique, avoid parallax, approach an end point slowly and make quantitative transfers. Record observations promptly.
Data control: verify units, stoichiometry, decimal placement, dilution factors and final rounding. Independent review can detect transcription or calculation errors.
Volumetric analysis precautions
Condition a burette with the titrant and a pipette with the solution to be delivered when appropriate; residual rinse water otherwise dilutes the solution.
Remove an air bubble from the burette tip before the initial reading. Filling the tip during titration can falsely increase the apparent delivered volume.
Read at eye level. For a clear aqueous solution, use the bottom of the concave meniscus.
Remove a filling funnel before reading and titrating; drops from it can change the burette content unnoticed.
Mix the receiving flask and add titrant dropwise near the end point.
Use the same specified end-point criterion for every titration.
Weighing precautions
Allow a warm vessel to cool before weighing. Avoid drafts, static effects, contaminated weighing vessels and moisture changes. Weighing by difference can be useful for materials transferred from a closed weighing bottle.
For a 0.1 mg absolute weighing error, the relative error is 0.1% at a 100 mg mass but 1% at a 10 mg mass. Choose a sample amount suitable for the balance and method.
Temperature and volume
Volumetric glassware is calibrated for stated conditions. Making a warm solution to the mark and then cooling it changes the final volume and concentration. Dissolve first, cool appropriately, and then adjust the volume.
Replicates and outliers
Replicate results provide information on precision. Use a justified replicate plan rather than repeating until a preferred answer appears. If one result is unusual, inspect records for a demonstrable mistake or apply an appropriate predefined statistical approach. Do not discard a result merely because it is inconvenient.
Error-control example
An assay is consistently 2% low with tightly grouped results. Possible explanations include analyte loss, incorrect standard strength or negative calibration bias. First verify standards and recovery. Taking ten more similarly biased readings would not correct the cause.
Examination method Write source → effect → control. Example: CO2 uptake by NaOH → altered effective titrant composition → protected storage and suitable re-standardisation.
1.11 Significant figures and reporting
Significant figures are the digits that convey meaningful measurement information, including the final estimated digit. They reflect the precision expressed in a number, not simply the number of characters displayed.
Counting rules
Non-zero digits are significant: 24.63 has four significant figures.
Zeros between significant digits count: 100.2 has four.
Leading zeros do not count: 0.00420 has three.
Trailing zeros after a decimal point count: 2.500 has four.
Trailing zeros in a whole number may be ambiguous: write 1.20 × 10^3 to show three significant figures. Exact counted numbers and defined conversion factors do not limit the significant figures of a calculation. For example, the conversion 1000 mL = 1 L is exact. A measured volume of 1000 mL may have limited resolution, depending on how it was measured.
Addition and subtraction
Round to the least precise decimal place among the measured terms. Example: 12.11 + 0.3 = 12.41 before rounding, reported as 12.4. It is not the number with the fewest significant figures that directly determines this rule.
Multiplication and division
As a basic reporting rule, use the least number of significant figures among the measured input quantities. Example: 2.50 × 3.2 = 8.0 after rounding to two significant figures.
For chained calculations, retain extra digits internally and round once at the end. Repeated intermediate rounding can alter the final answer.
Rounding
If the first discarded digit is less than 5, leave the retained digit unchanged; if it is greater than 5, increase the retained digit by one. For an exact halfway case, follow the specified reporting convention, such as round-half-up or round-to-even, consistently.
Examples: 4.276 to three significant figures is 4.28. A titre difference of 24.36 – 0.12 = 24.24 mL retains the hundredths place when both readings are reported to 0.01 mL.
Scientific notation
Scientific notation makes precision explicit and prevents mistakes with very large or small numbers. 0.000560 g = 5.60 × 10^-4 g, with three significant figures. 5600 g can be written 5.6 × 10^3 g or 5.600 × 10^3 g to express different precision.
Worked report
If 0.1234 g analyte is present in 0.5000 g sample, content = 0.1234 / 0.5000 × 100 = 24.68%. The factor 100 is exact. Reporting 24.680000% adds unsupported digits.
Result expression
State the analyte, numerical result, unit and sample basis. “Iron = 15” is incomplete. “Iron = 15 μg/g on the stated sample basis” is interpretable. Distinguish a measured result from a limit-test conclusion such as “not more intense than the standard.”
Quick check The calculator performs arithmetic; the analytical method determines how many digits can be justified.
1.12 Impurities in pharmaceuticals
An impurity is an unwanted component present alongside the intended pharmaceutical substance or product components. An intentionally formulated excipient is not automatically an impurity; identity, purpose and quality specification matter.
Impurities can originate during manufacture, enter from the environment or packaging, or develop during storage. An impurity profile describes relevant impurity identities or categories together with their levels and control.
Types of impurities
| Category | Examples and origin |
|---|---|
| Organic | Unreacted starting materials, intermediates, by-products and degradation products |
| Inorganic | Reagents, salts, catalyst residues, filter aids and metallic contamination |
| Residual solvents | Solvents retained from synthesis, extraction or processing |
| Particulate / foreign matter | Dust, fibres, glass fragments or other physical contamination |
| Microbial contamination | Unwanted microorganisms; assessed by suitable microbiological controls |
The organic / inorganic / residual-solvent classification is useful for chemically defined drug substances. Physical and microbial contamination require additional quality controls rather than being fully described by that chemical classification.
Process-related and degradation impurities
Process-related impurities arise from synthesis or purification: unreacted material, side products, catalyst residues or retained solvents. Degradation impurities arise from chemical change after or during manufacture, such as hydrolysis, oxidation or photolysis.
Example: iron introduced from corroded equipment is an inorganic contaminant. A hydrolysis product of an ester drug is an organic degradation impurity. Ethanol retained after processing is a residual solvent.
Specified and unspecified impurities
A specified impurity is individually addressed in a specification, with an identification or defined analytical designation and an acceptance criterion. An unspecified impurity is controlled through a general criterion without an individual listing. Total impurity content is a different quantity from the level of any one impurity.
Effects of impurities
Toxicity or unwanted biological effects may increase.
Active content may be reduced or analytical measurements distorted.
Stability may change; trace metals can catalyse some oxidation reactions.
Colour, odour, clarity or appearance may become unacceptable.
Compatibility with excipients, containers or other ingredients may change. An impurity can matter at a low level if its toxicity or reactivity is high. A visually clear material is not necessarily chemically pure.
Content of an impurity
Impurity content can be expressed as percentage, μg/g, mg/kg, μg/mL or another defined basis. For chromatographic measurements, an area percentage is not automatically a mass percentage unless appropriate response and method assumptions are justified.
Example: 0.0020% w/w equals 20 ppm by mass because 1% corresponds to 10,000 ppm. This conversion concerns the mass fraction; it is not a daily exposure calculation.
Memory key Made during processing, introduced from outside, or formed by degradation. These three routes explain most sources of pharmaceutical impurities.
1.13 Sources of impurities in pharmaceuticals
Raw materials and starting materials
Mineral-derived materials may contain accompanying salts or trace elements. Chemical starting materials may contain related compounds or residual reagents. Supplier controls, incoming tests and appropriate purification reduce these contributions.
Manufacturing process
Incomplete reactions leave starting materials or intermediates. Side reactions form by-products. Precipitation can trap mother liquor, and crystallisation can retain impurities if washing or purification is inadequate. Catalyst residues may remain after synthesis.
Process example: inadequate washing of crystals can leave soluble chloride or sulphate from the mother liquor. Improved washing must be demonstrated to remove the impurity without unacceptable product loss.
Reagents, solvents and water
Reagents can contain the same impurity being tested. Water may introduce ions, organic matter or microbial contamination. A chloride-contaminated reagent can generate turbidity even when the pharmaceutical sample itself is acceptable.
Equipment and processing aids
Corrosion, abrasion, metal surfaces, lubricants, filter materials and cleaning residues can contaminate materials. Equipment compatibility and cleaning controls are therefore part of impurity prevention.
Environment and handling
Dust, airborne moisture, CO2 and cross-contamination can alter materials. NaOH absorbs CO2 to form carbonate. Hygroscopic substances gain water, changing both composition and assay basis.
Containers and closures
Components can be released from glass, metals, plastics or elastomers under suitable conditions. Interaction depends on composition, pH, temperature, contact time and the formulation. A container should be suitable for the intended product and storage conditions.
Storage and decomposition
Hydrolysis is promoted by water where the chemistry permits it. Oxygen can cause oxidation; light can trigger photochemical change. Temperature may accelerate degradation. Incorrect closure or storage conditions can therefore change impurity content after release.
Prevention and control
| Source | Suitable control approach |
|---|---|
| Starting materials | Supplier qualification and incoming material checks |
| Reaction / purification | Process control, washing and demonstrated impurity removal |
| Water / reagents | Appropriate quality, clean preparation and blanks |
| Equipment | Compatible materials, maintenance and cleaning verification |
| Environment | Controlled handling and prevention of cross-contamination |
| Packaging / storage | Compatibility evaluation and suitable storage conditions |
Analytical contamination versus batch contamination
A contaminated test tube can make a clean batch appear impure. Investigate blanks and laboratory controls before assigning a batch failure. Conversely, a clean blank does not prove that the batch is acceptable; it only removes one potential explanation for the signal.
Answer structure For each source, state how the impurity enters, an example, and a control. A list of source names without explanation is an incomplete long answer.
1.14 Regulatory importance and impurity specifications
Impurity control protects patient safety and helps demonstrate consistent product quality. A specification combines tests, analytical procedures and acceptance criteria. An individual monograph may set limits for named impurities and direct the required sample preparation.
Important concepts
Reporting: document an impurity above the applicable reporting criterion. Identification: establish its chemical identity when required. Qualification: establish that an impurity at a proposed level is adequately supported from a safety perspective.
These concepts are different. Detecting a peak does not identify its structure, and identifying it does not by itself show that its level is acceptable.
Impurity-control frameworks
| Framework | Main area |
|---|---|
| Q3A | Impurities in new drug substances within its scope |
| Q3B | Degradation impurities in new drug products within its scope |
| Q3C | Residual solvents |
| Q3D | Risk assessment and control of elemental impurities |
Numerical criteria are not universal: scope, daily dose, route, impurity properties and applicable requirements matter. A classroom example limit must not be treated as the legal limit for every product.
Concentration and exposure
For an elemental impurity, daily exposure (μg/day) = concentration (μg/g) × daily product amount (g/day). A permitted daily exposure is an amount per day; ppm is a concentration. They must be linked through the amount administered.
Illustration: a product containing 2.0 μg/g of an impurity and used at 3.0 g/day contributes 6.0 μg/day from that product. Compare the exposure with the relevant requirement; the example does not assign a safety limit.
Classical tests and modern elemental control
Classical heavy-metal colour tests respond to some metals that form coloured sulphides under the chosen conditions. Different metals do not necessarily have equal response. A result expressed “as lead” does not identify every element or prove absence of all toxic elements.
Element-specific methods such as atomic absorption or ICP-based analysis can measure selected elemental impurities more directly when required. The suitable approach depends on the specification and risk assessment. Passing a traditional sulphide limit test alone does not establish compliance with a modern elemental-impurity framework.
Quality decision
Confirm that the method is valid for the sample before comparing with an acceptance criterion. Review blank results, interference, standard preparation and any prescribed suitability control. Record a conclusion that reflects what the test actually demonstrates.
Exam distinction An impurity limit is product- and method-specific. Do not write one fixed ppm value for all pharmaceutical substances unless the question supplies that value.
1.15 General principles of limit tests
A limit test is a semi-quantitative or threshold-oriented test used to decide whether a specified impurity exceeds an allowed level. The test sample develops a visible response and is compared with a standard containing a known permitted amount of the impurity.
Types of visible response
Turbidity / opalescence: a fine suspended precipitate scatters light, as with AgCl or BaSO4. Colour: a coloured complex or sulphide develops, as in iron or classical heavy-metal tests. Stain: a reaction on paper develops a local colour, as in a Gutzeit-type arsenic test.
Test, standard and blank
The test contains the prepared sample. The standard contains a known impurity amount corresponding to the permitted allowance. The blank assesses background from reagents and preparation. A method may require a reference containing some sample matrix or a spiked suitability preparation.
Conditions that must match
Tube internal diameter, glass quality and optical path.
Final volume and liquid depth.
Reagent concentration, sequence and quantity.
pH, reaction time, temperature and mixing.
Lighting, viewing direction and background.
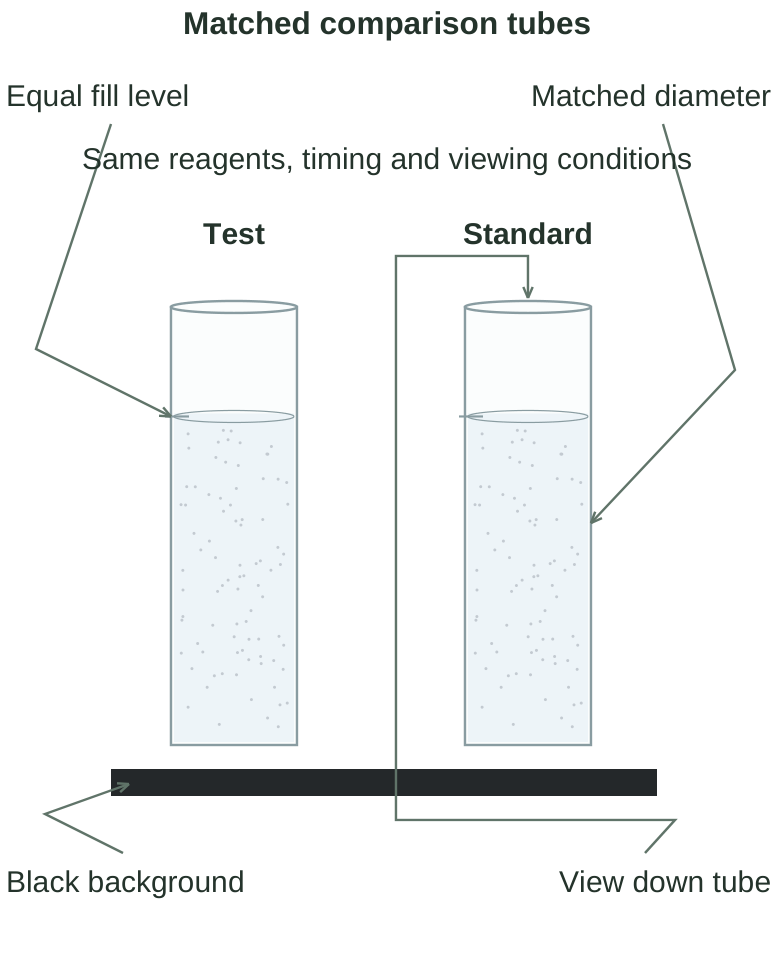
Diagram labels: Matched comparison tubes; Test; Standard; Equal fill level; Matched diameter; Black background; View down tube; Same reagents, timing and viewing conditions.
For chloride and sulphate opalescence, comparison is commonly made along the vertical axis in diffused light against a black background. For some colour tests, a white background is appropriate. Use the prescribed arrangement for the method.
Basic interpretation
If the method is valid and the test response is not greater than the permitted standard response, the sample complies with that limit test. If the test is stronger, it does not comply under those conditions. If the blank or suitability control is unacceptable, no valid pass/fail conclusion should be assigned from that run.
Calculating the standard allowance
For a limit L μg/g and a represented sample mass m g, allowed impurity mass = L × m μg. If only an aliquot is tested, use the amount of original sample represented by that aliquot, not the total original mass.
Example: 2.00 g sample is dissolved to 100.0 mL; 25.00 mL is tested. Represented sample mass = 2.00 × 25.00 / 100.0 = 0.500 g. At an illustrative 20 μg/g limit, the comparison amount is 10.0 μg.
If the working standard contains 5.00 μg/mL, use 10.0 / 5.00 = 2.00 mL, with the matched reagent and final-volume conditions required by the method.
Limit test versus identification and assay
An identification test demonstrates a characteristic reaction, often using a comparatively large amount. A limit test measures a response relative to a small permitted impurity amount. An assay produces a quantitative content result. The same chemistry can sometimes support different types of test, but the purpose and execution differ.
Long-answer template Principle → reaction → reagent roles → test and standard → comparison → precautions → conclusion.
1.16 Limit test for chloride
Principle and reaction
Chloride ions react with silver ions in a suitable nitric-acid medium to produce fine white silver chloride. The resulting opalescence is compared with a similarly treated chloride standard.
Ag+ + Cl- → AgCl↓
The measured response is the appearance of suspended AgCl, not a titration endpoint. A greater chloride amount generally produces a greater response under matched test conditions.
Reagents and their roles
| Reagent / material | Role |
|---|---|
| Silver nitrate | Supplies Ag+ to form silver chloride |
| Dilute nitric acid | Provides suitable acidity and reduces interference from species such as carbonate |
| Chloride standard | Provides the comparison amount representing the allowance |
| Purified water | Diluent that must not introduce chloride |
| Matched Nessler cylinders | Provide comparable liquid depth and optical geometry |
Why not HCl? Hydrochloric acid introduces chloride, the impurity being measured, and can falsely increase the response. Nitric acid is used in the usual chloride-test preparation instead.
Conceptual procedure
Step 1: prepare the specified quantity of sample as a clear test solution. Use the directed dissolution or pretreatment where the sample matrix requires it.
Step 2: prepare a chloride standard with the permitted comparison amount. Include a blank if required.
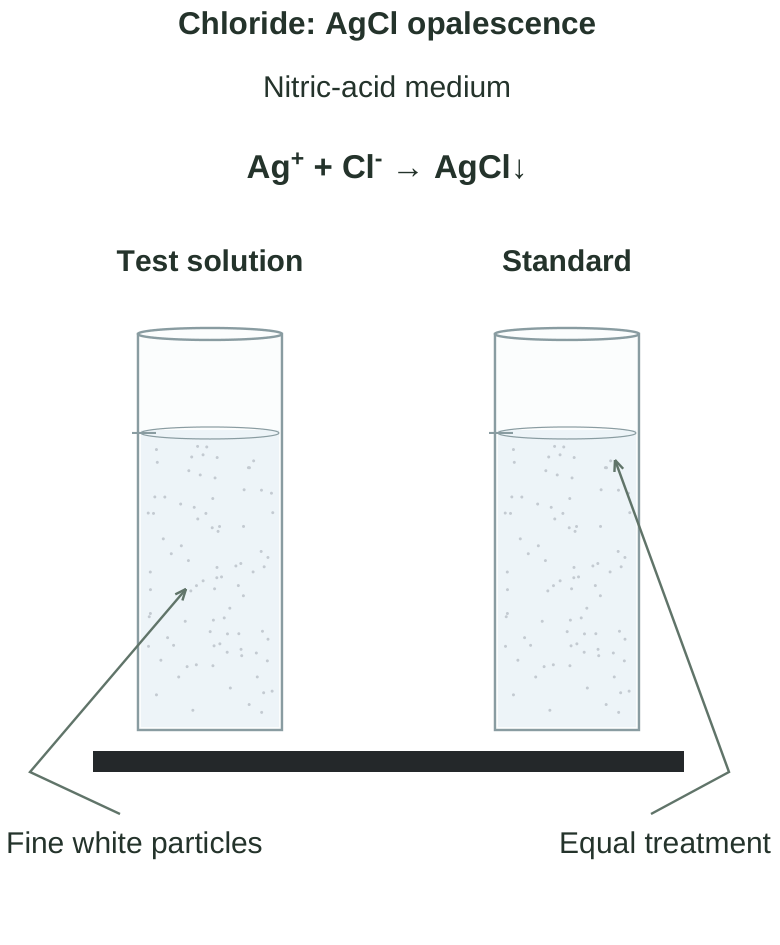
Diagram labels: Chloride: AgCl opalescence; Test solution; Standard; Ag+ + Cl- → AgCl↓; Fine white particles; Equal treatment; Nitric-acid medium.
Step 3: establish the specified acidity, reagent sequence and final dilution for both test and standard. Add the silver nitrate reagent and mix in the same manner.
Step 4: allow the prescribed development interval while protecting the preparations from inappropriate direct light.
Step 5: compare opalescence in matched tubes under the prescribed viewing conditions. The test complies if it is not more opalescent than the standard in a valid test.
Important precautions
Avoid chloride contamination from dirty glassware, water or reagents.
Prepare test and standard close together and compare at the same development time.
Do not confuse pre-existing sample cloudiness with newly formed AgCl.
Silver chloride is light-sensitive; intense direct light can change the appearance.
Keep volumes, acidity and mixing comparable; precipitation behaviour depends on these conditions.
Interferences
Bromide and iodide can also form poorly soluble silver salts and interfere where present. Carbonate or other ions may produce unwanted precipitates if conditions are inappropriate. A coloured or turbid sample may prevent a valid visual comparison and require a prescribed modified preparation.
Reporting example
“The test opalescence is not greater than that of the permitted chloride standard; the sample complies with the stated chloride limit under the test conditions.” Do not report “chloride absent,” because a complying sample can contain chloride below the allowance.
Memory key Chloride → silver nitrate → AgCl → white opalescence. Nitric acid, not hydrochloric acid.
1.17 Limit test for sulphate
Principle and reaction
Soluble sulphate reacts with barium ions in a suitable acidic medium to form fine white barium sulphate. Compare the resulting turbidity with a similarly prepared sulphate standard.
Ba2+ + SO4^2- → BaSO4↓
Barium sulphate is sparingly soluble. In a limit test it remains as a controlled suspension; it is not isolated and weighed as in gravimetric estimation.
Reagents and their roles
| Reagent / material | Role |
|---|---|
| Barium reagent | Supplies barium ions and, in some procedures, a controlled suspension for consistent development |
| Acid medium | Reduces interfering precipitation, particularly from carbonate under suitable conditions |
| Sulphate standard | Provides the permitted comparison amount |
| Alcohol, where specified | Influences suspension development and precipitation behaviour |
| Matched cylinders | Ensure comparable observation geometry |
The exact reagent composition differs among approved procedures. Some use a barium sulphate reagent or suspension rather than simply adding plain BaCl2. Such preparations promote reproducible formation of the suspension.
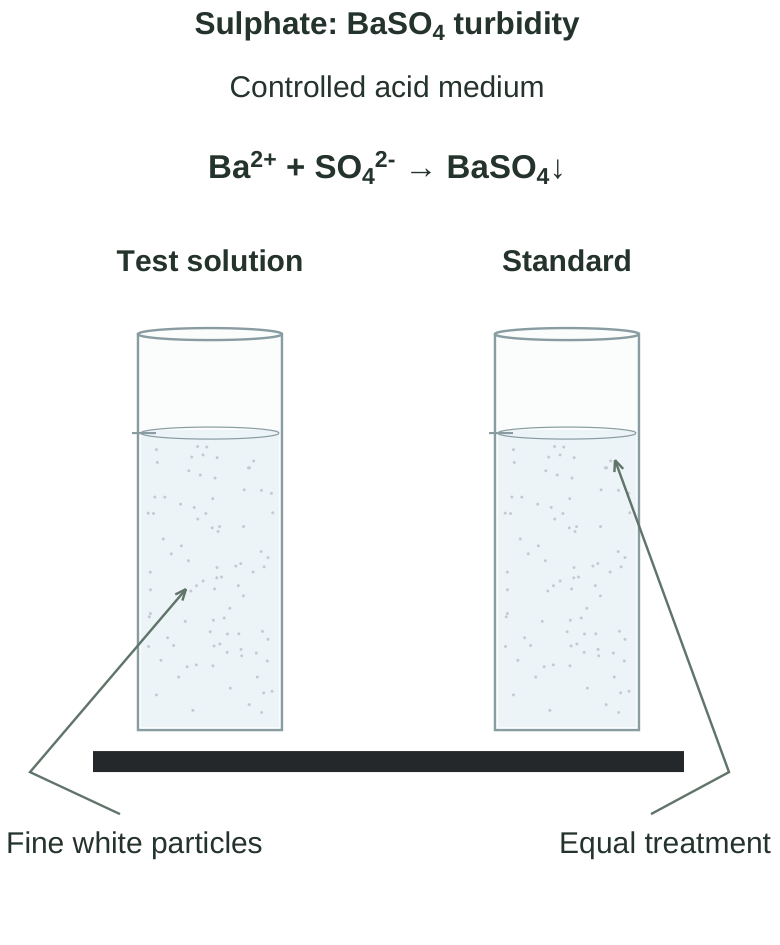
Diagram labels: Sulphate: BaSO4 turbidity; Test solution; Standard; Ba2+ + SO4^2- → BaSO4↓; Fine white particles; Equal treatment; Controlled acid medium.
Conceptual procedure
Step 1: dissolve or prepare the prescribed sample amount. Ensure that the solution is suitable for observing new turbidity.
Step 2: prepare a sulphate standard representing the permitted amount. Use the appropriate standard composition and sample-equivalent basis.
Step 3: bring test and standard to the required acidity and dilution. Add the specified barium reagent in the same sequence and quantity, and mix consistently.
Step 4: allow the prescribed development period. Compare turbidity along the required viewing axis in diffused light against the specified background.
Step 5: conclude compliance only if the test turbidity does not exceed the standard and the test conditions are valid.
Why acid is important
Carbonate can react with Ba2+ to form BaCO3. Suitable acid removes carbonate interference by converting carbonate / bicarbonate to CO2 and water. The required acidity must still be controlled, because changes in conditions can affect precipitation and comparison.
Why not H2SO4? Sulphuric acid supplies the impurity being tested. It should not be used to acidify an ordinary sulphate test. An appropriate sulphate-free acid is used according to the method.
Precautions and interference
Use sulphate-free reagents and clean tubes.
Keep reagent preparation, final volume and development time matched.
Remove prescribed matrix interference without losing sulphate.
Do not compare a settling coarse precipitate with a fine standard suspension.
Avoid confusing bubbles or pre-existing particles with BaSO4 turbidity.
Chloride versus sulphate
Both use precipitation and matched visual comparison. Chloride forms AgCl using Ag+; sulphate forms BaSO4 using Ba2+. Their reagents, acidity and development procedures must not be interchanged.
Memory key Sulphate → barium reagent → BaSO4 → white turbidity. Avoid sulphate-containing acid.
1.18 Limit test for iron
Principle
Iron develops a pink to purple colour with thioglycolic acid (mercaptoacetic acid) in an ammoniacal medium in the presence of citric acid. Thioglycolic acid reduces ferric iron to ferrous iron and supports formation of the coloured iron-thioglycolate complex.
This is a colour-comparison test, not the chloride or sulphate turbidity test. Compare the colour with a similarly prepared iron standard.
Chemical sequence
Reduction: 2Fe3+ + 2RSH → 2Fe2+ + RSSR + 2H+, where RSH represents thioglycolic acid.
Colour formation: Fe2+ + thioglycolate ligand → coloured complex in alkaline medium. The second expression is a conceptual complexation scheme, not a fully specified molecular formula.
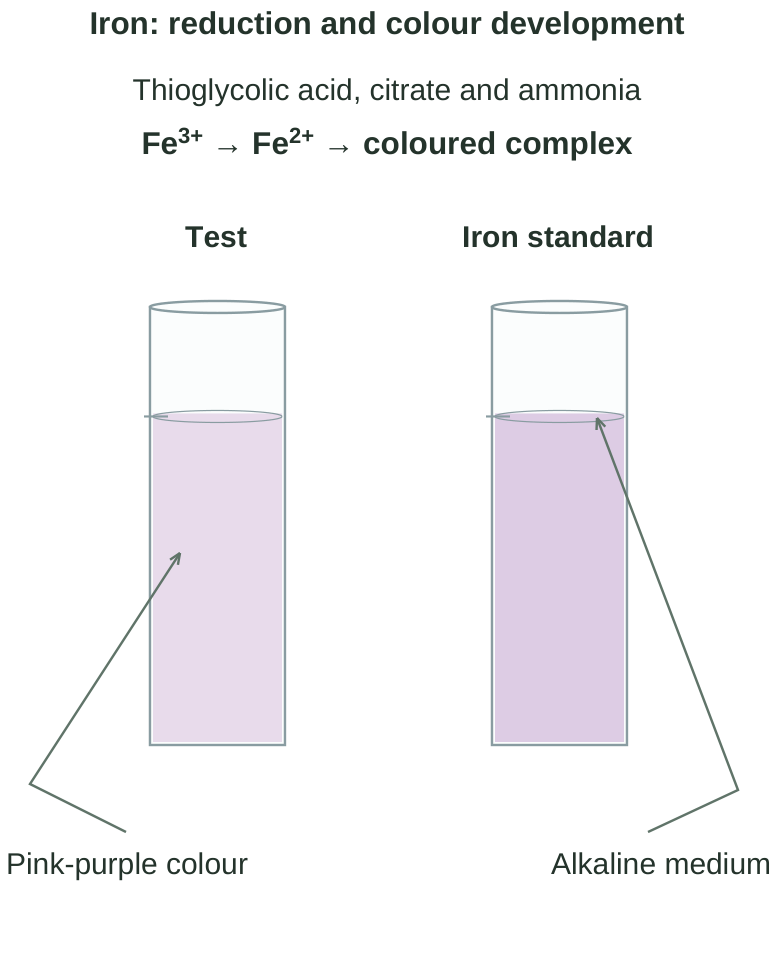
Diagram labels: Iron: reduction and colour development; Test; Iron standard; Fe3+ → Fe2+ → coloured complex; Thioglycolic acid, citrate and ammonia; Pink-purple colour; Alkaline medium.
Reagents and roles
| Reagent | Function |
|---|---|
| Thioglycolic acid | Reduces Fe3+ and supports colour-forming complexation |
| Citric acid | Complexes iron and helps prevent hydroxide precipitation when alkalinity is established |
| Ammonia | Makes the medium alkaline for colour development |
| Iron standard | Provides the permitted comparison amount |
| Iron-free water and reagents | Avoid additional iron contamination |
Citric acid is not the principal colour-producing reagent. Ammonia does not itself identify iron. The reagent roles must be explained together to account for a clear coloured preparation.
Conceptual procedure
Step 1: prepare the specified sample quantity or directed solution in a matched cylinder.
Step 2: add iron-free citric acid and thioglycolic acid in the required amounts. Mix.
Step 3: establish the required alkaline condition with iron-free ammonia. Dilute and mix as directed.
Step 4: prepare the standard through the same reagent sequence and allow the same colour-development interval.
Step 5: compare the colour under the prescribed conditions, commonly against a white background. The sample complies when the test is not more intensely coloured than the standard in a valid comparison.
Precautions
Use clean equipment and avoid iron from corrosion or metal tools.
Use suitable iron-free reagents; reagent contamination raises the background.
Maintain the specified alkalinity and compare at a consistent time.
Avoid an inherently coloured or cloudy sample obscuring the developed colour.
Ensure ferric iron is reduced appropriately; do not assume the sample contains only Fe2+.
Why the sequence matters
If iron forms an unwanted hydroxide precipitate, a clear solution suitable for colour comparison may not develop. The citrate environment and subsequent alkalinity are therefore part of the chemistry, not optional additions.
Common wrong statements
Thioglycolic acid does not oxidise Fe2+ to Fe3+ in the usual explanation of this test. The desired signal is a coloured complex, not brown ferric hydroxide. Passing the test does not mean iron is completely absent.
Memory key Thioglycolic acid: reduction and colour. Citrate: keep iron in suitable solution. Ammonia: alkaline medium.
1.19 Limit test for arsenic: Gutzeit principle
Principle
In a classical Gutzeit-type test, arsenic in a suitably prepared solution is reduced to arsine gas, AsH3. The gas passes through a purification section and reacts with the specified mercury-salt paper to produce a yellow to brown stain. Compare the test stain with a similarly generated standard stain.
Some procedures use mercuric chloride paper; others use mercuric bromide paper. State the reagent belonging to the procedure being described and do not mix the two versions into one exact recipe.
Reduction chemistry
Zinc reacts with acid and supplies reducing conditions while hydrogen evolves: Zn + 2H+ → Zn2+ + H2↑.
A useful net reduction representation for arsenic(III) is As2O3 + 6Zn + 12H+ → 2AsH3 + 6Zn2+ + 3H2O. It represents the overall change rather than every reaction occurring in the generator.
Arsine then reacts with the mercury-salt paper to produce coloured arsenic-mercury reaction products. The appearance depends on the paper, arsenic amount and conditions, so a single simplistic stain-product formula is not necessary for explaining the comparison.
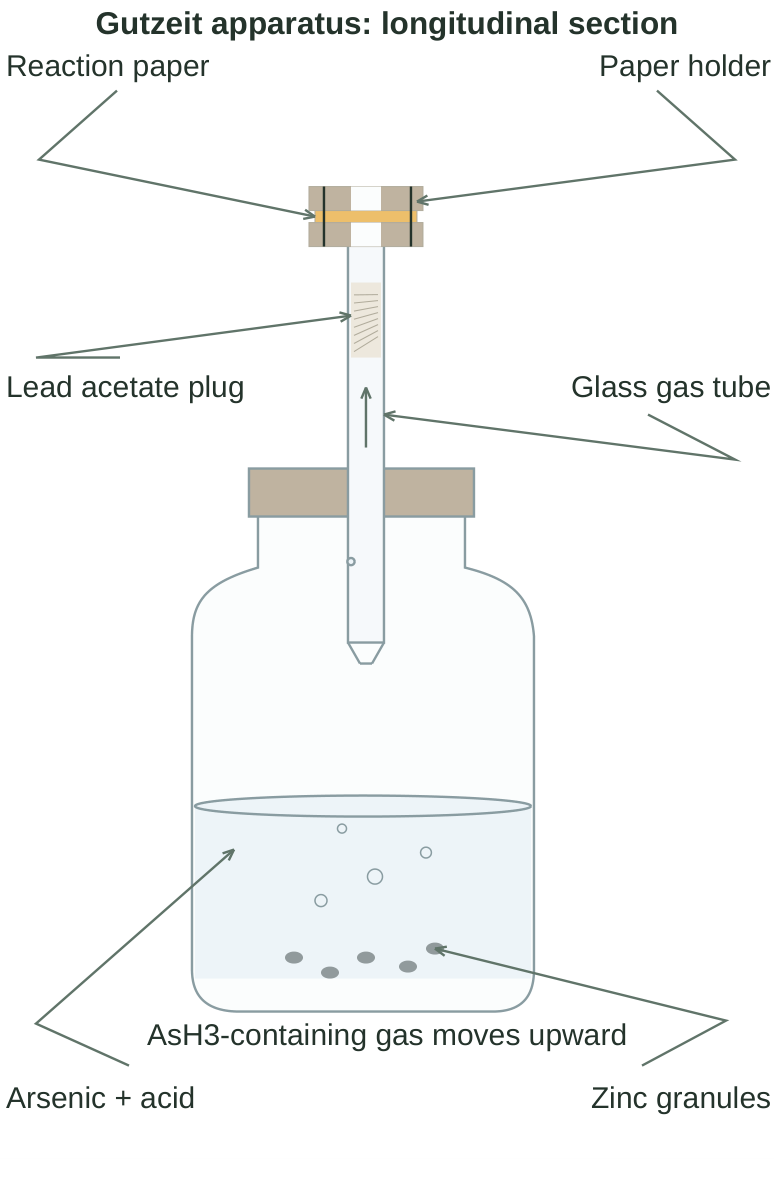
Diagram labels: Gutzeit apparatus: longitudinal section; Reaction paper; Paper holder; Lead acetate plug; Glass gas tube; Arsenic + acid; Zinc granules; AsH3-containing gas moves upward.
Apparatus and reagent roles
| Part / reagent | Role |
|---|---|
| Generator bottle | Contains prepared sample and gas-generating reagents |
| Arsenic-free zinc and acid | Generate reducing conditions and the gas stream |
| KI and stannous reagent, where specified | Help establish a suitable reduced arsenic state |
| Lead acetate-treated plug | Removes interfering H2S before it reaches the test paper |
| Glass delivery tube | Directs gas through the treatment section to the paper |
| Mercury-salt paper and holder | Develop and confine the comparison stain |
Conceptual procedure
Step 1: prepare the sample so the arsenic of interest enters the test solution. Prepare a suitable arsenic standard through a comparable procedure.
Step 2: assemble the specified gas path, purification plug and dry reaction paper. Connections must direct the gas through the paper without leakage or bypass.
Step 3: establish the prescribed reducing conditions and gas evolution. Maintain the defined development time and temperature conditions.
Step 4: compare test and standard stains promptly, using the same illumination and exposure conditions. A stain no darker than the standard supports compliance when suitability requirements are met.
Why the purification plug is needed
Hydrogen sulphide can stain or interfere with the mercury-salt paper. Lead acetate captures it as lead sulphide: Pb2+ + H2S → PbS↓ + 2H+. Its purpose is gas purification, not arsenic quantitation.
Precautions and method limits
Use arsenic-free reagents and a suitable preparation that does not lose arsenic. Keep gas evolution controlled, the reaction paper appropriately dry and the comparison time matched. Stains can fade on storage.
Arsine is highly toxic and the reagents include toxic mercury and lead compounds. The apparatus sketch explains the chemistry; execution requires a trained, supervised laboratory with appropriate containment and disposal.
Memory key Arsenic → arsine gas → mercury-salt paper → stain. Lead acetate removes H2S interference.
1.20 Limit test for lead: dithizone method
Principle
Lead reacts with dithizone (diphenylthiocarbazone) under suitable conditions to form a red lead-dithizonate complex that can be extracted into an organic solvent such as chloroform. Compare the treated sample with a lead standard prepared under matched conditions.
Free dithizone in the organic solvent is typically green. The extracted lead complex is red; the visible mixture depends on lead content, reagent excess and the procedure. A green reagent colour alone is not a lead-positive result.
Conceptual complexation
Pb2+ + dithizone → red lead-dithizonate complex under the required extraction conditions. If a simplified ligand notation is used, Pb2+ + 2HDz → Pb(Dz)2 + 2H+; HDz denotes the reactive acid form of the ligand.
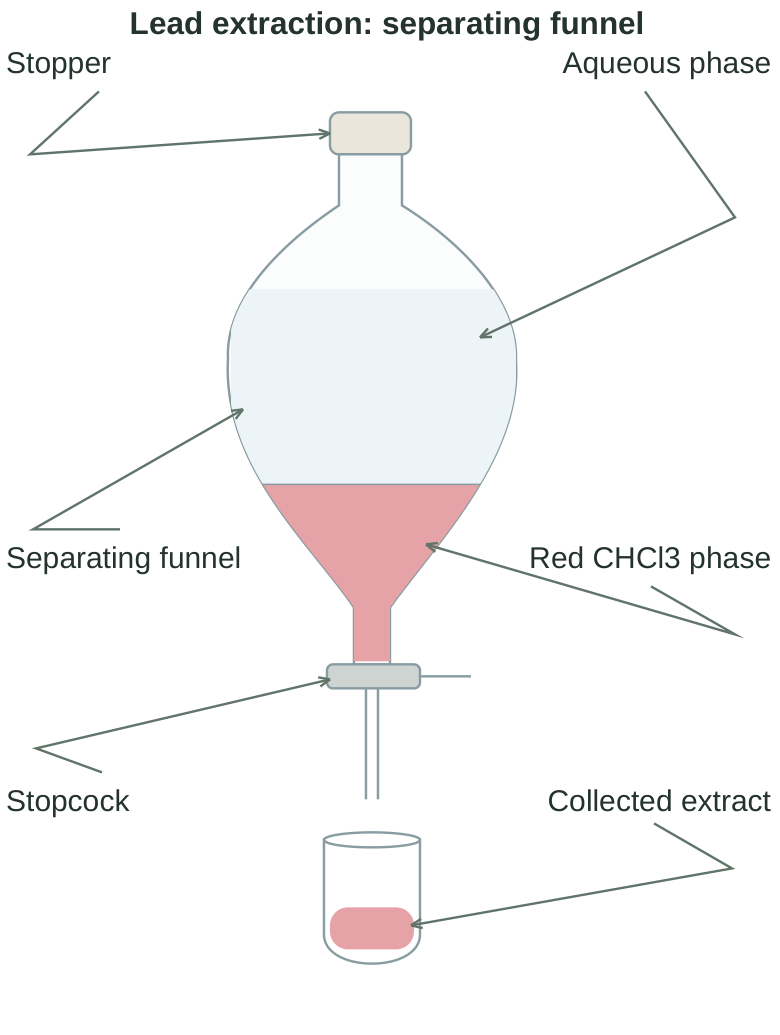
Diagram labels: Lead extraction: separating funnel; Stopper; Aqueous phase; Separating funnel; Red CHCl3 phase; Stopcock; Collected extract.
Reagent roles
| Reagent / material | Role |
|---|---|
| Dithizone solution | Colour-forming complexing reagent |
| Organic solvent | Extracts the coloured lead complex into a separate phase |
| Ammonium citrate, where specified | Helps maintain suitable metal complexation and solution conditions |
| Ammonia | Establishes the required alkaline extraction condition |
| Masking / reducing reagents | Reduce interference according to the specified method |
| Lead standard | Provides the permitted comparison amount |
Classical procedures may include hydroxylamine hydrochloride and cyanide-containing masking reagents. Their exact roles and sequence belong to that procedure; they are not interchangeable with arbitrary substitutes.
Conceptual procedure
Step 1: prepare the sample solution without introducing or losing lead. Transfer an appropriate portion to a clean separating funnel.
Step 2: establish the prescribed pH and interference-control conditions. Prepare the reference and blank consistently.
Step 3: extract with the specified dithizone solution. Mix and allow complete phase separation. Use the prescribed extraction or purification sequence rather than assuming one extraction always suffices.
Step 4: compare the final organic-phase colour with the treated lead standard. Use comparable solvent volumes, reagent excess and optical path.
Step 5: conclude compliance only when the test colour is not stronger than the permitted standard and the method controls are satisfactory.
Phase identification
Chloroform is denser than ordinary aqueous solutions and normally forms the lower layer. This is why the lead-complex layer is drawn below the aqueous layer in the figure. Do not label every organic solvent as the upper layer.
Interferences and precautions
Other metals can also react with dithizone. Suitable pH, masking and extraction conditions improve selectivity. Persistent emulsions prevent a clean comparison. Lead contamination from glassware or reagents can create false positive background.
Use equal final extract volumes and compare under the same lighting conditions. A faint colour is meaningful only relative to the blank and permitted standard.
Classical extraction reagents can be toxic; cyanide reagents must not be acidified because hydrogen cyanide may be released. The test is a supervised laboratory method, not a home experiment.
Exam distinction Lead limit test: red extracted dithizonate complex. Heavy-metal limit test: colour from sulphides, commonly compared as lead. They are different tests.
1.21 Limit test for heavy metals
Principle
The classical test compares the colour produced by metallic impurities that form coloured sulphides under the stated conditions with a lead reference. The result is commonly expressed in terms of an amount of lead per mass of test substance.
A sulphide source such as thioacetamide reagent is used in a controlled acidic medium in appropriate procedures. Older variants use other sulphide sources. Describe one stated method consistently.
Illustrative reactions
Thioacetamide hydrolysis can be represented as CH3CSNH2 + H2O → CH3CONH2 + H2S under suitable reagent conditions.
For lead: Pb2+ + H2S → PbS↓ + 2H+. Lead sulphide is dark. Other responding metals form sulphides with different colours and sensitivities, so this is not an equally sensitive test for all elements.
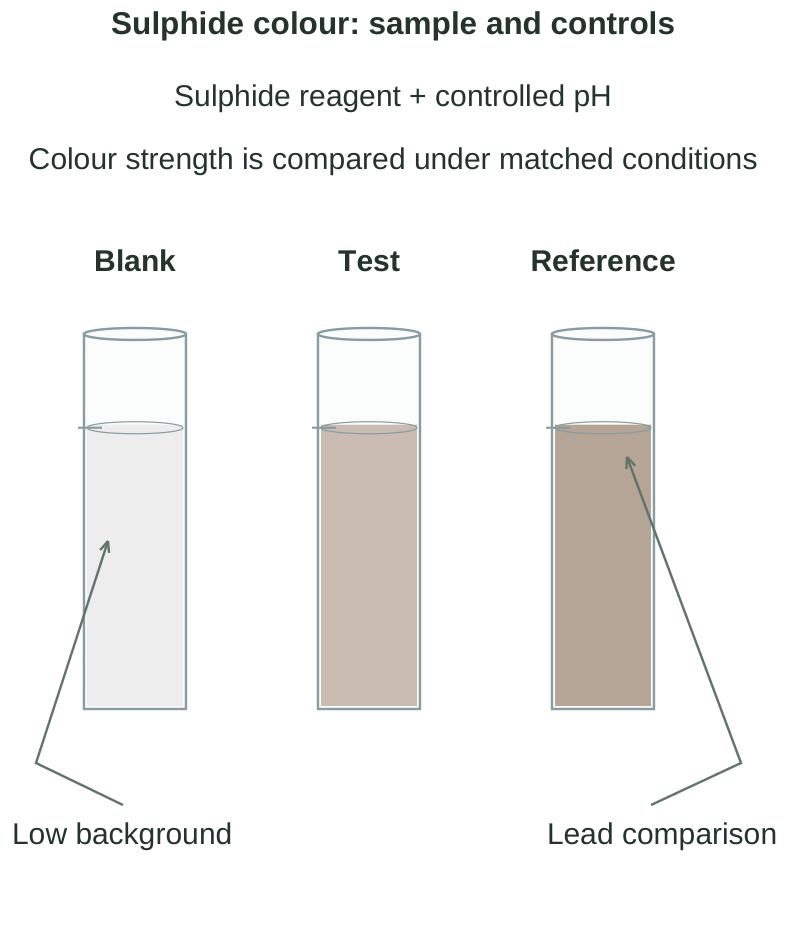
Diagram labels: Sulphide colour: sample and controls; Blank; Test; Reference; Sulphide reagent + controlled pH; Low background; Lead comparison; Colour strength is compared under matched conditions.
Reagents and their roles
| Reagent / preparation | Role |
|---|---|
| Thioacetamide reagent | Provides sulphide under the specified conditions |
| Acetate buffer, commonly near pH 3.5 | Controls acidity for reproducible sulphide development |
| Lead reference | Defines the comparison response “as lead” |
| Blank | Checks reagent / preparation background |
| Spiked or monitor preparation, when required | Checks that the sample permits the expected response |
Sample preparation variants
Direct solution: appropriate for a suitably soluble material whose matrix does not prevent the reaction or comparison. Digestion / ignition: a prescribed treatment may be needed for organic, insoluble or interfering materials. It must release the relevant impurity without unacceptable loss or contamination.
The preparation belongs to the monograph or method. Igniting every sample without justification can lose volatile material or introduce contamination; omitting required digestion can leave metals unavailable for reaction.
Conceptual procedure
Step 1: prepare test, lead reference and blank as directed; prepare a monitor when required.
Step 2: establish the specified buffer condition and add the sulphide-producing reagent equally.
Step 3: allow the required development interval and compare the colour or coloured residue according to the method.
Step 4: verify the reference is distinguishable from the blank and any monitor response satisfies the method requirement.
Step 5: the sample complies if its response is no stronger than the reference in a valid test.
Limitations
The test does not identify each metal. Some elemental impurities may respond poorly or not be adequately assessed. Matrix effects, pH and sulphide generation can alter the result. A sample that suppresses the reaction could appear falsely acceptable unless suitability controls are considered.
Meaning of “as lead”
It means the response is compared with a lead reference under that method. It does not mean every impurity present is lead or that all responding metals have the same mass-response relationship.
Memory key Sulphide source + controlled pH → coloured metal sulphides → compare with lead reference. This is a classical group-response test.
1.22 Modified limit tests for chloride and sulphate
A modified limit test adapts sample preparation or comparison to a matrix that cannot be tested fairly by the ordinary procedure. The final chloride reaction remains AgCl formation; the final sulphate reaction remains BaSO4 formation.
The modification removes colour, insolubility, excessive alkalinity, gas evolution or another interference. It must not introduce the impurity, remove it selectively or change its represented amount without accounting for that change.
Coloured oxidising material: permanganate example
The strong purple colour of a permanganate solution masks an ordinary visual comparison. A prescribed preparation can reduce the permanganate with alcohol under controlled conditions, separate the manganese-containing residue, and use the resulting clear preparation for the impurity test.
In conditions that produce MnO2, the brown solid must be removed by the directed filtration and washing steps. Reduction products depend on the medium; do not assume the same manganese product in every permanganate reaction.
Step 1: follow the directed pretreatment to remove the interfering colour.
Step 2: cool, filter or otherwise clarify as specified.
Step 3: account for final volume and aliquot.
Step 4: apply the ordinary chloride or sulphate comparison chemistry to the prepared solution.
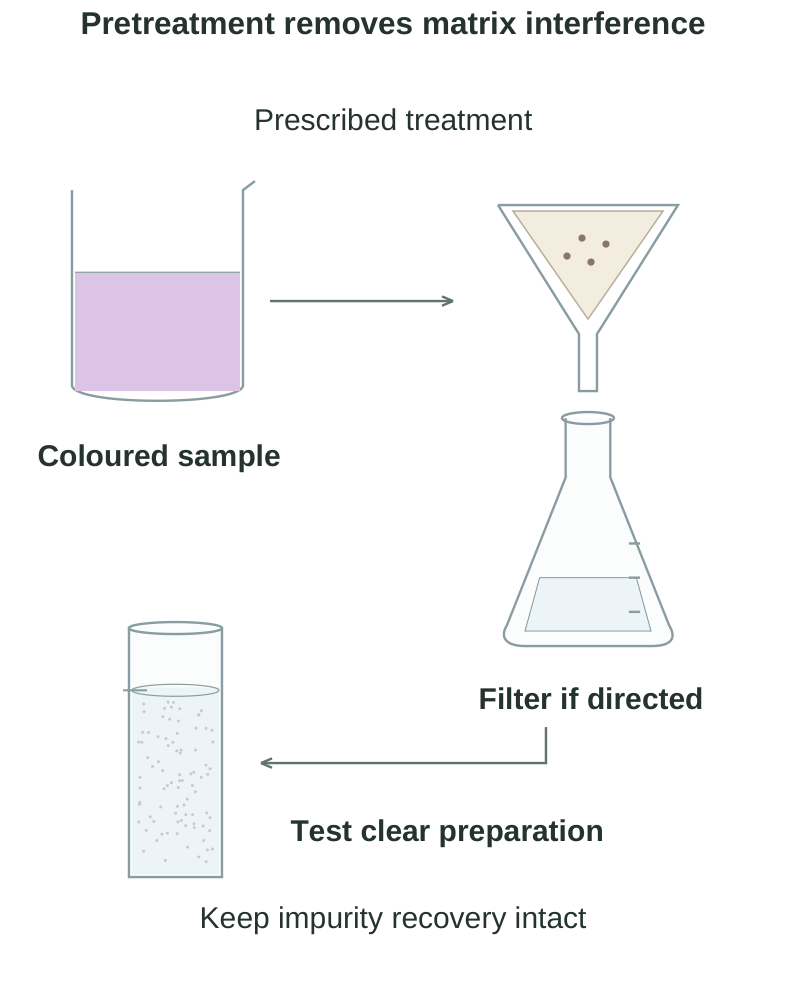
Diagram labels: Pretreatment removes matrix interference; Coloured sample; Prescribed treatment; Filter if directed; Test clear preparation; Keep impurity recovery intact.
For a chloride test, a chloride-containing pretreatment reagent can create a false result. For a sulphate test, sulphuric acid or a sulphate-containing reagent can do the same. A reagent suitable for one preparation may therefore be unsuitable for the other.
Bicarbonate and carbonate matrices
Alkaline carbonate or bicarbonate can interfere with precipitation and produce CO2 on acidification. Neutralise with the appropriate impurity-free acid according to the method, allow the prescribed gas removal and temperature equilibration, then make the required volume adjustment.
HCO3 – + H+ → CO2↑ + H2O
For chloride testing, avoid HCl as an unaccounted source of chloride. For sulphate testing, avoid H2SO4 as an unaccounted source of sulphate. Nitric acid or hydrochloric acid may be suitable in different directed preparations depending on which impurity is measured.
Insoluble or cloudy sample
Use the specified dissolution, extraction or digestion method. Simple filtration is valid only if it is known not to remove the impurity being assessed. Adsorption or co-precipitation onto a residue can give a falsely low result.
Validity of a modification
Check a process blank and use a suitable spiked preparation where required. Demonstrate that the impurity remains detectable after treatment. A clearer sample is not sufficient evidence that the modification is valid.
Ordinary versus modified test
| Feature | What changes / what remains |
|---|---|
| Sample preparation | May change to address the matrix |
| Chloride signal | AgCl opalescence remains the basis |
| Sulphate signal | BaSO4 turbidity remains the basis |
| Standard and controls | Must match the relevant treatment and comparison conditions |
| Acceptance logic | Test response must not exceed permitted standard in a valid test |
Exam caution Do not invent one universal modified recipe for every substance. State the matrix problem, prescribed treatment, reagent restrictions and unchanged comparison principle.
1.23 Limit-test comparison map
| Impurity | Chemistry and visible response |
|---|---|
| Chloride | AgNO3 in suitable nitric-acid conditions; white AgCl opalescence |
| Sulphate | Barium reagent in suitable acid conditions; white BaSO4 turbidity |
| Iron | Thioglycolic acid, citrate and ammonia; pink-purple complex |
| Arsenic | Reduction to AsH3 followed by mercury-salt paper reaction; stain |
| Lead | Dithizone extraction under suitable conditions; red organic-phase complex |
| Heavy metals | Sulphide development under controlled pH; colour compared as lead |
Reagent-role questions
Why nitric acid in the chloride test? It supplies suitable acidity without adding chloride, unlike HCl. Why acid in the sulphate test? It reduces unwanted precipitation from interfering species such as carbonate. Why citrate in the iron test? It helps keep iron in an appropriate soluble complexed condition during alkalinisation.
Why lead acetate in the arsenic apparatus? It removes H2S before the gas reaches the reaction paper. Why dithizone in the lead test? It forms an extractable coloured lead complex. Why a buffer in the heavy-metal test? It controls sulphide development conditions and therefore comparison behaviour.
Match the measurement to the conclusion
White opalescence is not an arsenic stain. A purple iron colour is not a lead-dithizonate extract. A strong sample colour before adding reagents is a matrix interference, not automatically a positive impurity response.
Worked problem 1: allowed impurity amount
An illustrative impurity limit is 15 μg/g and the tested preparation represents 1.20 g of sample. Permitted amount = 15 × 1.20 = 18 μg. For a 3.0 μg/mL working standard, required volume = 18 / 3.0 = 6.0 mL. Match the final comparison conditions; do not compare unequal liquid depths.
Worked problem 2: percentage to ppm
An impurity is present at 0.0035% w/w. ppm = 0.0035 × 10,000 = 35 ppm by mass. In 0.500 g sample, impurity mass = 35 μg/g × 0.500 g = 17.5 μg.
Worked problem 3: sample-equivalent mass
3.00 g sample is prepared to 150.0 mL and 20.00 mL is tested. Represented mass = 3.00 × 20.00 / 150.0 = 0.400 g. A 25 μg/g comparison limit corresponds to 10.0 μg, not 75 μg in the tested tube.
Worked problem 4: dilution-factor error
A sample is diluted 5.00 mL to 100.0 mL. The measured diluted solution contains 0.40 mg/mL. DF = 20.0; original concentration = 8.0 mg/mL. Reporting 0.40 mg/mL as the original result gives a twenty-fold error.
Case: test stronger than standard, blank also turbid
The comparison cannot yet support a reliable batch conclusion because reagent or preparation contamination is possible. Investigate the blank, replace unsuitable reagents or glassware, and repeat through the approved laboratory procedure. Do not simply subtract cloudiness visually.
Case: all titres agree but concentration is wrong
Investigate titrant strength, standard purity, pipette calibration, reaction stoichiometry and end-point bias. Agreement supports precision; it does not rule out systematic error.
Formula map Concentration × volume = amount for a compatible concentration basis. ppm × grams = micrograms for a mass-fraction impurity. Actual / nominal = titrant factor.
1.24 Quick revision
Analysis establishes identity, strength, purity and relevant quality behaviour.
% w/v means g per 100 mL of final solution.
Molarity uses solution volume; molality uses solvent mass.
Normality requires a specified reaction and n-factor.
A primary standard establishes a known amount; secondary solutions require standardisation.
Systematic error creates bias; random error creates scatter; gross error is a mistake.
Accuracy concerns the reference; precision concerns agreement among results.
Impurities can be process-related, introduced externally or formed by degradation.
Limit tests compare an impurity response with a permitted standard.
Modified tests address matrix interference while retaining the appropriate reaction basis.
Common mistakes to avoid
Using HCl in a chloride-test preparation without accounting for introduced chloride.
Using H2SO4 to acidify an ordinary sulphate test.
Confusing iron complex colour with ferric hydroxide precipitation.
Labelling the chloroform layer as the upper layer.
Treating all metals as equally sensitive in the sulphide test.
Writing “impurity absent” when only a limit test has been passed.
Rounding every intermediate calculation or omitting aliquot factors.
Final check Units – reaction – represented sample amount – valid comparison – justified conclusion. These five checks prevent most calculation and limit-test errors.
Short-answer practice
1. Define pharmaceutical analysis and distinguish identity, assay and limit testing.
2. Define % w/w, % w/v, molarity and molality.
3. Explain why normality depends on the reaction.
4. State the properties of a primary standard with two examples.
5. Distinguish accuracy and precision using a numerical example.
6. Explain systematic, random and gross errors.
7. State the roles of citrate, thioglycolic acid and ammonia in the iron test.
8. Why is the lead acetate plug used in the arsenic apparatus?
Long-answer practice
1. Describe sources of impurities with examples and controls.
2. Explain chloride and sulphate limit tests through reaction, reagent roles and comparison.
3. Describe the Gutzeit arsenic principle with a labelled apparatus.
4. Compare the dithizone lead test and the sulphide heavy-metal test.
5. Explain modified chloride and sulphate tests and how matrix interference is addressed.
Numerical practice
1. Calculate NaCl required for 500.0 mL of 0.1000 M solution. Answer: 2.922 g.
2. Convert 1 in 2000 w/v to percentage. Answer: 0.05% w/v.
3. Find the allowance for 0.750 g at 20 μg/g. Answer: 15 μg.
4. A result is 19.6 mg against 20.0 mg. Find signed percentage error. Answer: -2.0%.
5. Prepare 250.0 mL of 0.0200 M from 0.1000 M stock. Answer: take 50.00 mL and dilute to 250.0 mL.
Answer-writing checklist
Define the test, write the correct chemistry, explain reagent roles, distinguish test and standard, draw meaningful labels, describe the observation and state the comparison criterion.