
Course: AKTU B.Tech 2nd Year | Semester III
Course Code: BBT302
Branch: Biotechnology (BT)
Unit I Overview
Learn how bacterial structure connects with classification, cultivation, preservation and control. The unit also develops reliable population measurements and growth-kinetics calculations, with labelled illustrations and complete worked solutions.
Topics Covered
| Syllabus Area | Pages |
|---|---|
| Morphology and bacterial ultrastructure | 2–6 |
| Classification of bacteria | 6–7 |
| Microscopy and culture media | 7–8 |
| Isolation, culture and identification | 8–11 |
| Preservation of cultures | 11–11 |
| Methods for microbial control | 11–14 |
| Enumeration of bacteria | 14–16 |
| Microbial growth kinetics | 16–17 |
| Solved problems and revision | 17–21 |
Learning Outcomes
- Describe cell parts and relate them to bacterial functions.
- Compare classification approaches, media and isolation methods.
- Explain culture preservation and physical or chemical control.
- Choose an enumeration method and interpret its limitations.
- Solve dilution, growth-rate, yield and inactivation problems.
Included in These Notes
42 explained sections; 30 labelled illustrations and plots; 10 actual photographs; written explanations of all 40 visuals; 12 solved problems with complete steps, answers and checks; comparison tables; answered revision questions and a formula sheet.
Study Approach
Understand the structure. Identify the envelope, cytoplasmic components and optional structures before learning their functions.
Choose by purpose. Separate isolation, identification, preservation, control and enumeration.
Calculate with units. Write the dilution fraction, measured volume, logarithm base and time basis.
Revise with reasoning. Use the answered checks and draw labelled diagrams from memory.
Key distinction: Cells, CFU, optical density and biomass are different measurements. A correct numerical answer states which biological quantity was measured and the assumptions used.
1. Microbiology: Scope and Working Vocabulary
Microbiology studies microscopic organisms and agents. Bacteria, archaea, microscopic fungi, protozoa and algae are cellular; viruses are acellular and require host cells for reproduction. Microbes support nutrient cycling, fermentation, wastewater treatment and biotechnology; only some cause disease.
A culture is a microbial population maintained on or in a medium. An inoculum initiates a culture; a colony is visible local growth on solid medium. A pure culture contains the intended single microbial type; a mixed culture contains more than one. Contamination is unintended introduction.
Unit I connects cell structure with cultivation, identification, preservation, control, counting and growth.
2. Bacterial Size, Morphology and Cellular Arrangements
Most familiar bacteria are measured in micrometres, with important exceptions. A calibrated scale is needed for exact size.
Shapes include:
- Cocci: Spherical cells.
- Bacilli: Rod-shaped cells.
- Coccobacilli: Short rods.
- Vibrios: Curved rods.
- Spirilla: Rigid helices.
- Spirochetes: Flexible helices.
- Filamentous, branched and pleomorphic forms also occur.
Division planes and daughter-cell separation determine arrangement: pairs, chains, clusters, tetrads and packets.
Memory: strepto- suggests chains; staphylo- suggests grape-like clusters.
Shape and arrangement aid description, but cannot alone identify a species. Capitalised italic Bacillus names a genus; lower-case bacillus can describe a rod.
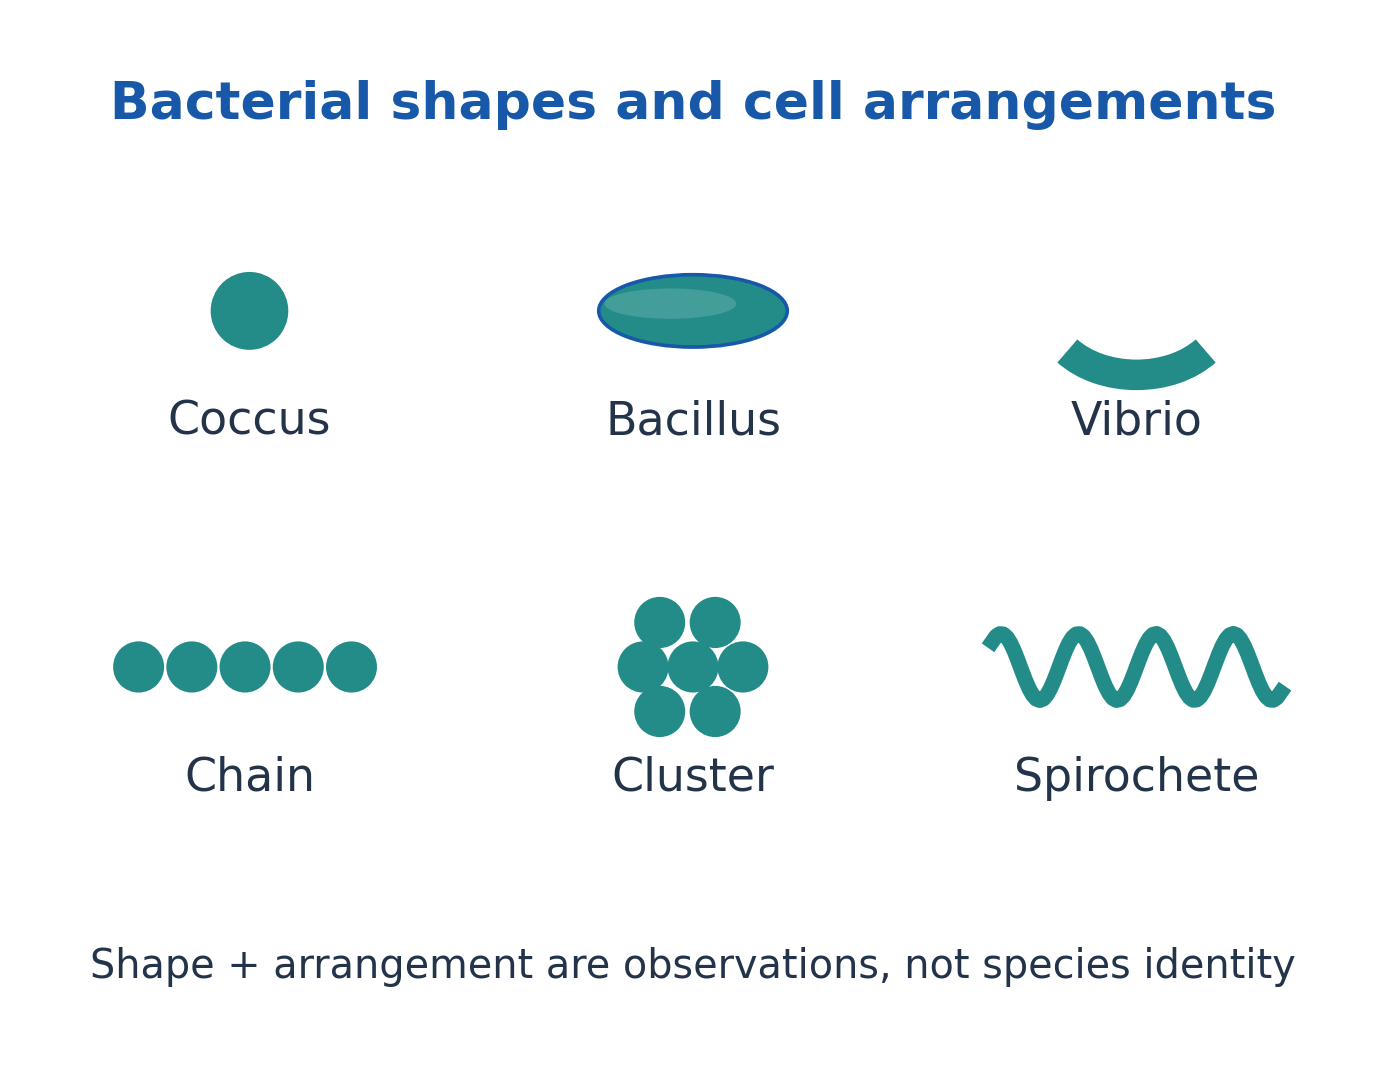
Figure explanation: Coccus, bacillus and vibrio illustrate spherical, rod and curved-rod shapes. Chains and clusters describe arrangements, while a spirochete illustrates a helical form. Shape and arrangement are observations; they do not establish species identity.
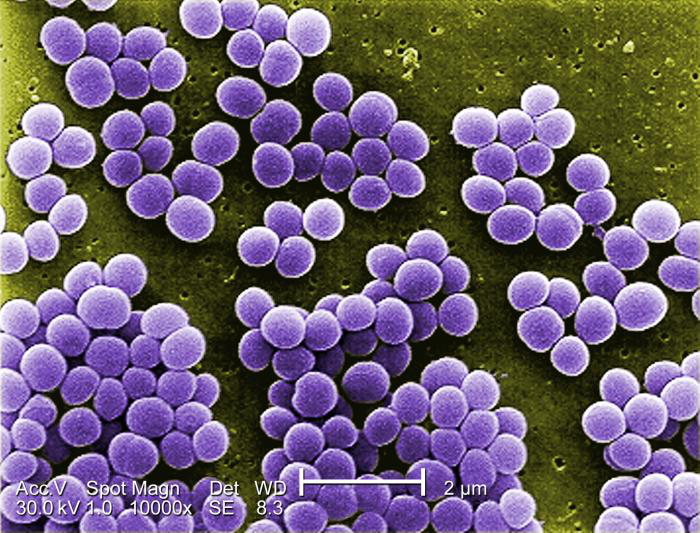
Figure explanation: The colourised SEM shows spherical cells grouped in clusters. Use the photograph to recognise arrangement; the colour is added to the micrograph and is not a Gram-stain reaction.
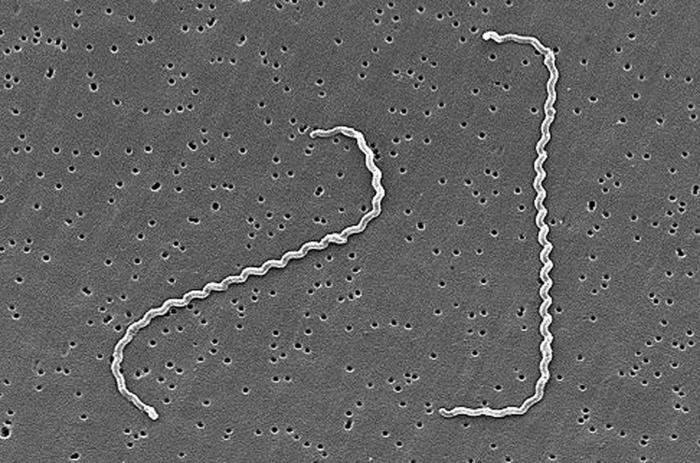
Figure explanation: The SEM shows a slender helical cell. Its appearance demonstrates spiral morphology; exact size must come from a calibrated scale rather than the displayed image dimensions.
3. The Bacterial Cell: A Labelled Structural Overview
The bacterial envelope separates cytoplasm from the environment. Most bacteria have a cytoplasmic membrane and a wall; some also have an outer membrane or glycocalyx.
The nucleoid contains chromosomal DNA without a conventional nuclear envelope. Cytoplasm contains ribosomes, enzymes, metabolites and sometimes storage inclusions.
The illustration combines features for teaching: capsule, plasmids and flagella are optional, and cell shape varies. Wall loss can increase vulnerability to osmotic bursting; membrane damage can disrupt selective transport and energy gradients.
A good labelled drawing distinguishes the envelope, nucleoid, ribosomes and optional structures rather than treating every dot as an organelle.
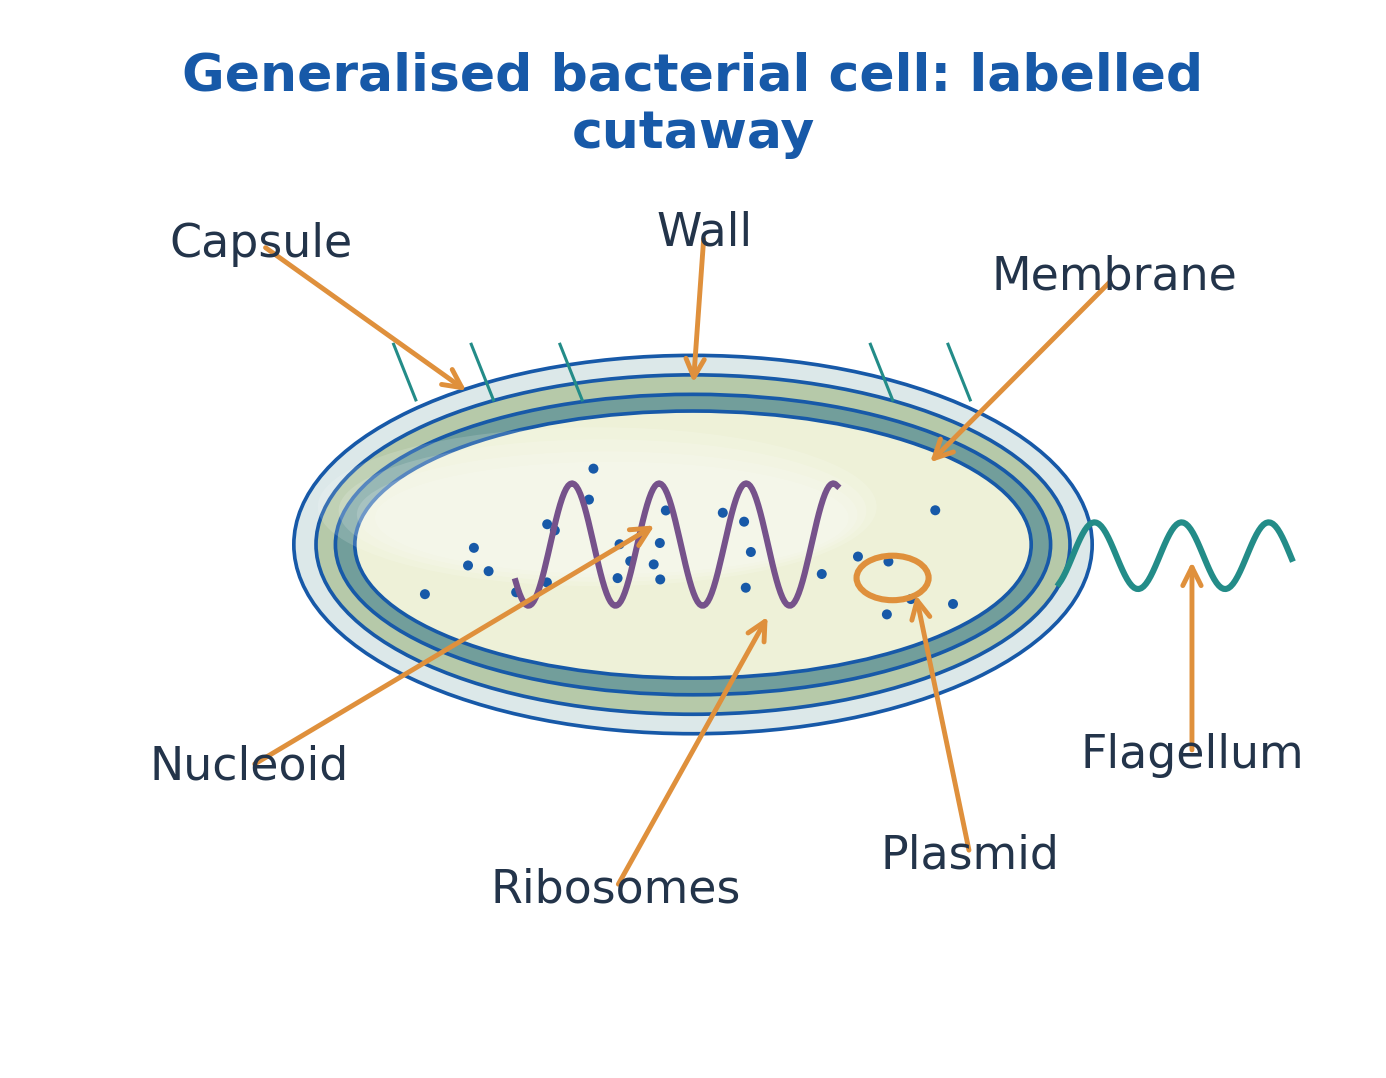
Figure explanation: Read the cutaway from outside inward: capsule, wall, membrane and cytoplasm. Internal labels identify nucleoid, ribosomes and plasmid; the external flagellum is a motility structure. The drawing combines features that need not occur together in every bacterium.
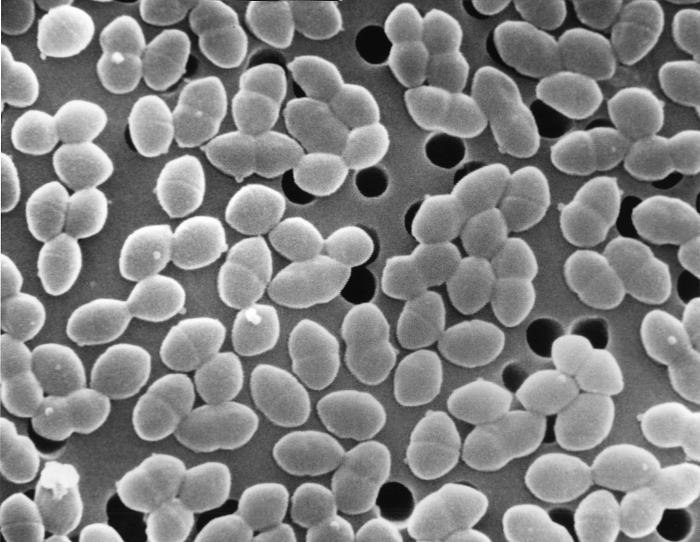
Figure explanation: The SEM shows cell surfaces and grouping. It supports observation of external appearance but does not reveal every internal component included in a bacterial cutaway.
4. Glycocalyx, Capsules, Slime Layers and Surface Association
A glycocalyx is extracellular material associated with a cell surface. A capsule is relatively organised and closely attached; a slime layer is more diffuse. Composition varies, often including polysaccharides.
These coverings can support adhesion, reduce drying and influence interactions with hosts or other microbes.
A biofilm is a surface-associated microbial community embedded in extracellular matrix, not one large capsule. Attachment, matrix development and dispersal connect its life cycle.
Matrix, nutrient gradients and altered physiology can reduce control effectiveness. Biofilm-associated tolerance must not automatically be called inherited resistance.
Capsules, biofilms and endospores are distinct structures.
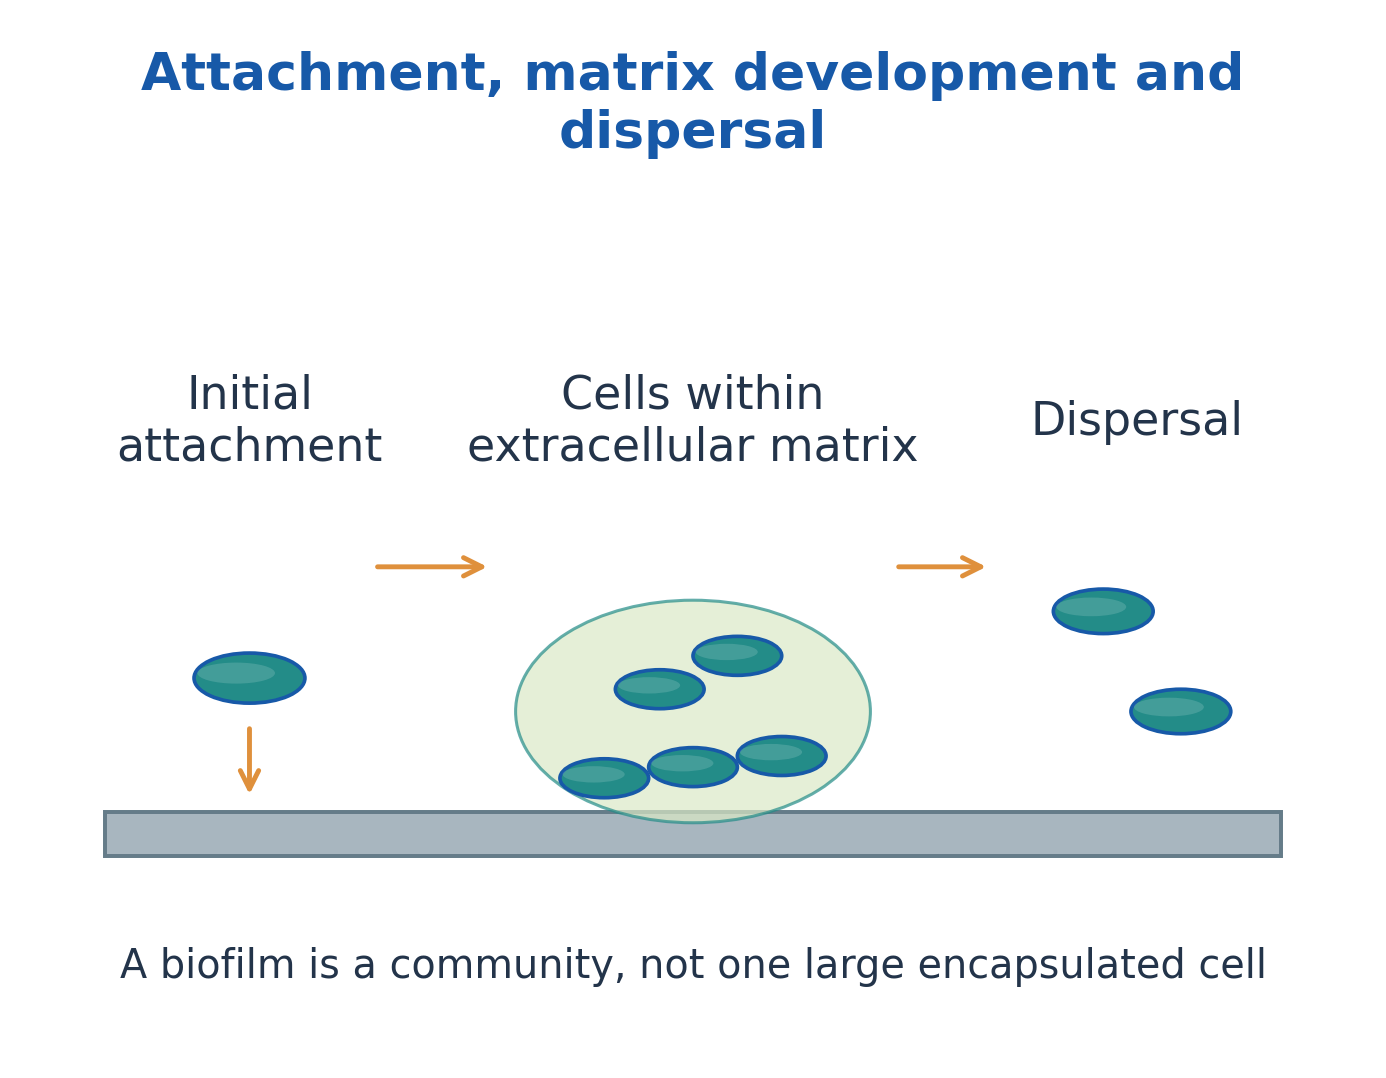
Figure explanation: The sequence is initial attachment, cells within an extracellular matrix, and dispersal. A biofilm is a community associated with a surface rather than one large encapsulated cell.
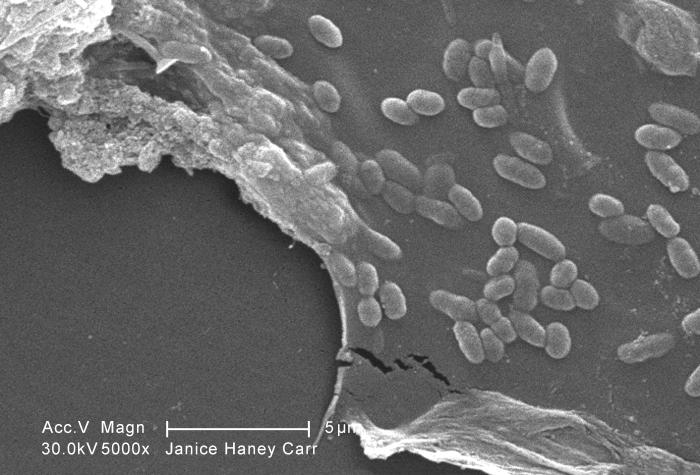
Figure explanation: The micrograph illustrates an actual mixed-community biofilm. Cells and associated material must be interpreted as a community rather than as evidence of one pure species.
5. Peptidoglycan and the Mechanical Role of the Wall
Peptidoglycan consists of alternating N-acetylglucosamine (NAG) and N-acetylmuramic acid (NAM) glycan units, with peptide side chains attached to NAM.
Peptide cross-links join strands into a mesh that supports shape and resists internal osmotic pressure.
The wall is not the main selectively permeable barrier; that role belongs to the cytoplasmic membrane.
Lysozyme can break a glycan bond, while some antibiotics inhibit wall synthesis, with effectiveness depending on access and physiology.
A protoplast has lost essentially the complete wall in the conventional Gram-positive model; a spheroplast retains some envelope material in the conventional Gram-negative model. Naturally wall-less bacteria are a separate case.
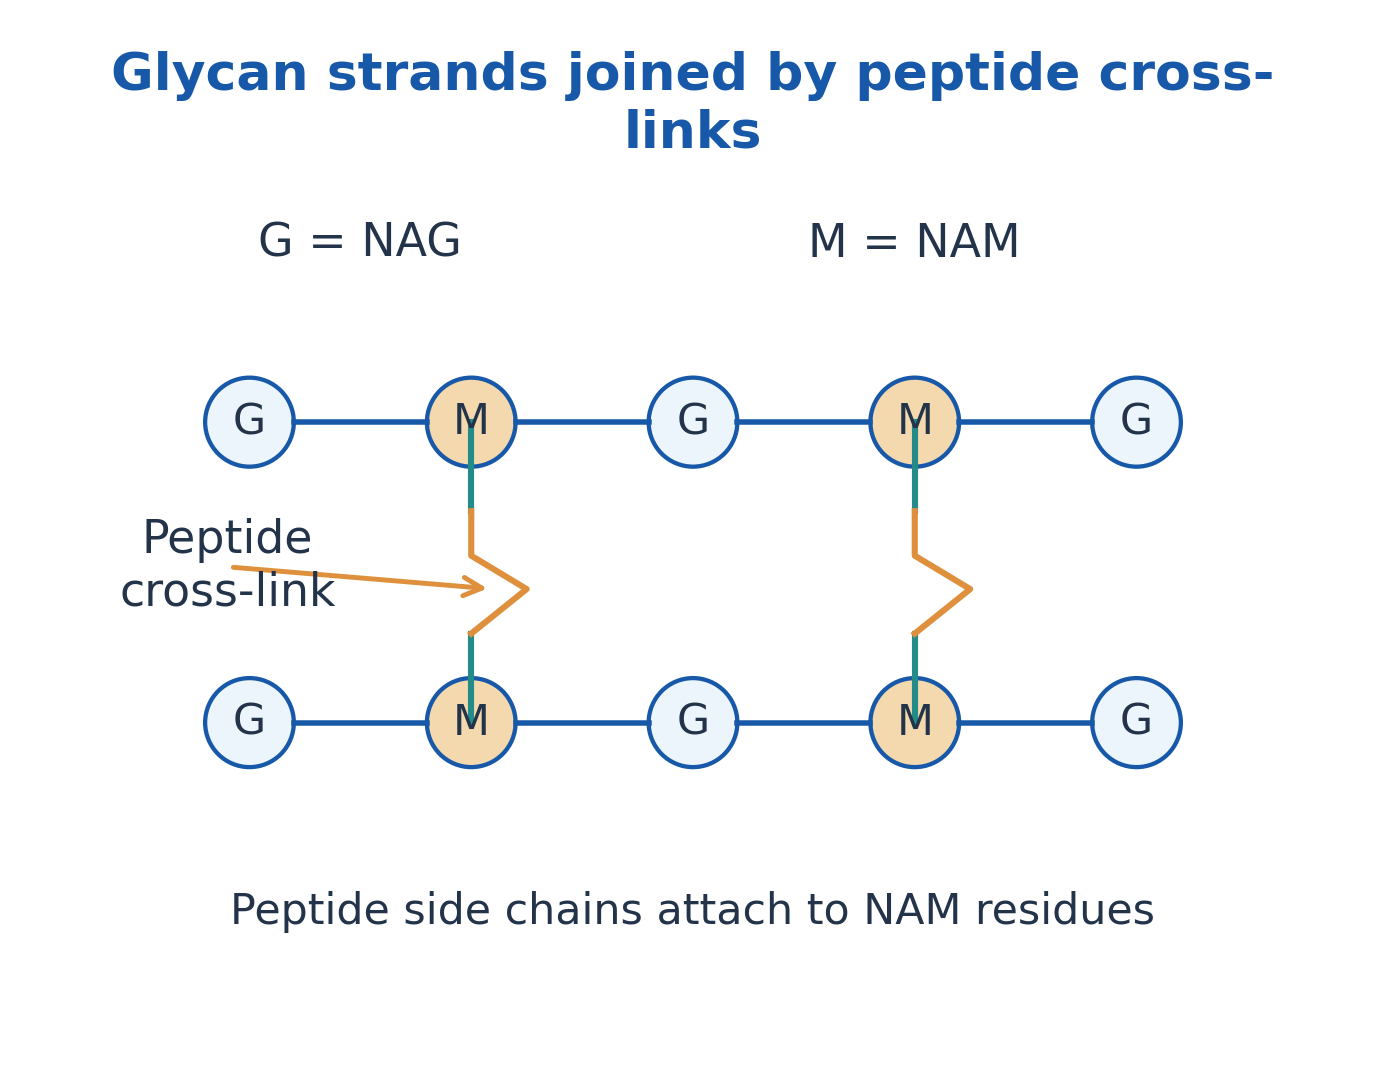
Figure explanation: The labelled glycan chains alternate G = NAG and M = NAM. Peptide side chains attach to NAM residues; peptide cross-links connect neighbouring strands. These links help the wall resist osmotic stress.
6. Gram-Positive and Gram-Negative Envelopes
A typical Gram-positive envelope has a cytoplasmic membrane and thick peptidoglycan. Teichoic acids occur in many walls; lipoteichoic acids are membrane-anchored.
A typical Gram-negative envelope has an inner membrane, periplasm containing thin peptidoglycan, and an outer membrane.
Lipopolysaccharide (LPS) occurs in many Gram-negative outer membranes:
- Lipid A: Anchors LPS and has endotoxin activity.
- Core: Extends outward from lipid A.
- O-antigen: Forms an outward-extending component.
Porins permit selected small hydrophilic molecules. The outer membrane is an additional permeability barrier, not a guarantee of resistance to every chemical.
Draw outside to inside: outer membrane → thin wall/periplasm → inner membrane.
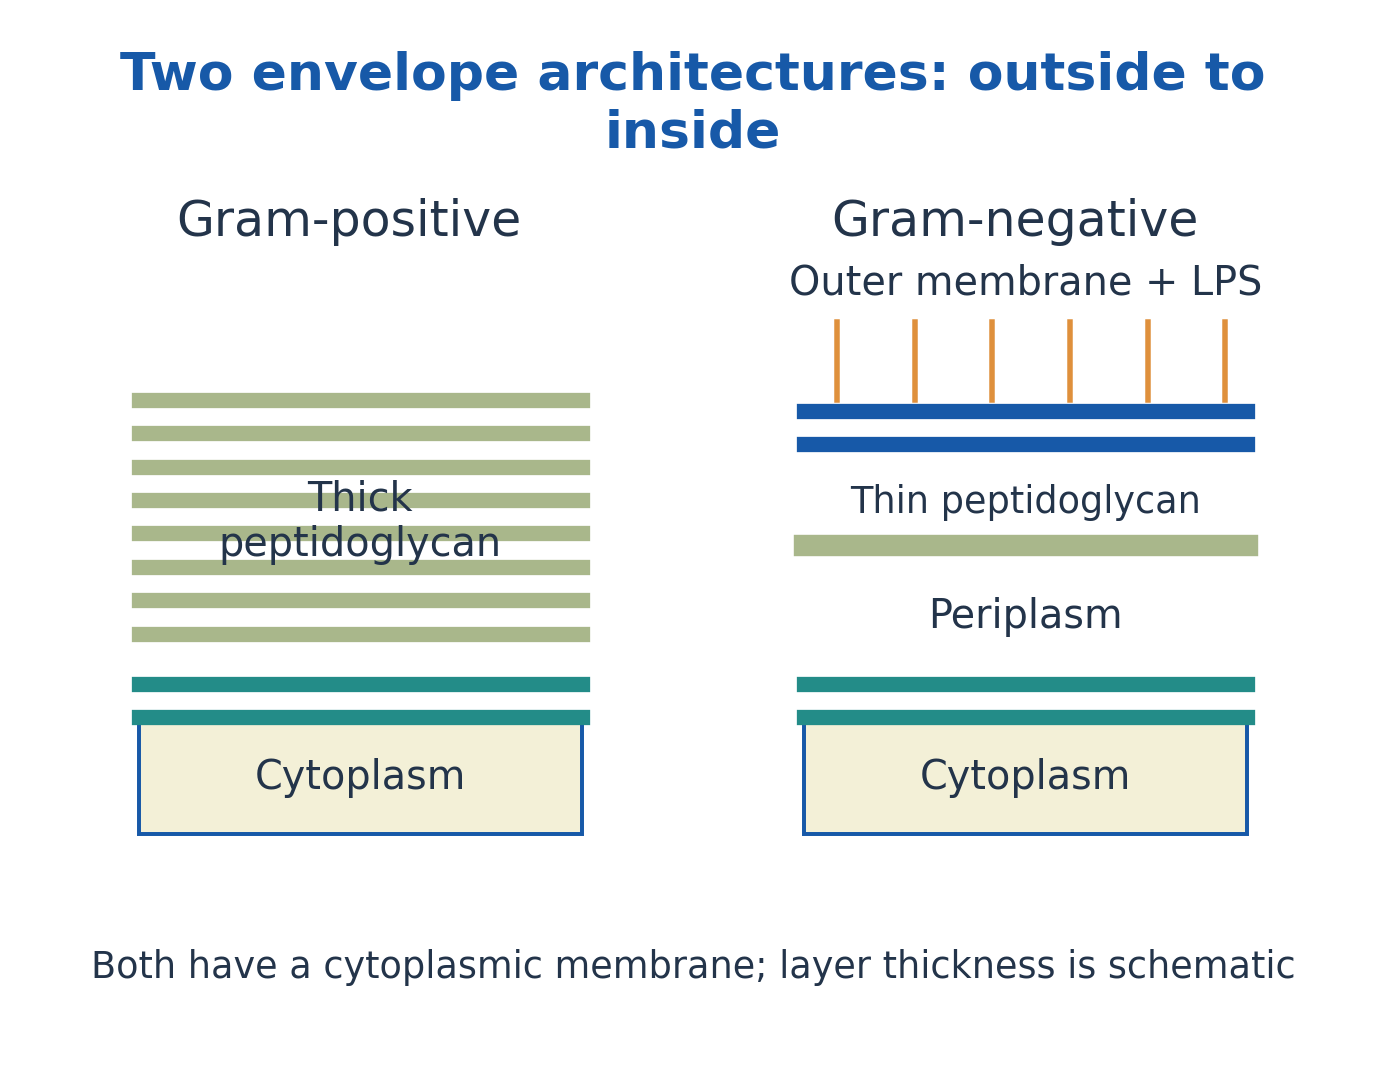
Figure explanation: The Gram-positive model places thick peptidoglycan outside the cytoplasmic membrane. The Gram-negative model places thin peptidoglycan in the periplasm between the cytoplasmic and outer membranes, with LPS at the outer membrane. Layer thicknesses are schematic.
| Feature | Gram-Positive | Gram-Negative |
|---|---|---|
| Peptidoglycan | Usually thick | Usually thin |
| Outer membrane | Absent in typical model | Present in typical model |
| Teichoic acids | Common in many species | Not a typical feature |
| LPS | Absent in typical model | Present in outer membrane |
| Gram-stain appearance | Usually purple | Usually pink/red |
7. Membrane, Cytoplasm and Bacterial Energy Organisation
The cytoplasmic membrane is a protein-containing phospholipid bilayer. It regulates exchange:
- Diffusion: Follows a gradient.
- Facilitated diffusion: Uses transport proteins.
- Active transport: Requires an energy source.
Selective permeability does not mean that nothing crosses.
Membrane-associated electron transport can establish ion gradients used by ATP synthase. Bacteria therefore do not require mitochondria for respiratory energy conservation.
Cytoplasm contains water, ions, enzymes and organised cellular components; some bacteria have specialised internal membranes or protein compartments.
Correction to older drawings: Mesosomes are generally preparation-associated membrane artefacts, not universal respiratory or division organelles.
Detailed electron transport belongs to Unit II.
8. Nucleoid, Plasmids, Ribosomes and Inclusions
The nucleoid contains the chromosome and associated proteins. Many bacteria have one circular chromosome, but linear or multiple chromosomes occur.
Plasmids are independently maintained genetic elements, commonly circular DNA, present in some cells; they are not miniature nuclei or universally essential structures.
Cytoplasmic 70S ribosomes contain 50S and 30S subunits and translate mRNA. Svedberg values describe sedimentation behaviour, so 50S + 30S is not ordinary arithmetic.
Inclusions can store carbon, phosphate or sulfur; polyhydroxyalkanoate and polyphosphate granules are examples.
Bacteria lack conventional eukaryotic ER and Golgi apparatus, but their cytoplasm is organised.
9. Flagella, Fimbriae, Pili and Motility
A flagellum has a filament, hook and basal apparatus; rotation commonly uses an ion motive force.
Flagellar arrangements include:
- Monotrichous: One polar flagellum.
- Lophotrichous: A polar tuft.
- Amphitrichous: Flagella at both ends.
- Peritrichous: Flagella distributed around the surface.
Fimbriae commonly promote adhesion. Pili can support attachment, motility or DNA transfer depending on type; not every filament is conjugative.
Chemotaxis biases movement in a chemical gradient without conscious direction. Brownian jitter and passive drift do not prove active motility.
Spirochetes use specialised periplasmic flagella, unlike the simple external-flagellum rod model.

Figure explanation: The four rod-shaped examples are monotrichous, lophotrichous, amphitrichous and peritrichous. Identify whether flagella occur singly at a pole, as a polar tuft, at both poles, or around the cell surface.
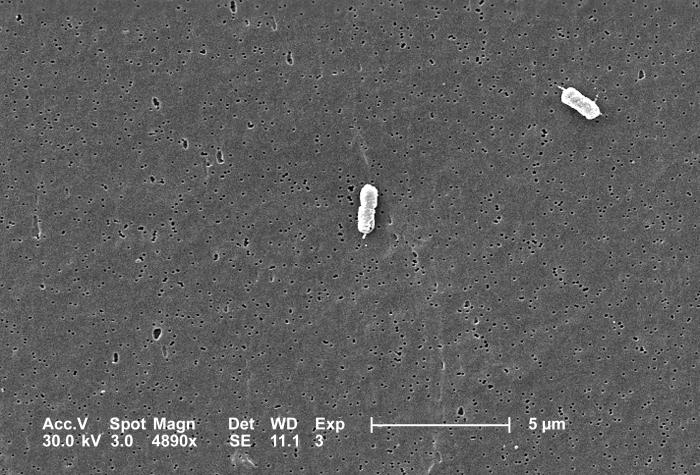
Figure explanation: Visible filaments around actual E. coli cells illustrate flagella. The micrograph complements the arrangement sketches; it does not establish that every E. coli strain has the same motility phenotype.
10. Endospores: Structure, Formation and Survival
An endospore is a dormant survival structure formed by certain bacteria under unfavourable conditions.
One vegetative cell usually forms one spore; germination and outgrowth restore one vegetative cell before further multiplication. Sporulation therefore does not itself increase cell numbers.
Formation includes asymmetric division, forespore engulfment, protective-layer development, maturation and release.
Resistance involves a dehydrated core, calcium-dipicolinate, small acid-soluble spore proteins and protective layers.
Germination reverses dormancy-associated properties; triggers depend on organism and conditions. Endospores can survive treatments that remove vegetative cells, but resistance is not absolute. Spore position aids description, not definitive species identification.
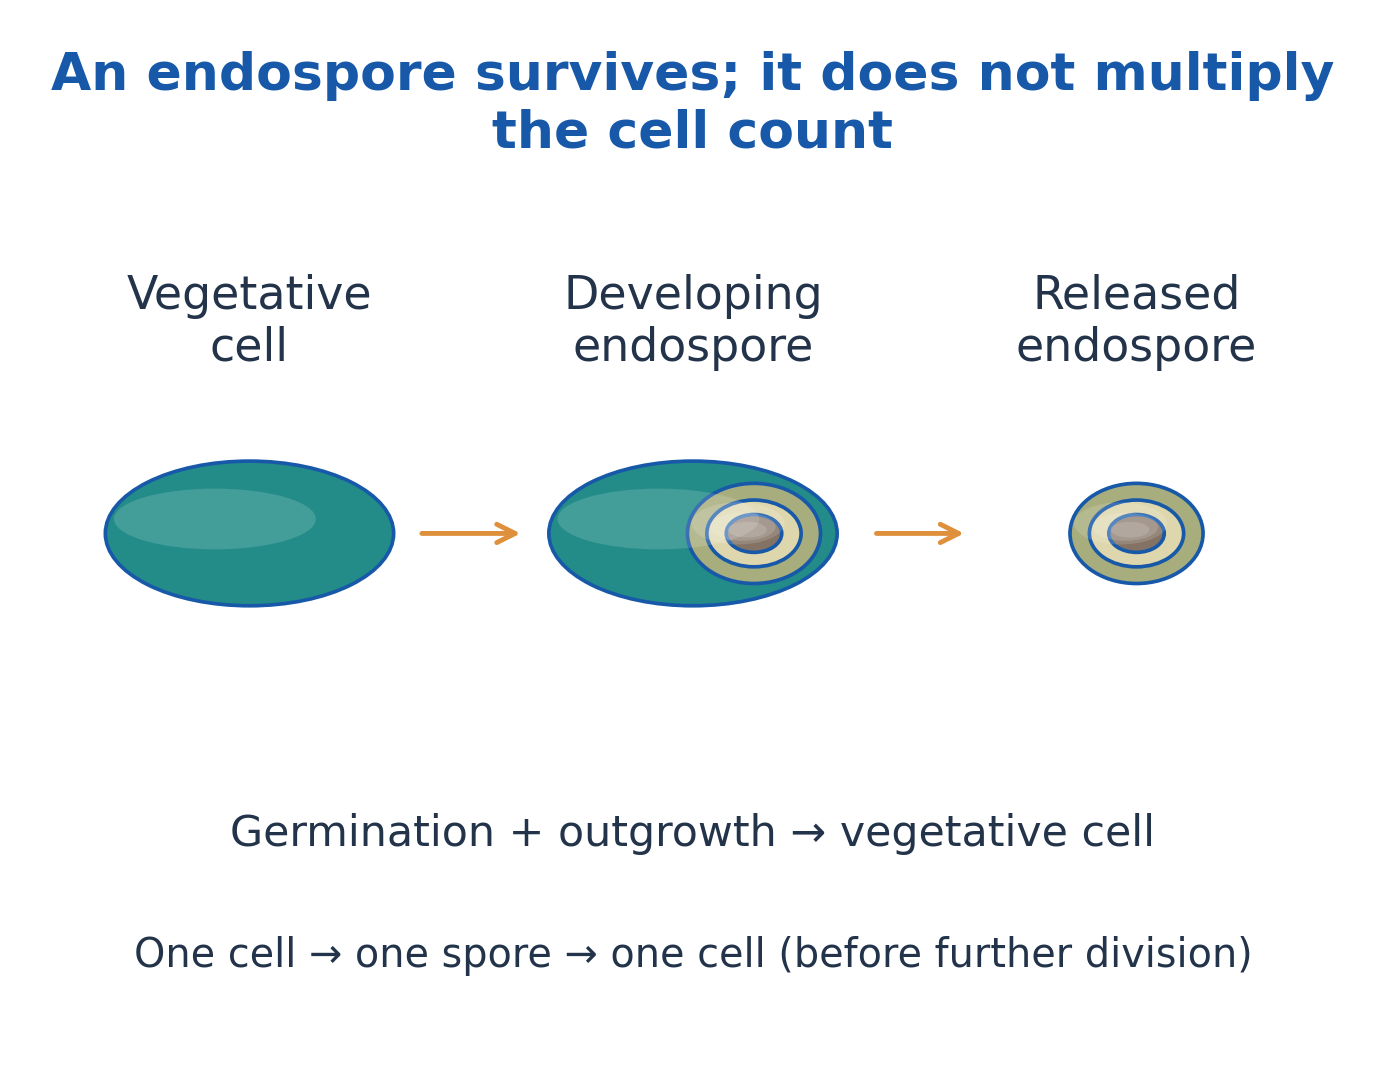
Figure explanation: Follow vegetative cell → developing endospore → released endospore. Germination and outgrowth return the spore to a vegetative cell. One cell → one spore → one cell occurs before further division; the spore survives rather than multiplying the count.
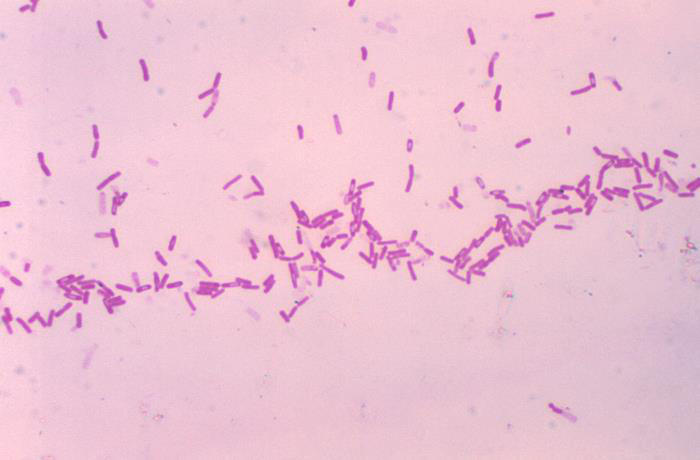
Figure explanation: The Gram-stained micrograph shows Bacillus cells with spore forms. Interpret spore appearance together with the cell background and staining method; morphology alone does not provide definitive species identification.
11. Classification, Taxonomy and Bacterial Nomenclature
Classification organises organisms into groups; nomenclature assigns accepted names; identification places an unknown within an existing framework.
The usual hierarchy is domain, phylum, class, order, family, genus and species. A strain is a distinguishable lineage within a species.
A binomial has a capitalised genus and lower-case species epithet, ideally italicised; abbreviate the genus only after introducing it.
Bacteria and Archaea are separate domains despite both being prokaryotic. Bergey’s manuals support bacterial description and systematics.
An identification key and a phylogenetic tree answer different questions, and names can change as evidence improves.
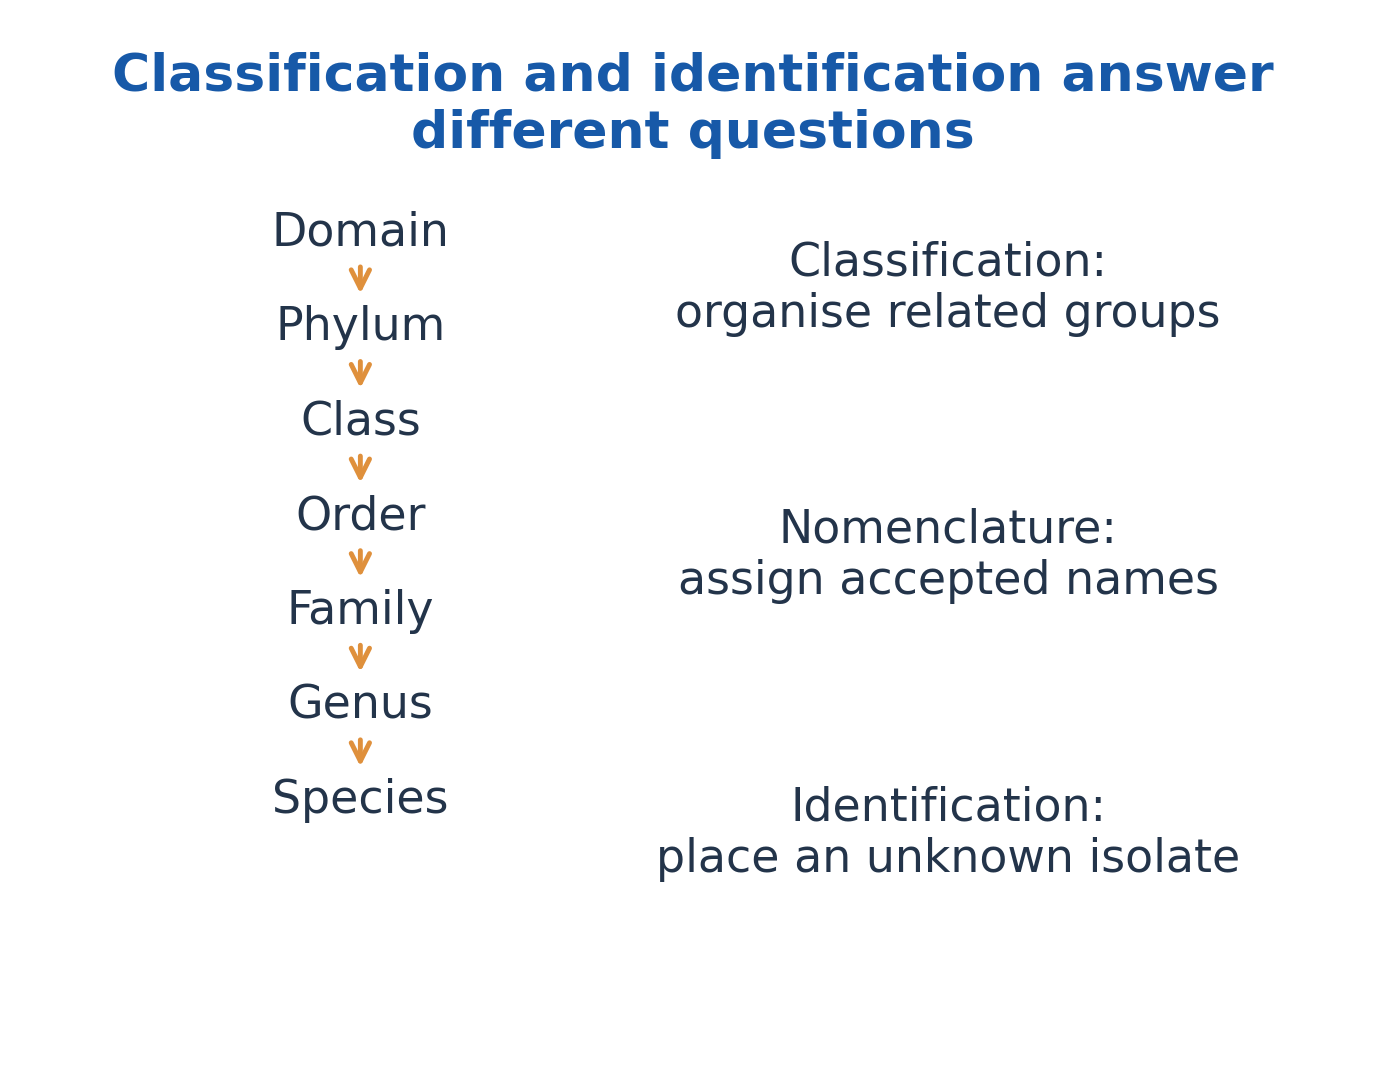
Figure explanation: The hierarchy runs domain → phylum → class → order → family → genus → species. Classification organises related groups, nomenclature assigns accepted names, and identification places an unknown isolate within the framework.
12. Major Bacterial Groups and Traditional Classification Schemes
Descriptive groups include Gram-positive cocci or rods, Gram-negative rods, spiral forms, filamentous organisms and wall-less bacteria. Such groups are useful but are not all equivalent modern taxonomic ranks.
Actinomycete-like forms show branching growth; cyanobacteria perform oxygenic photosynthesis; spirochetes have periplasmic flagella; Mycoplasma-like forms lack conventional peptidoglycan.
An obligately intracellular bacterium is still a cell, not a virus.
Older wall-based schemes used Gracilicutes, Firmicutes, Tenericutes and Mendosicutes. Recognise these as historical categories rather than a complete modern evolutionary tree; Archaea must not simply be folded into Bacteria. State the basis and limitations of the scheme used.

Figure explanation: The SEM illustrates curved rods. A curved shape is a descriptive clue and must be combined with other evidence when identifying an unknown isolate.
| Descriptive Group | Useful Feature | What It Does Not Establish |
|---|---|---|
| Gram-positive/negative | Typical staining and envelope relationship | A unique species or universal susceptibility |
| Endospore-forming rods | Differentiated survival structure | Reproductive multiplication by spores |
| Filamentous/branching forms | Distinctive cellular organisation | Membership in fungi |
| Cyanobacteria | Oxygenic photosynthesis | A eukaryotic algal nucleus |
| Wall-less bacteria | Absence of conventional peptidoglycan | Absence of a cytoplasmic membrane |
13. Phenotypic and Molecular Bases of Classification
Phenotypic classification uses morphology, staining, motility, spores, nutrition, oxygen relationships and biochemical activity.
Nutritional terms distinguish separate axes:
- Photo-/chemo-: Identify light or chemical energy.
- Auto-/hetero-: Identify mainly inorganic or organic carbon.
- Litho-/organo-: Identify inorganic or organic electron donors.
Molecular approaches compare sequences or genomes. The 16S rRNA gene is a useful marker but may not resolve close species or strains; whole-genome evidence can add resolution.
Polyphasic classification combines complementary evidence. Sample purity, database quality, culture conditions and method resolution affect conclusions; one trait or one unqualified sequence match is not a complete identification.
| Basis | What It Describes | Main Limitation |
|---|---|---|
| Morphology | Shape and arrangement | Many taxa look similar |
| Staining | Envelope-associated reaction | Technique and culture state matter |
| Physiology | Nutrition and metabolic traits | Conditions affect expression |
| 16S sequence | Relatedness to reference sequences | Some close species remain unresolved |
| Genome comparison | Broader genomic similarity | Requires appropriate data and analysis |
14. Microscopy, Staining and Descriptive Identification
Magnification enlarges an image; resolution separates nearby points.
Simple stains improve visibility; differential stains distinguish groups; structural stains highlight features such as spores or capsules. Preparation can alter appearance.
Gram staining uses:
- Crystal violet: Primary stain.
- Iodine: Mordant.
- Suitable alcohol/acetone-alcohol: Decoloriser.
- Commonly safranin: Counterstain.
Typical Gram-positive cells retain the primary complex and appear purple; typical Gram-negative cells are decolorised and counterstain pink.
Over-/under-decolorisation, thick smears and damaged cells can mislead. Acid-fast staining instead detects properties associated with a mycolic-acid-rich envelope.
Mixed colours may reflect contamination, Gram variability or technique; confirm with appropriate controls and further evidence.
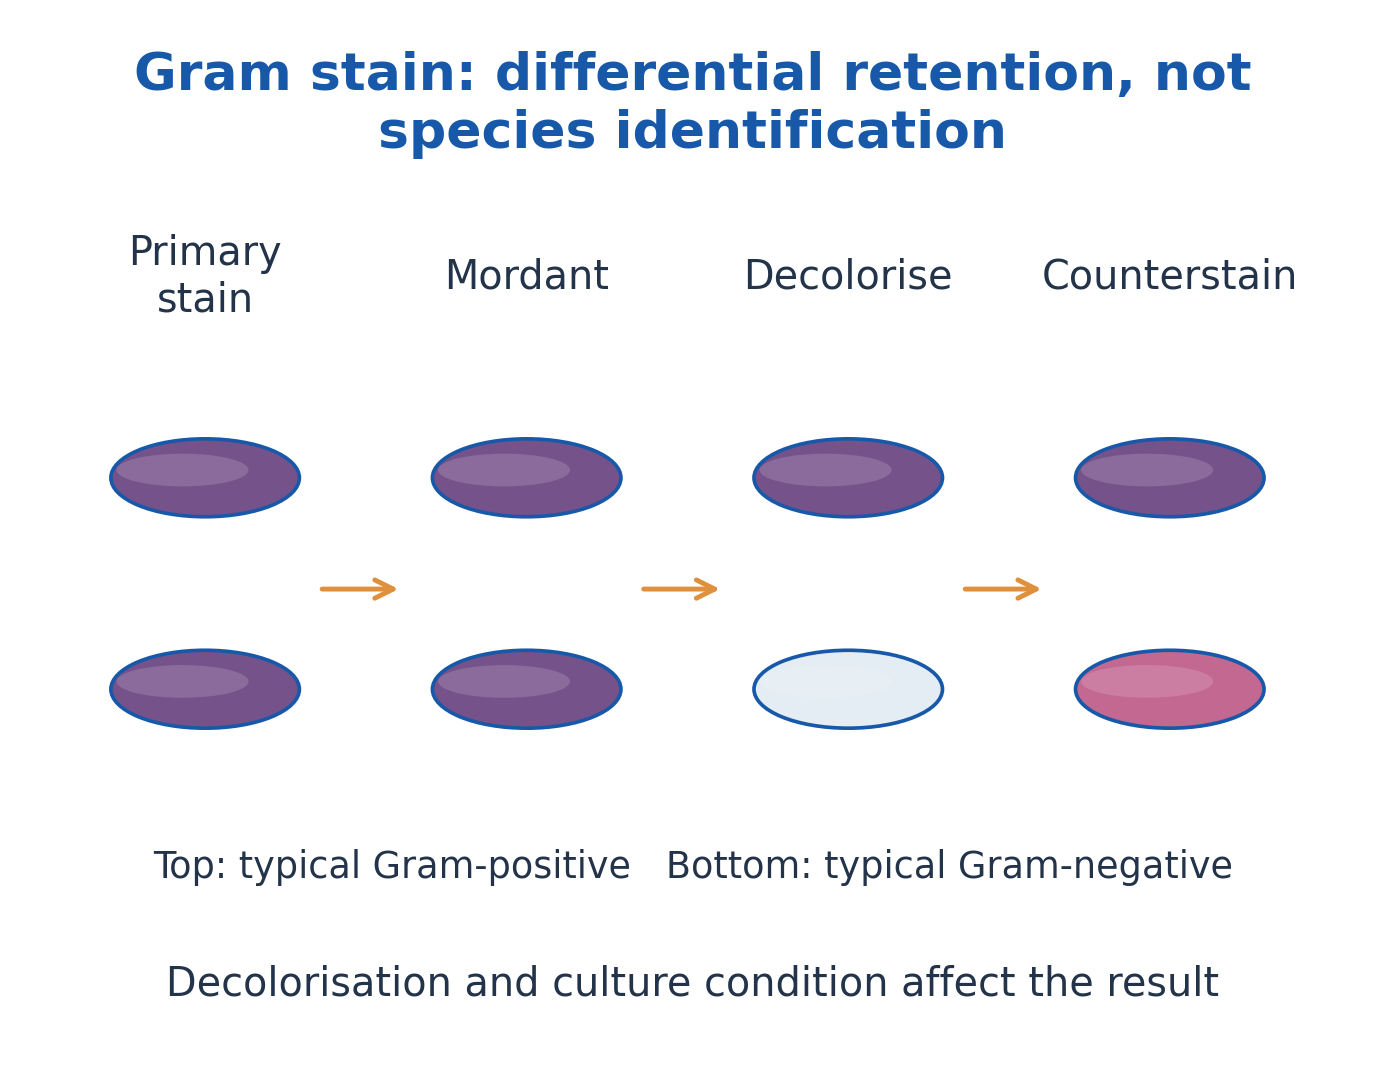
Figure explanation: Follow primary stain → mordant → decoloriser → counterstain. The typical Gram-positive row retains purple colour; the typical Gram-negative row loses the primary colour and then appears pink. Decolorisation and culture condition affect the result.
15. Culture Media: Nutritional and Physical Requirements
A medium supplies water, suitable carbon, nitrogen, minerals, energy/electron sources and any needed growth factors.
A growth factor is an organic compound an organism cannot make sufficiently under the specified conditions. Suitable pH, osmotic conditions and atmosphere also matter.
Broth is liquid; agar commonly provides a solid surface; semisolid medium has lower gel strength. Agar is a useful gelling agent, not necessarily the principal nutrient.
Buffers limit pH change, while indicators reveal selected reactions. Choose media by purpose: biomass production, isolation, differentiation, transport or maintenance. No single medium grows every microorganism.
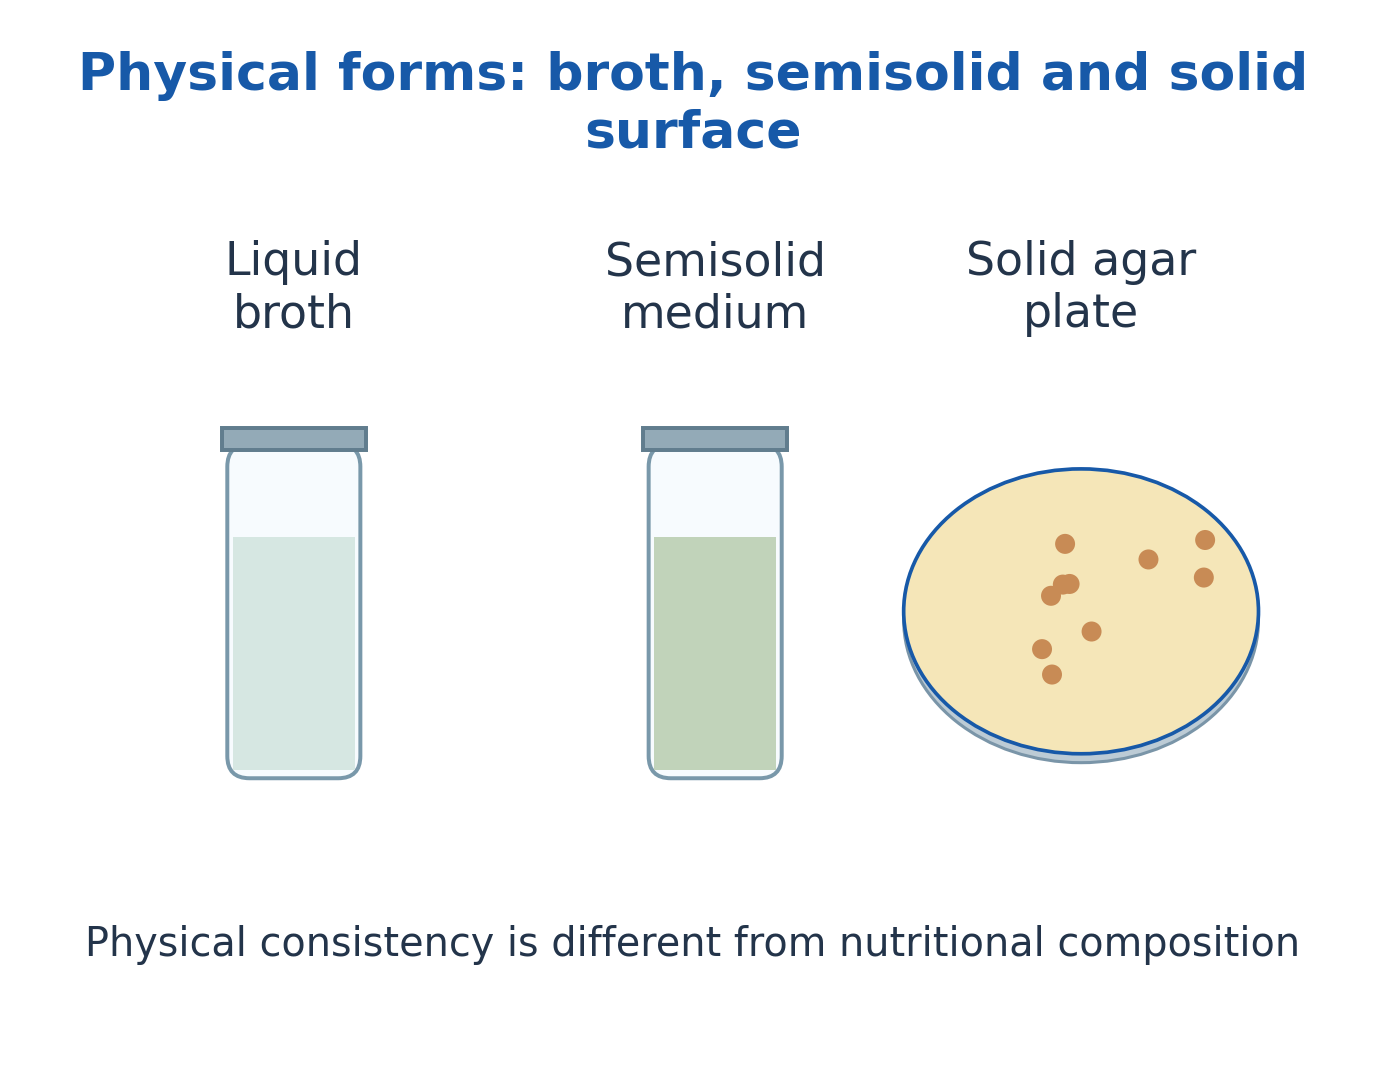
Figure explanation: The three physical forms are liquid broth, semisolid medium and a solid agar plate surface. Physical consistency is different from nutritional composition: a solid medium is not automatically enriched, selective or differential.
16. Defined, Complex, General-Purpose and Enriched Media
A defined medium has specified chemical constituents and amounts. A complex medium contains ingredients such as peptones or extracts with incompletely specified molecular composition.
General-purpose media support many nonfastidious organisms; enriched media add growth-supporting components for demanding organisms.
Blood agar is enriched and can also reveal haemolysis, making it differential. Chocolate agar contains heated blood-derived material, not chocolate.
Enriched ≠ enrichment: An enriched medium supplies nutrients; enrichment culture favours a desired group in a mixture. Richness alone does not establish selectivity, and enrichment alone does not establish purity.
| Type | Defining Feature | Typical Use |
|---|---|---|
| Defined | Known chemical composition | Nutrition and physiological studies |
| Complex | Peptones/extracts with variable components | Routine growth of suitable organisms |
| General-purpose | Supports a broad nonfastidious range | Routine cultivation |
| Enriched | Additional demanding nutrients | Support of fastidious organisms |
| Enrichment culture | Conditions favour a target group | Increase target representation in a mixture |
17. Selective, Differential, Transport and Reducing Media
Selective media inhibit some organisms while allowing others; differential media reveal a biological difference among growing organisms.
MacConkey agar combines inhibitory components with lactose-associated indicator reactions. These functions overlap but are distinct, and the observed response remains presumptive.
Transport media maintain viability while limiting major population changes before examination. Reducing media and suitable atmospheres support oxygen-sensitive organisms.
An oxygen indicator reports a redox-related change, not complete proof of anaerobic suitability.
Interpretation: Colour change shows a differential response, not necessarily selection; one visible colony type does not by itself prove purity.
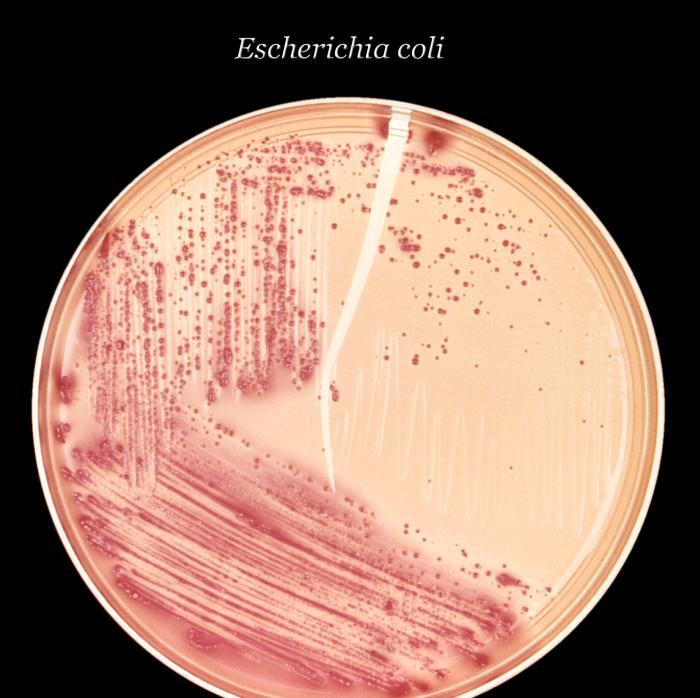
Figure explanation: The actual MacConkey culture photograph illustrates growth and colony appearance on a selective/differential medium. Interpret the appearance as a medium-associated response rather than as a complete identification by itself.
18. Pure Culture Isolation and the Logic of Separation
Isolation separates microbial units from a mixture so that distinguishable colonies or populations can be examined. Identification determines what the isolate is.
A conceptual sequence is sampling → separation → colony observation → isolated-colony selection → re-isolation → purity and identity checks.
A colony can arise from a single cell, pair, chain or clump; it is not proof of one original cell.
Purity is supported by colony consistency, microscopy and suitable discriminating tests. Different species may look similar and one species can show variant colonies.
Actual culture conditions depend on the organism and approved procedures; separation is not sterilisation of the original sample.
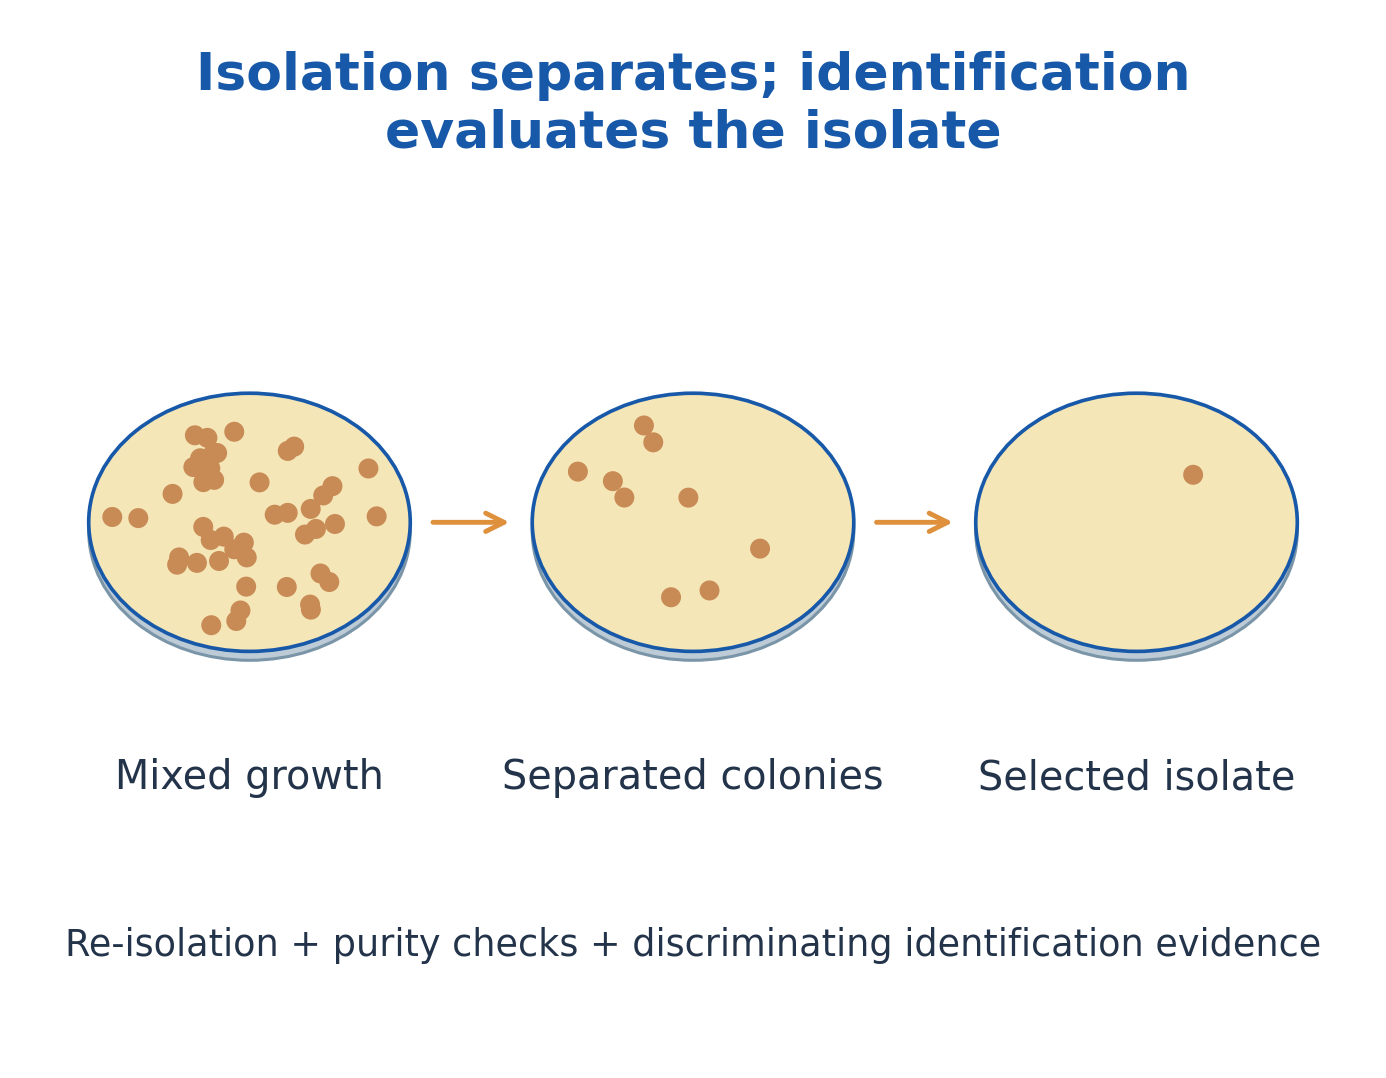
Figure explanation: The illustrated sequence moves from mixed growth to separated colonies and then a selected isolate. Re-isolation, purity checks and discriminating identification evidence complete the interpretation; separation and identification answer different questions.
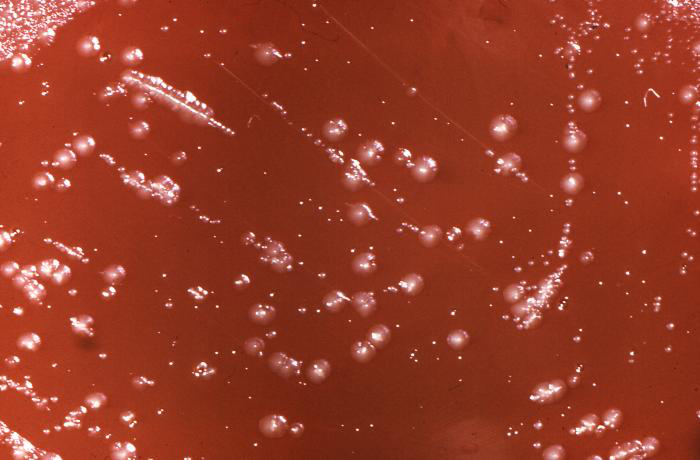
Figure explanation: Different colony appearances are visible within one culture dish. Record the differences before inferring identity, and remember that appearance can vary with growth conditions.
19. Streak Plate: Progressive Separation Across a Surface
Streak plating progressively distributes microbial units across a solid surface, reducing local deposit density until separated colonies develop. This is spatial separation, not liquid dilution.
A dense initial region is followed by increasingly sparse growth in later sectors.
Aseptic handling and suitable tool use prevent contamination and unintended redistribution. Exact sector geometry is less important than progressive density reduction.
Confluent growth may indicate inadequate separation, excessive starting density or redistribution.
Isolated colonies support purity assessment, but ordinary streaking does not provide the original CFU/mL because the represented sample amount is not defined quantitatively.
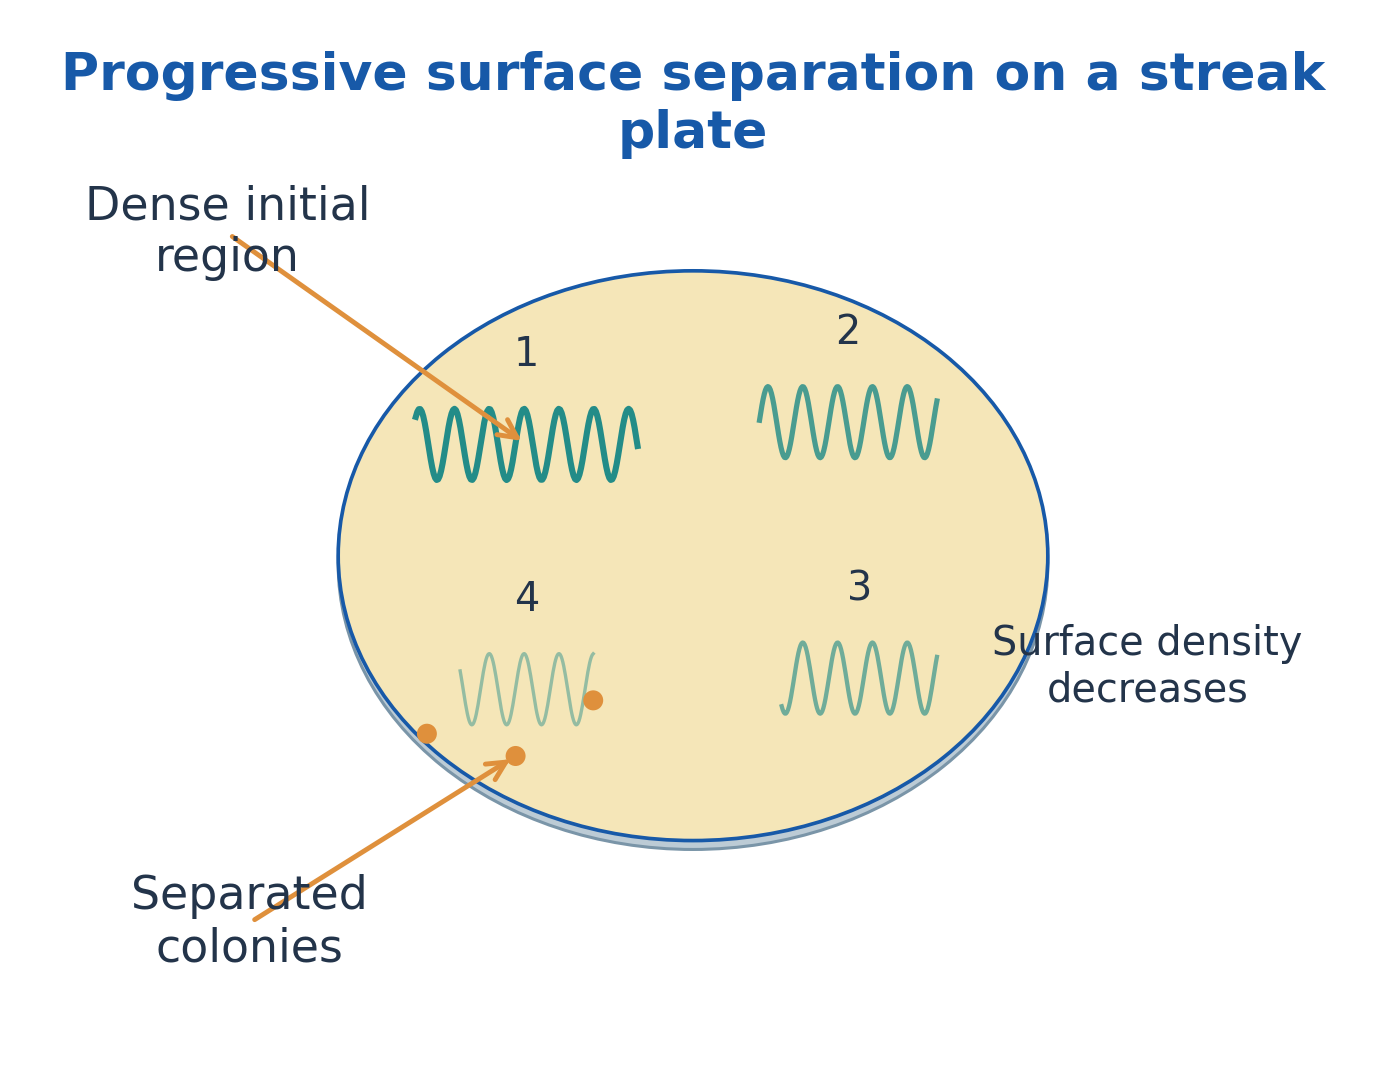
Figure explanation: The numbered sectors show progressive surface separation. The initial region is dense; later regions have lower local density and may yield separated colonies. The principle is reduced surface deposition, not a measured series of liquid dilutions.
20. Spread Plate, Pour Plate and Dilution-to-Separation
A spread plate distributes a measured suspension volume across solid agar, producing mainly surface colonies.
A pour plate mixes a measured volume with suitable molten medium before solidification, producing surface and subsurface colonies. Oxygen exposure, colony appearance and thermal stress can differ.
Serial dilution reduces concentration by a known cumulative factor. Dilution alone neither establishes purity nor turns a mixture into a pure culture.
When the represented volume and dilution are known, accepted colony counts can estimate CFU; otherwise separated growth is qualitative. Always correct for plated volume and define the method’s counting criteria.
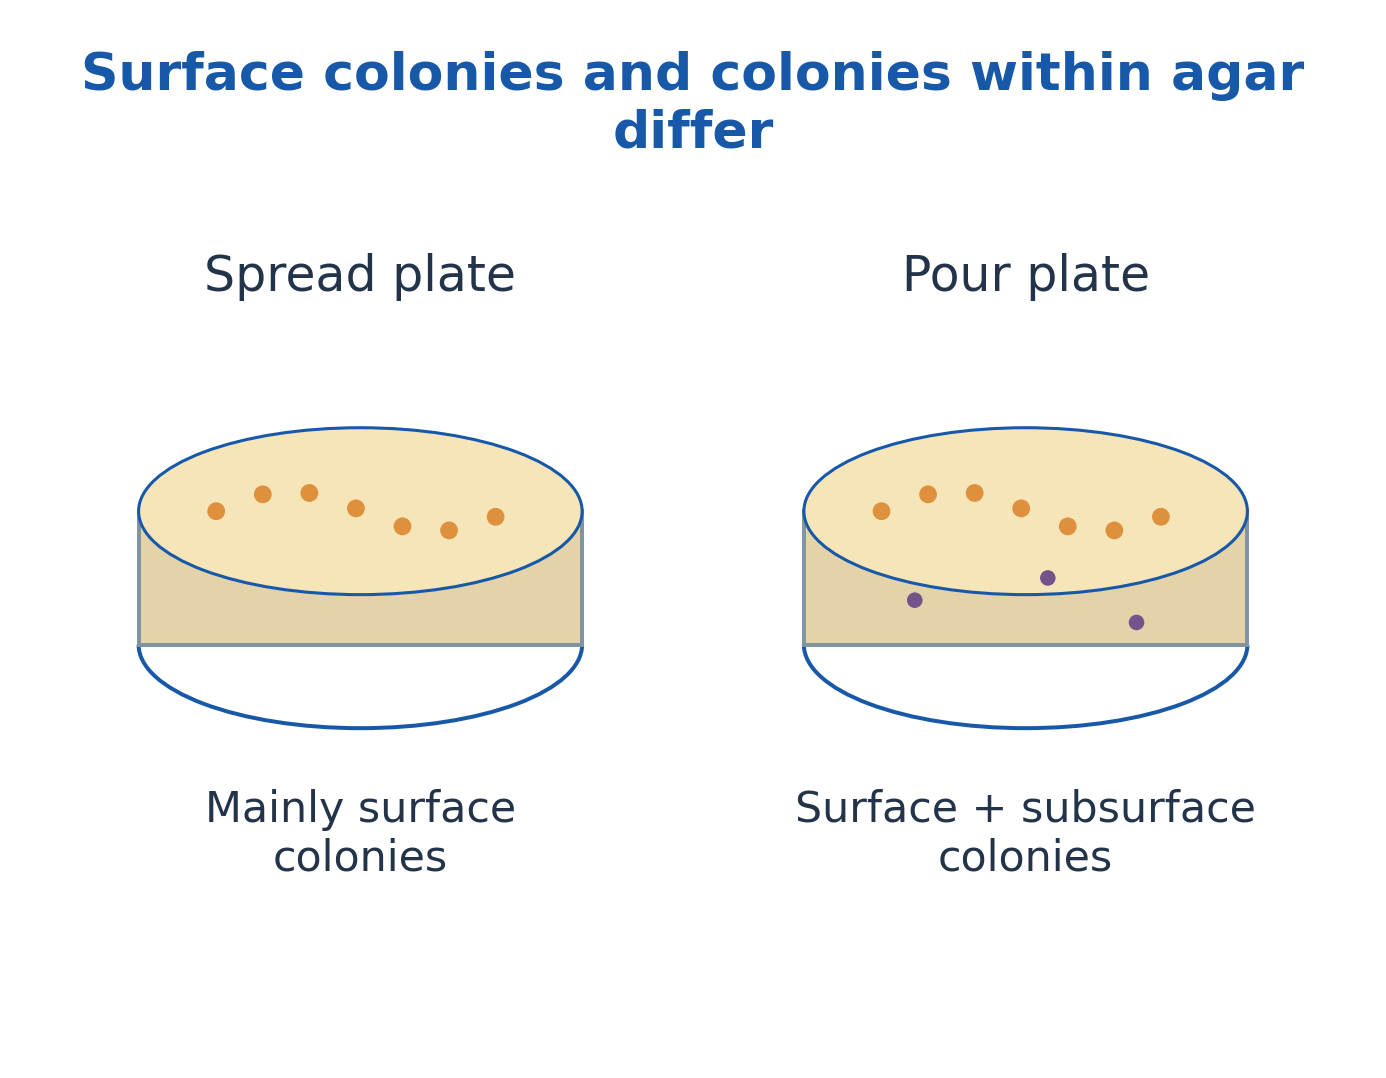
Figure explanation: In the spread-plate sketch, colonies are mainly on the surface. In the pour-plate sketch, colonies can occur at the surface and within agar. Their positions reflect the method and influence oxygen exposure and appearance.
21. Enrichment, Specialised Culture and Culture Conditions
Enrichment favours a desired physiological group by conditions such as a particular nutrient, electron acceptor or environment. It increases relative representation but does not guarantee purity or exclude every competitor.
Broth supports bulk growth; slants support maintenance; surface, submerged, static and agitated cultures provide different physical conditions.
Oxygen relationships include obligate aerobes, obligate anaerobes, facultative anaerobes, aerotolerant anaerobes and microaerophiles.
The illustrated tube patterns reflect oxygen availability and physiology. Temperature, pH, nutrients, diffusion and mixing influence growth. Use validated laboratory methods rather than assuming one universal incubation condition for all bacteria.
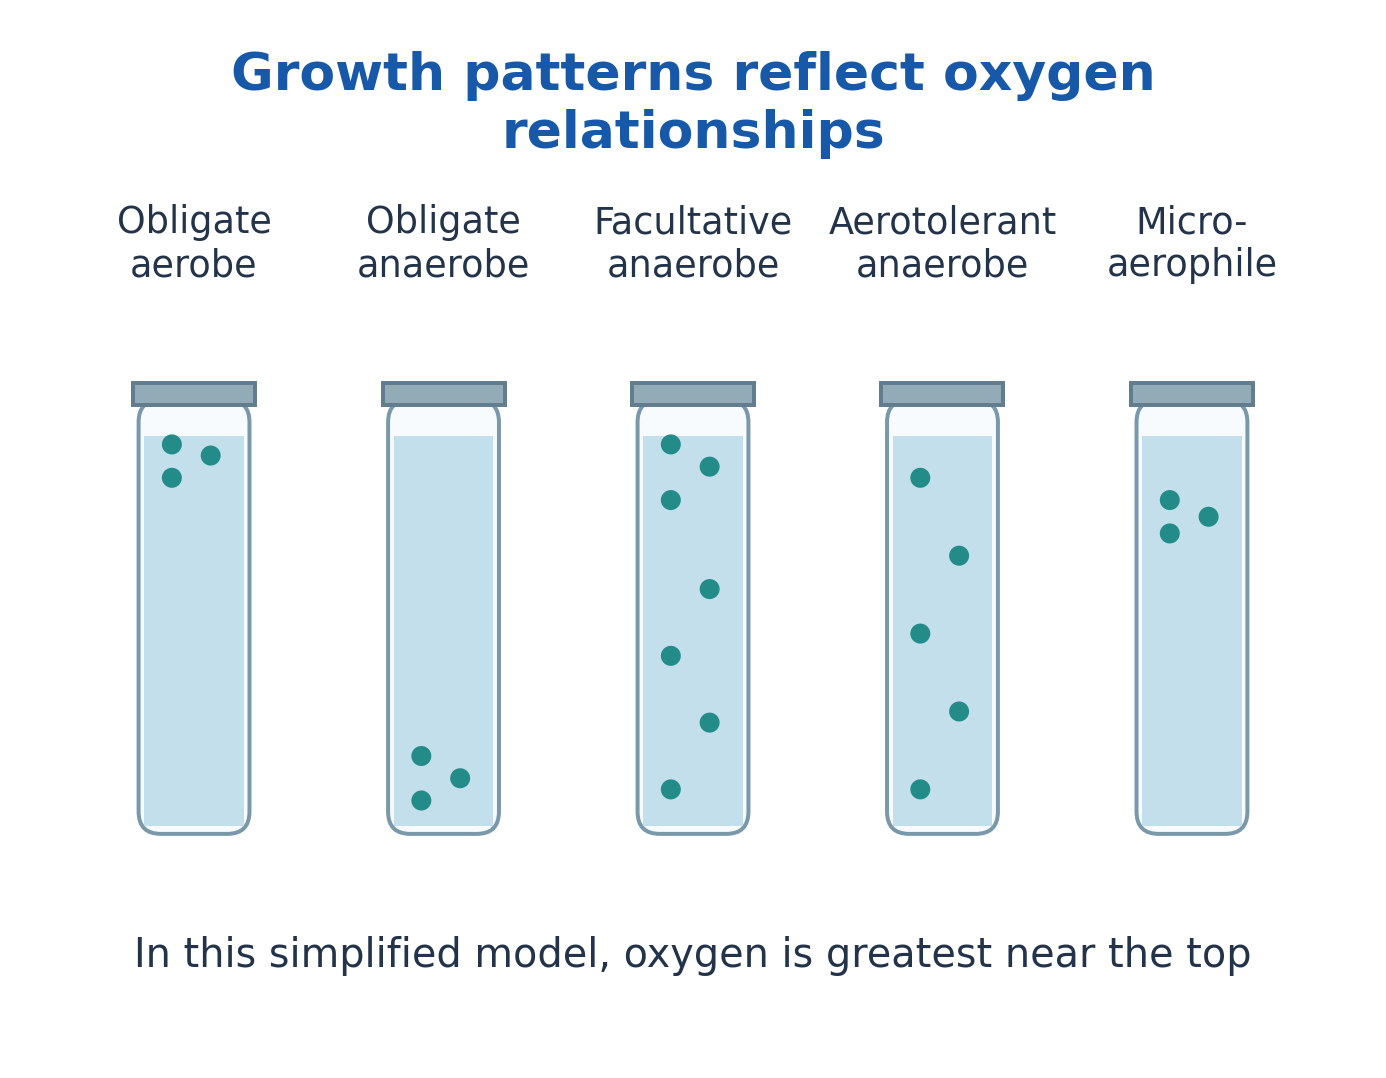
Figure explanation: The labelled patterns compare obligate aerobe, obligate anaerobe, facultative anaerobe, aerotolerant anaerobe and microaerophile. In this simplified tube model oxygen is greatest near the top: growth at the top, bottom, throughout or in a subsurface band reflects different oxygen relationships.
22. Colony Characteristics and a Structured Identification Pathway
Describe colonies by size, form, margin, elevation, pigmentation, surface, opacity and haemolysis where relevant.
These are condition-dependent observations, not permanent identity labels. A structured identification sequence combines colony description with microscopy, staining, biochemical/physiological tests and appropriate confirmation.
For example, catalase detects breakdown of hydrogen peroxide; an oxidase test examines a selected electron-transport-associated activity; substrate reactions reveal particular metabolic capabilities.
Products and conditions determine interpretation. A colony shape or one positive reaction is insufficient for species identification. The result should state the identity supported and any remaining uncertainty.
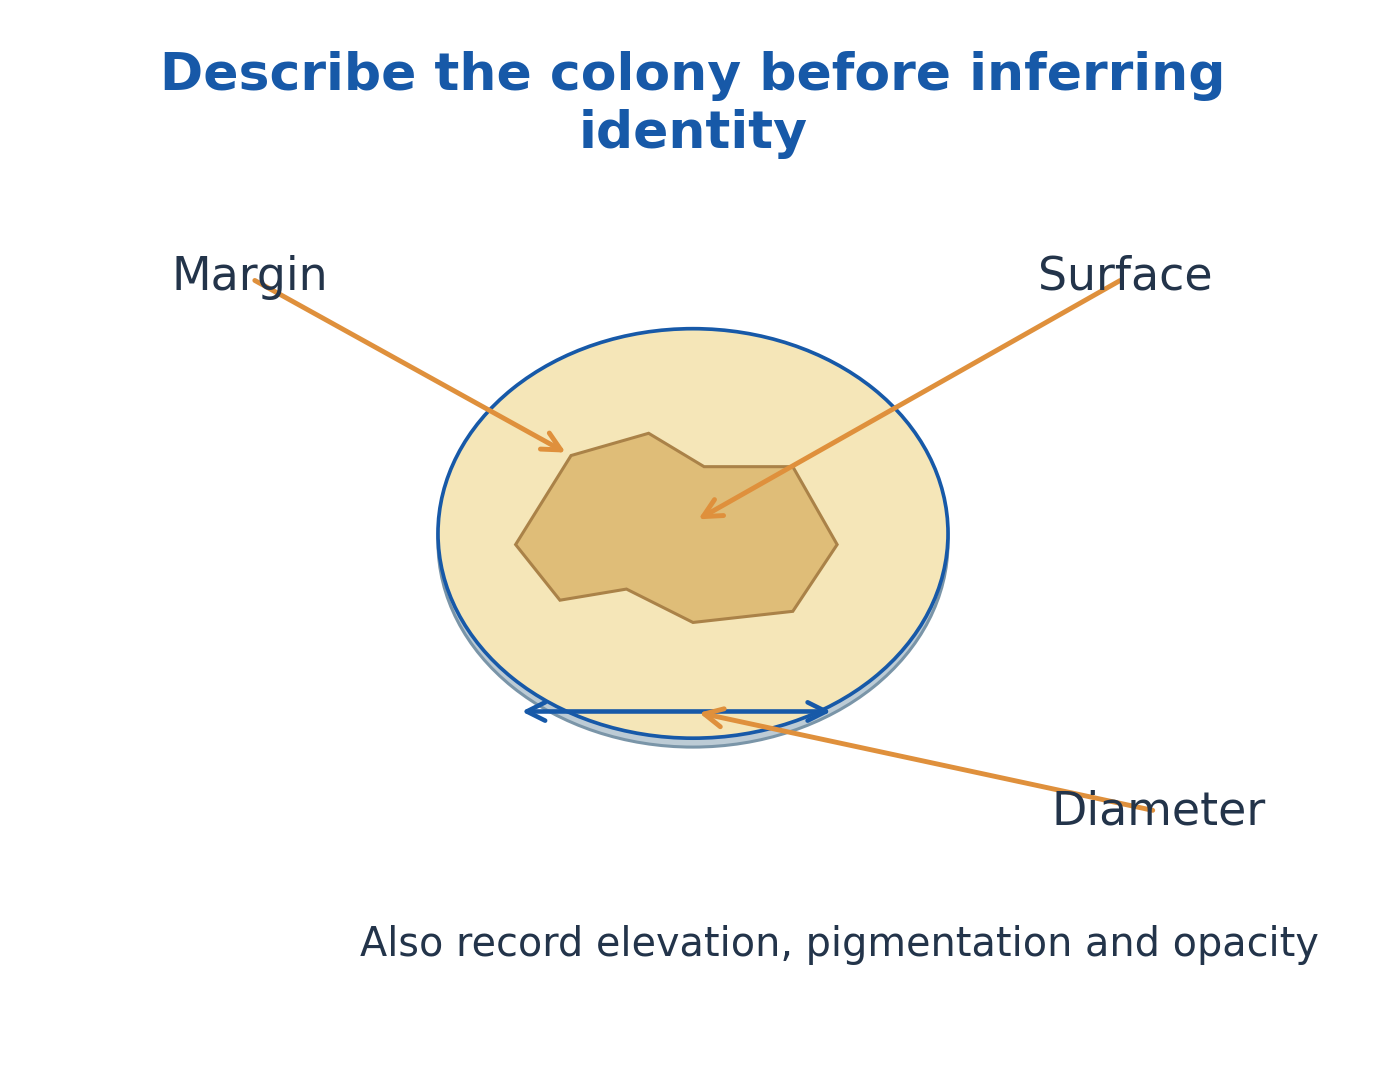
Figure explanation: Describe the colony before inferring identity. The drawing labels margin, surface and diameter, and also calls for elevation, pigmentation and opacity. Use these observations with the other identification evidence.
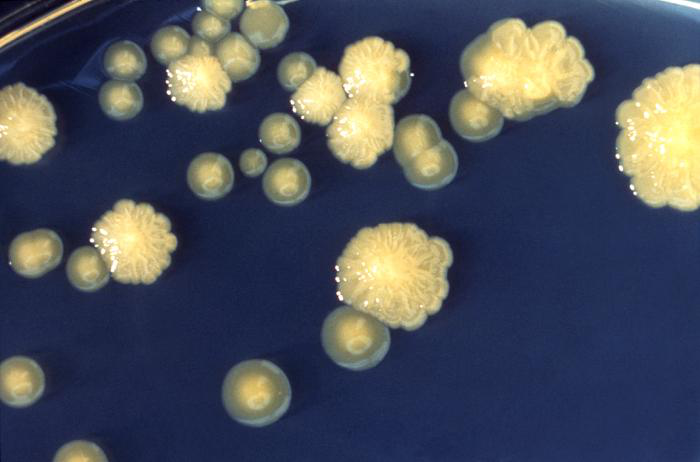
Figure explanation: The photograph compares rough and smooth Enterobacter colony appearances. Record the observed texture; a texture difference alone does not establish a complete taxonomic conclusion.
23. Molecular Identification, Authentication and Common Errors
PCR can detect a selected nucleic-acid target if primers, controls and interpretation are appropriate.
Sequencing compares recovered sequence with reference data; 16S rRNA analysis has resolution limits. MALDI-TOF compares protein-profile patterns with a validated reference library.
DNA detection does not automatically demonstrate living cells: residual DNA, contamination and persistent signal can complicate interpretation.
Failure to amplify can reflect inhibition or mismatch rather than true absence.
Authentication verifies that a maintained strain is the intended material. Identity, purity and viability require separate checks; do not identify solely from colony appearance or assume every molecular match resolves strains.
24. Preservation: Goals, Short-Term Maintenance and Stock Systems
Preservation retains viability, purity and important strain properties.
Short-term maintenance may use an appropriate medium and refrigeration, but repeated transfer risks contamination, selection, drift and mislabelling.
A master stock retains the reference; working stocks supply routine use and reduce repeated reference handling.
Keep strain identity, passage and storage records, then check recovery and contamination. Method choice is organism-dependent.
Mineral-oil overlays can reduce drying and alter oxygen access; selected drying- or soil-based methods can suit resistant forms. These are not universal treatments or sterilising steps, and sensitive vegetative cells may recover poorly.
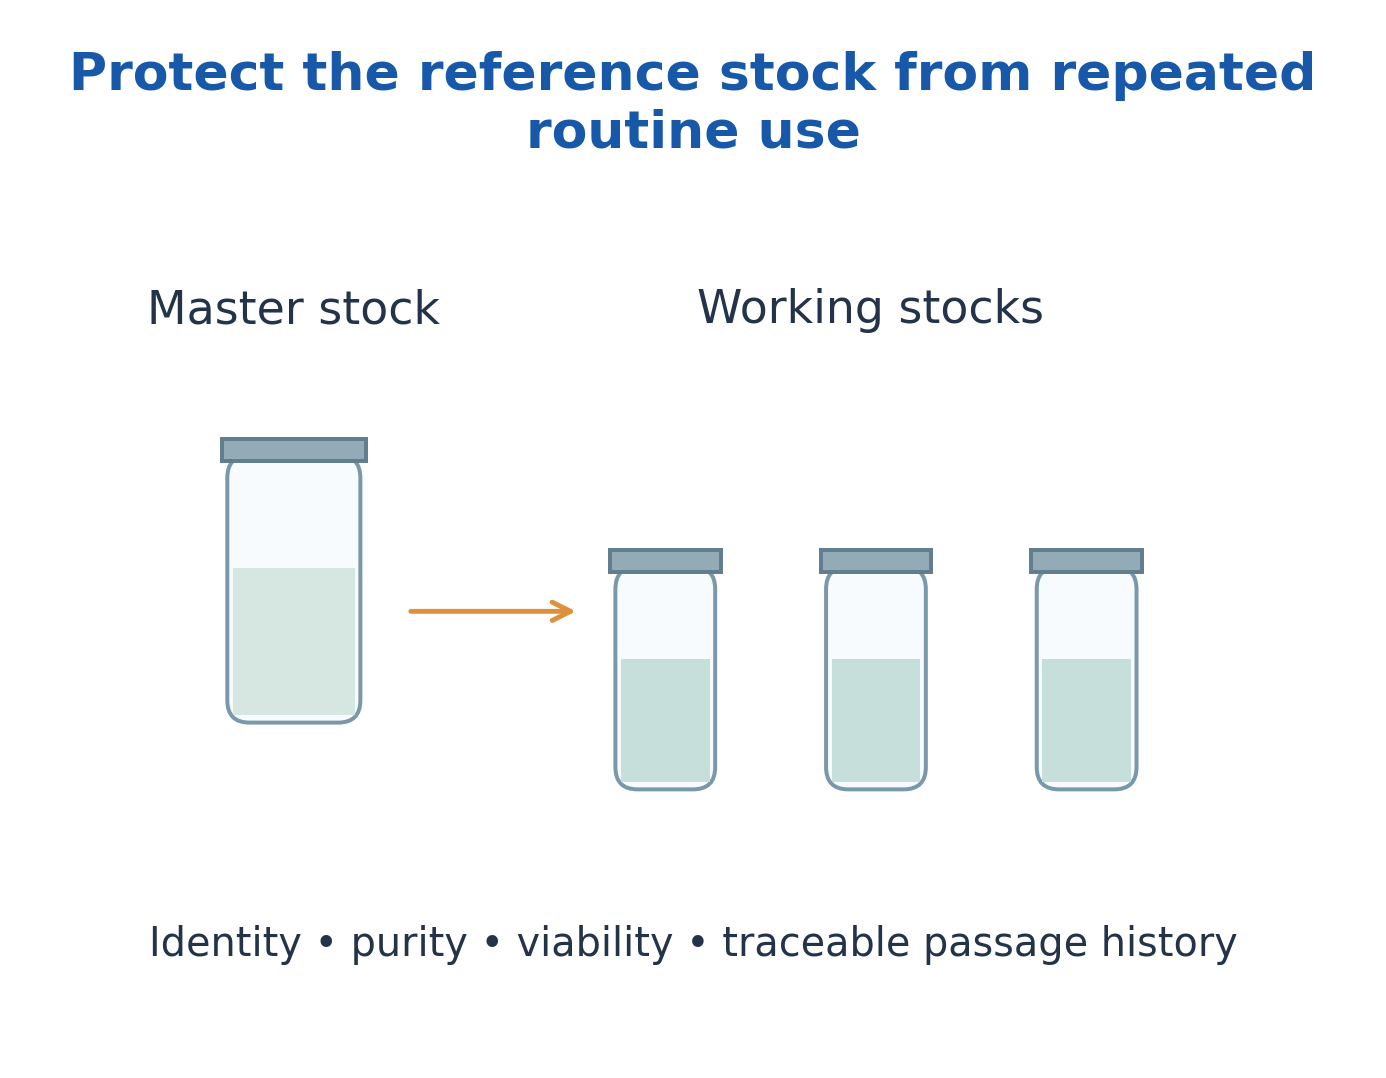
Figure explanation: The stock system separates a protected master stock from working stocks used routinely. The accompanying checks are identity, purity, viability and traceable passage history. This arrangement reduces repeated handling of the reference material.
25. Cryopreservation and Lyophilisation
Cryopreservation suppresses activity at low temperature. Ice formation, solute concentration and repeated freeze-thaw cycles can injure cells; appropriate protective formulations and controlled procedures improve recovery for suitable organisms.
Lyophilisation freezes a preparation, removes frozen water by sublimation under reduced pressure, and completes drying.
Both freezing and dehydration impose stress. A suitable protective matrix and sealed storage can improve stability. Neither method suits every strain.
After recovery, assess viability, purity and relevant phenotype/genotype; visible growth alone does not establish preservation quality.
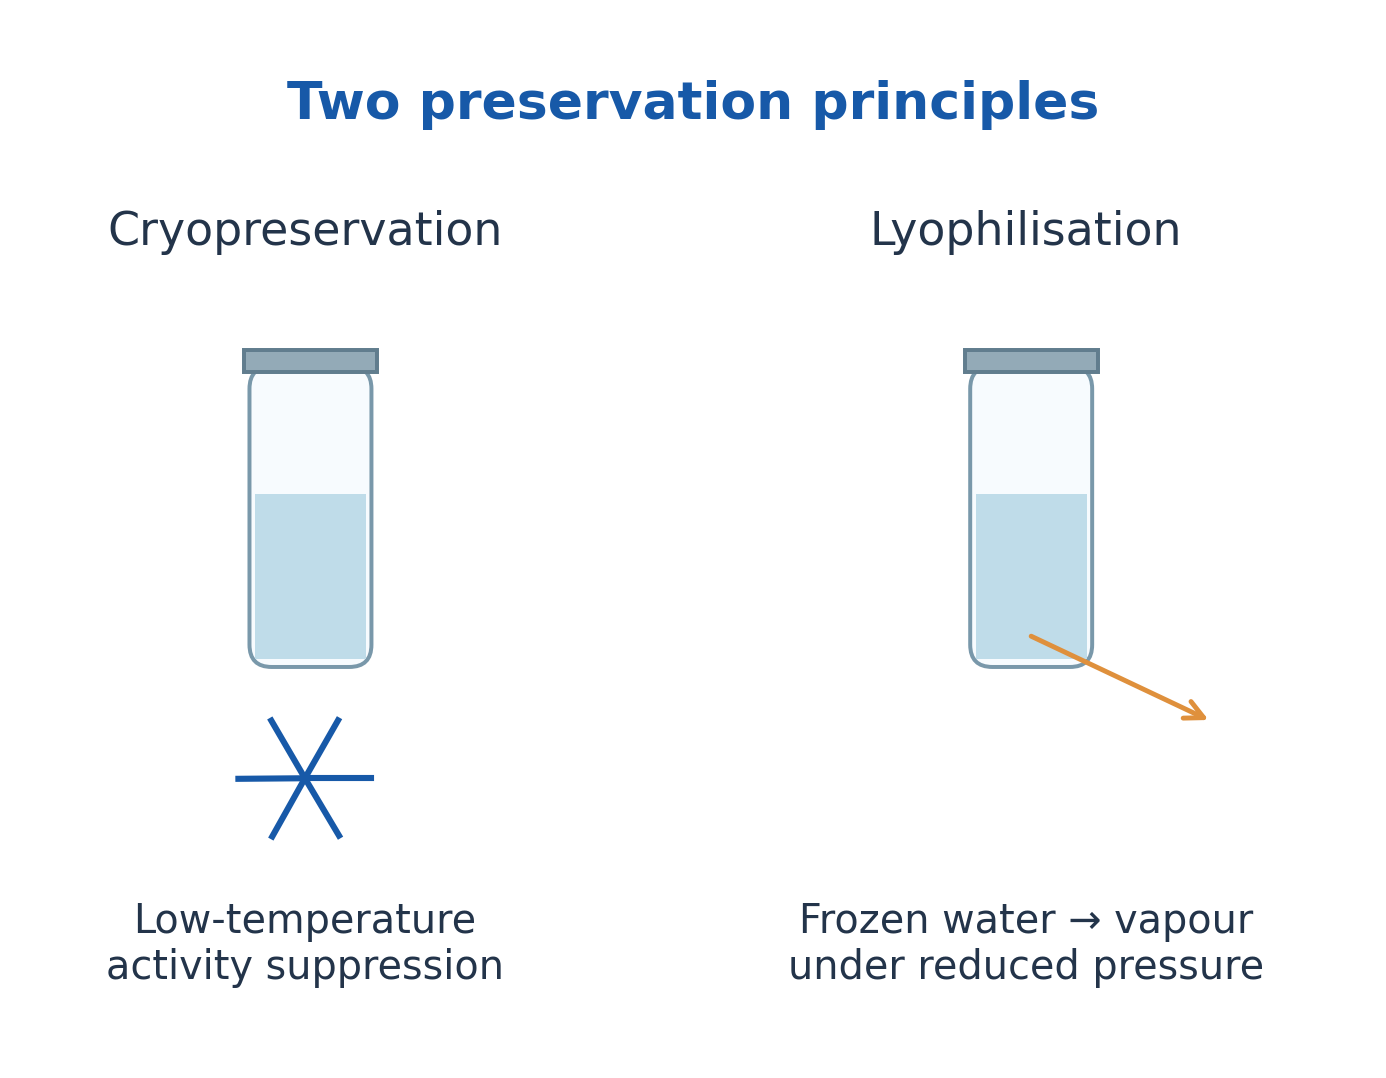
Figure explanation: Cryopreservation uses low-temperature activity suppression. Lyophilisation combines a frozen preparation with water removal under reduced pressure. Both require verified recovery and stability; the storage principle alone does not establish preservation quality.
| Feature | Cryopreservation | Lyophilisation |
|---|---|---|
| Main principle | Low-temperature suppression of activity | Freezing plus water removal by sublimation |
| Important stresses | Ice and freeze-thaw injury | Freezing and dehydration injury |
| Storage form | Frozen preparation | Dried preparation |
| Selection criterion | Verified survival and stability | Verified survival and stability |
26. Microbial Control: Essential Definitions
Microbial control endpoints differ.
Sterilisation is a validated process intended to eliminate viable microorganisms, including resistant forms, to the relevant assurance level.
Disinfection reduces or inactivates many pathogens on inanimate objects but does not automatically ensure sporicidal action.
Antisepsis is appropriate antimicrobial treatment of living tissue; cleaning removes soil and contamination; sanitisation reduces contamination to an acceptable defined level; asepsis prevents unwanted contamination.
Bactericidal treatment kills bacteria; bacteriostatic treatment inhibits multiplication. Inhibition may be reversible.
A pure culture contains viable intended organisms and is therefore not the same as a sterile preparation.
| Term | Core Meaning | Typical Target |
|---|---|---|
| Cleaning | Removal of soil and contamination | Surfaces and equipment |
| Disinfection | Microbial inactivation below sterilisation assurance | Inanimate objects |
| Antisepsis | Appropriate antimicrobial treatment | Living tissue |
| Sterilisation | Validated elimination of viable microorganisms | Compatible materials |
| Asepsis | Prevention of unwanted contamination | Processes and handling |
27. Factors Determining Control Effectiveness
Control depends on initial load, organism type and physiological state, aggregation, endospores, biofilms and protective surrounding material.
Chemical performance also depends on concentration, contact, temperature, pH, water quality and organic matter. Higher concentration does not always produce better performance or material compatibility.
Physical methods must reach the target: steam access, air removal, heat penetration and exposure uniformity matter.
A process suitable for equipment may damage tissue or a sensitive product.
Match method and validated endpoint to the material, interpret survival using the detection method, and avoid claims that a single agent or condition eliminates every microbe.
28. Moist Heat, Steam Sterilisation and Process Verification
Moist heat damages essential cellular components. Saturated steam can transfer heat effectively when it contacts the load.
Pressure allows steam temperatures above the normal boiling point; pressure alone is not the principal killing mechanism.
Around 121°C at about 15 psi gauge pressure is a familiar teaching reference, not a universal complete cycle.
Validated exposure depends on load, packaging, equipment, air removal and penetration.
Physical records monitor conditions; chemical indicators show exposure to selected conditions; biological indicators challenge the process using appropriate resistant forms. None should be interpreted without the validated procedure.
The chamber sketch shows steam entry, load and air-removal/drain paths, not a universal operating recipe.
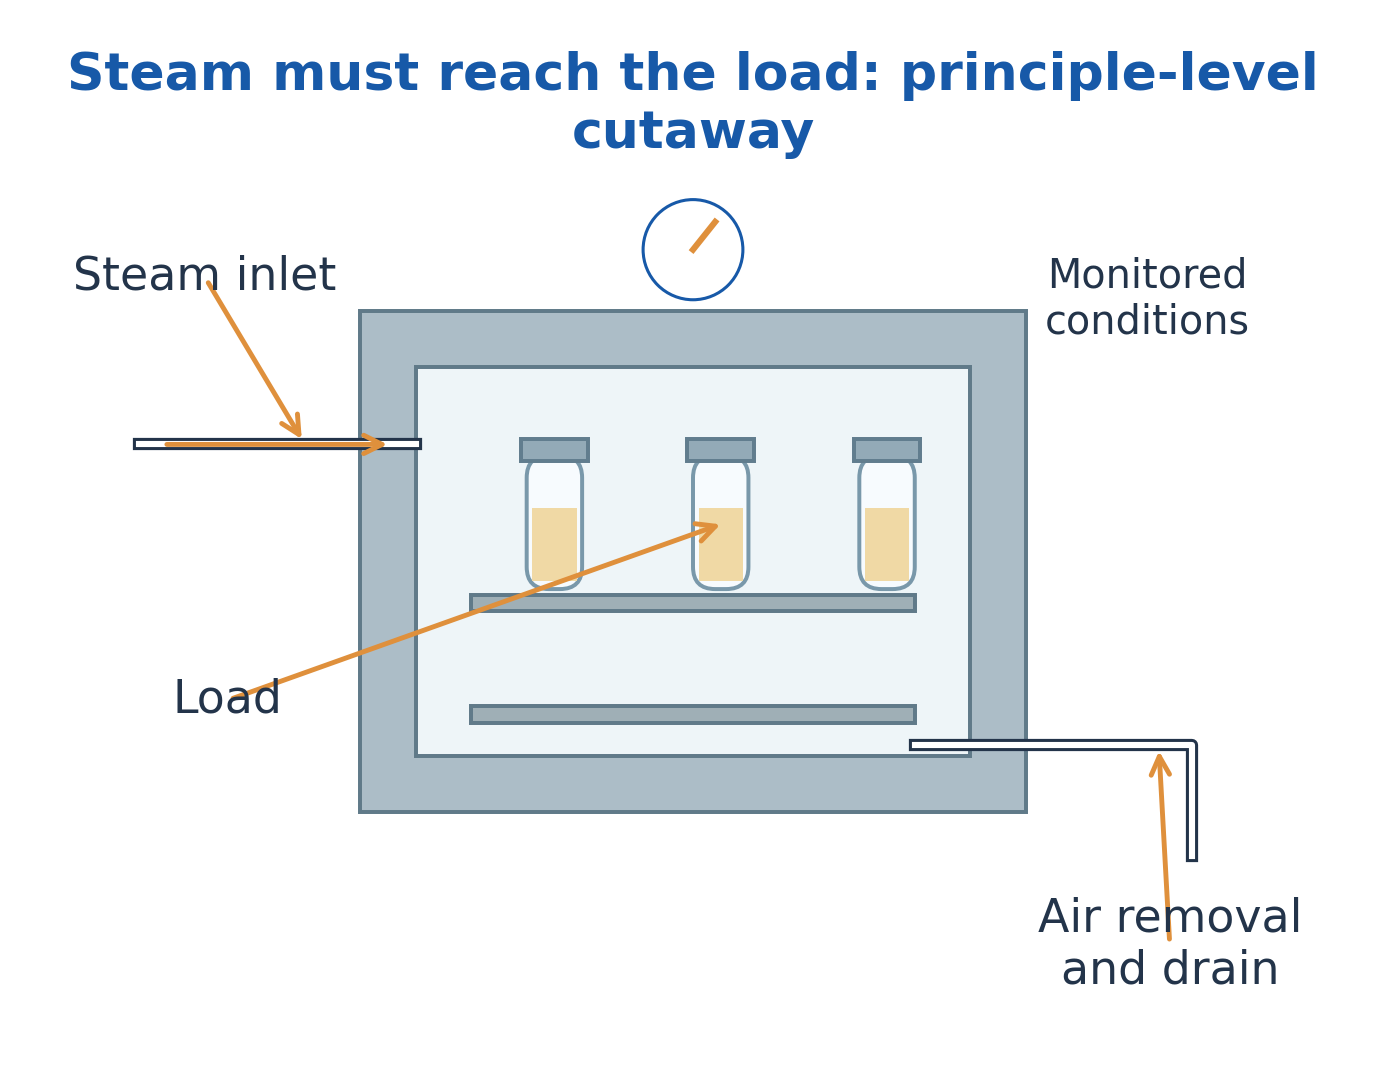
Figure explanation: The principle-level steam chamber identifies steam inlet, load, monitored conditions, and air-removal/drain paths. Steam must reach the load. Chamber conditions alone do not demonstrate equivalent exposure throughout every item.
29. Dry Heat, Low Temperature, Desiccation and Radiation
Dry heat causes thermal damage, including oxidative effects, and generally requires conditions different from moist heat. Flaming/incineration destroy suitable material.
Refrigeration and freezing mainly slow activity or impose stress; surviving cells may recover.
Desiccation and concentrated salts or sugars lower available water and inhibit many organisms, but resistant or tolerant populations can survive. Water activity is not simply total water content.
Ultraviolet radiation damages nucleic acids but penetrates poorly and can be blocked by shadowing. Ionising radiation penetrates differently and damages molecules directly or through radicals.
Match treatment to material, target and validated endpoint.
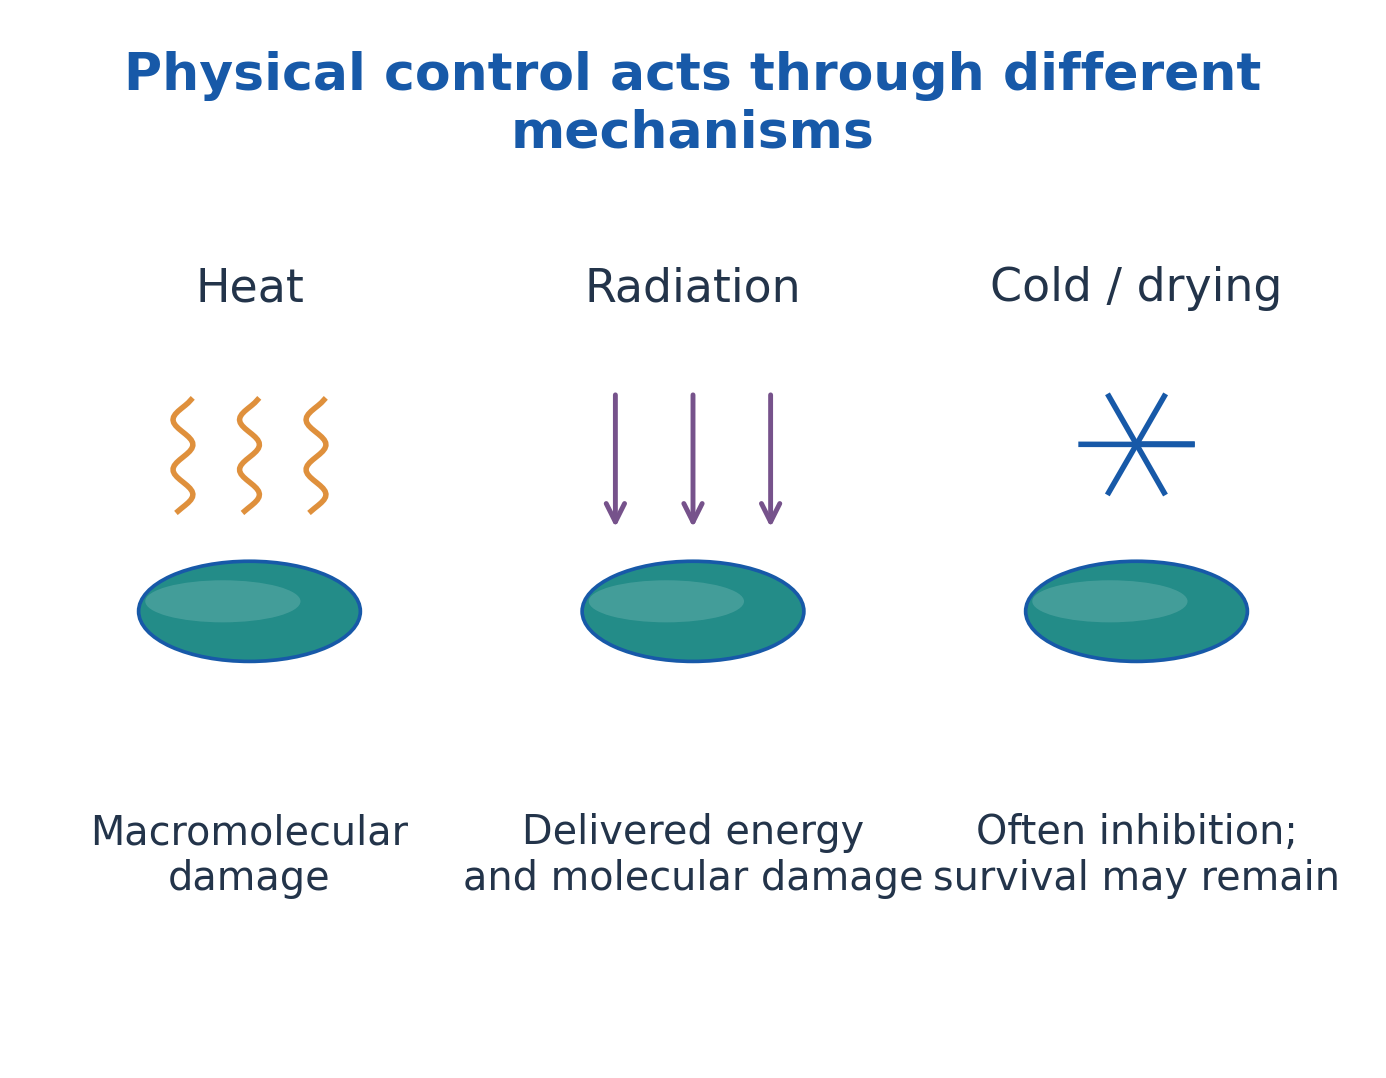
Figure explanation: Heat acts through macromolecular damage; radiation delivers energy that damages molecules. Cold and drying often inhibit activity while survival can remain. These paths reach different endpoints and cannot be treated as identical control mechanisms.
30. Filtration and Removal-Based Control
Filtration removes retained particles or microbial units through an appropriate barrier; it does not necessarily kill them.
Performance depends on filter properties, integrity, organism size and the fluid or air stream.
Liquid membrane filtration is useful for selected heat-sensitive solutions; air filtration can reduce airborne particles.
A named pore size does not automatically prove removal of every virus, toxin or dissolved molecule. Membrane compatibility, adsorption, seals and leakage affect performance.
Filter integrity and suitable downstream handling are essential. Filtration is a removal mechanism and must not be confused with chemical disinfection or universal sterility assurance.
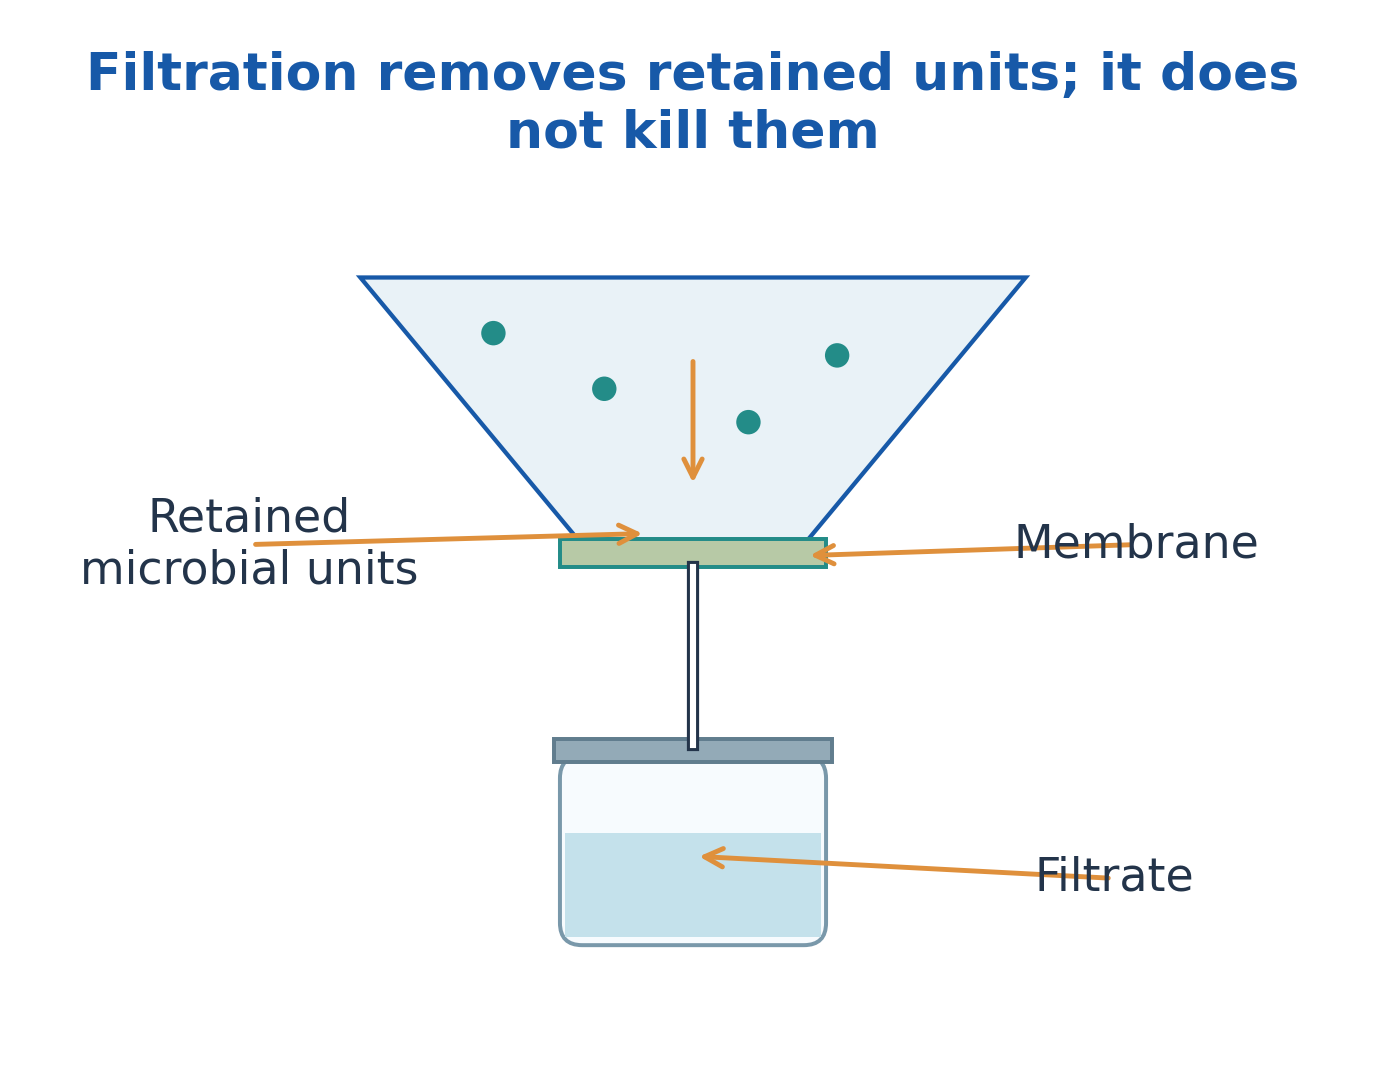
Figure explanation: Retained microbial units remain at the membrane while filtrate passes through. Filtration removes retained units; it does not necessarily kill them. The barrier and downstream path must remain appropriate and intact.
31. Chemical Agents: Mechanisms, Uses and Limitations
Alcohols disrupt membranes and denature proteins but are not reliable sporicidal agents.
Halogens and oxidants damage cellular components through reactive chemistry.
Phenolics affect membranes and proteins; quaternary ammonium compounds are surface-active agents with a limited spectrum; aldehydes and selected agents can chemically modify essential macromolecules.
Select an agent by required endpoint, target, surface, contact, organic load and material compatibility.
An agent suitable for inanimate equipment may be unsuitable for living tissue. Specialised low-temperature processes require validated cycles.
Antibiotics selectively target microbial structures or pathways in a different context; they are not interchangeable with general surface disinfectants.
| Agent Class | Principal Actions | Important Limitation |
|---|---|---|
| Alcohols | Membrane disruption and protein damage | Not reliable against endospores |
| Halogens/oxidants | Oxidative damage to components | Organic load and compatibility matter |
| Phenolics | Membrane and protein effects | Not appropriate for every material or tissue |
| Quaternary ammonium compounds | Surface/membrane effects | Limited spectrum; not universal sterilants |
| Aldehyde/specialised systems | Chemical modification of macromolecules | Requires controlled validated use |
32. Death Kinetics: Log Reduction, D-Value and z-Value
For a log-linear model, log reduction = log10(N0/N).
- One log means 90% reduction.
- Two logs mean 99% reduction.
- Three logs mean 99.9% reduction.
A reduction compares initial and surviving populations; it is not automatically proof of sterility.
The D-value is time for a one-log reduction at specified conditions:
t = D log10(N0/N)
The z-value is the temperature increase producing a tenfold decrease in D:
z = (T2 – T1)/log10(D1/D2)
Real survivor curves can show shoulders or tails.
Thermal death point traditionally uses a defined short reference exposure, commonly 10 minutes; thermal death time is time to a defined endpoint at a stated temperature. Both depend on the population and detection method.
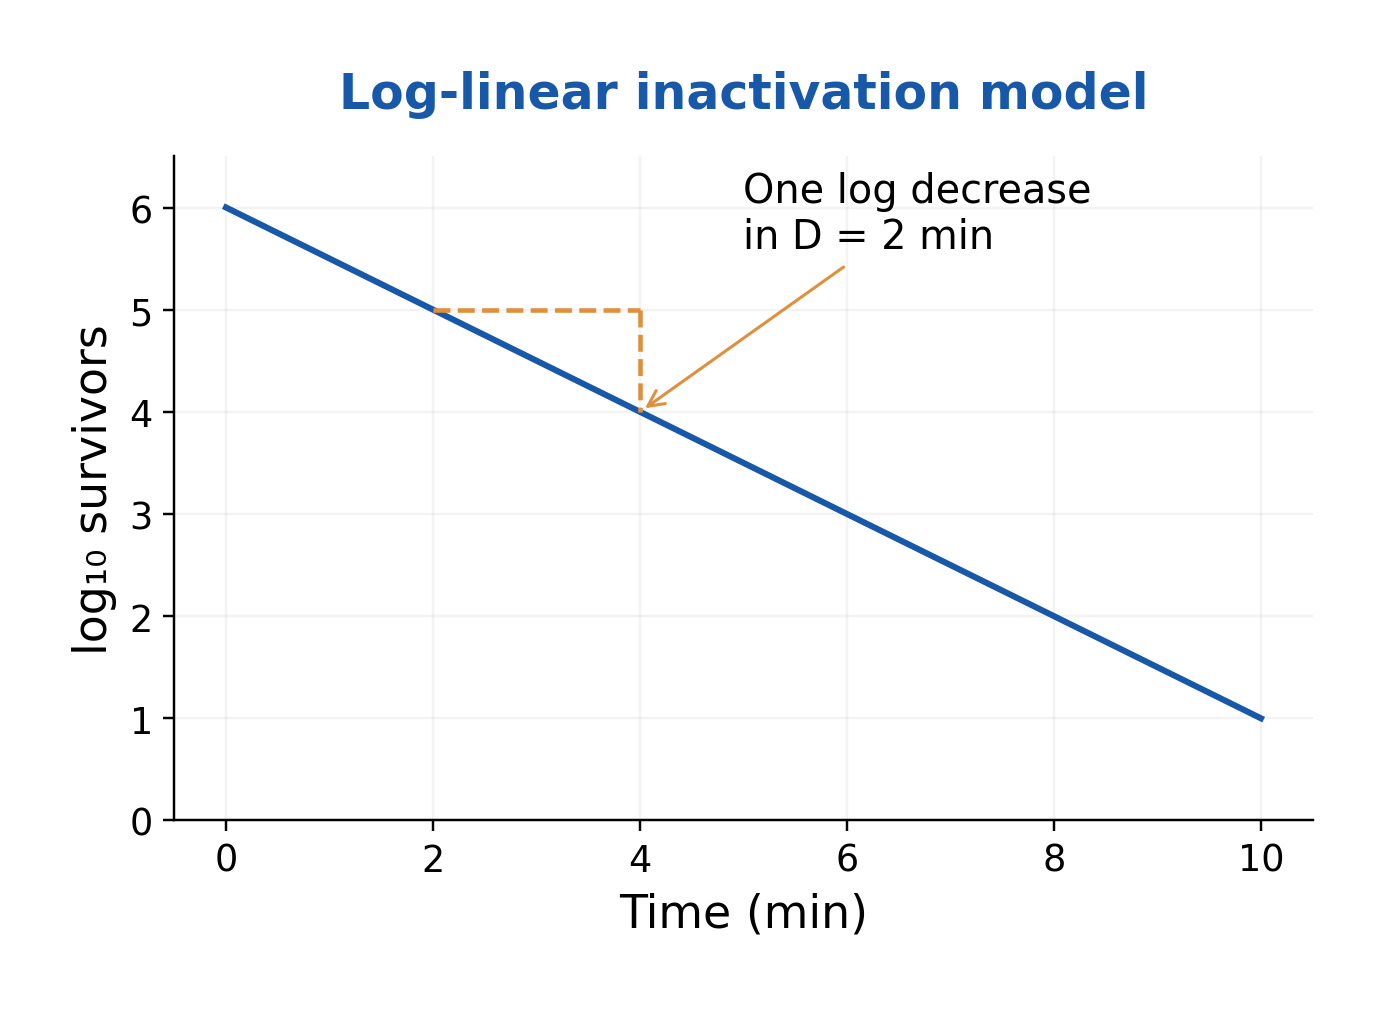
Figure explanation: The survivor graph plots log10 survivors against time. Its illustrative straight line falls by one log in D = 2 minutes. Each equal D interval gives the same fractional reduction under the model, rather than the same absolute number killed.
33. Enumeration: What Exactly Is Being Measured?
Enumeration measures abundance, but the signal must be defined: total cells, recoverable viable units, statistical estimates, optical scattering or biomass.
A direct count can include nonviable cells; CFU depends on colony formation; OD includes scattering particles; dry mass measures material rather than individual cells.
Choose the method for the question. An unknown mixture may require several complementary measurements.
Report units such as cells/mL, CFU/mL, MPN per tested volume or g/L. Always define the measurement basis and limitations.
A statement such as “10^6 bacteria” is incomplete without amount, method and biological interpretation.
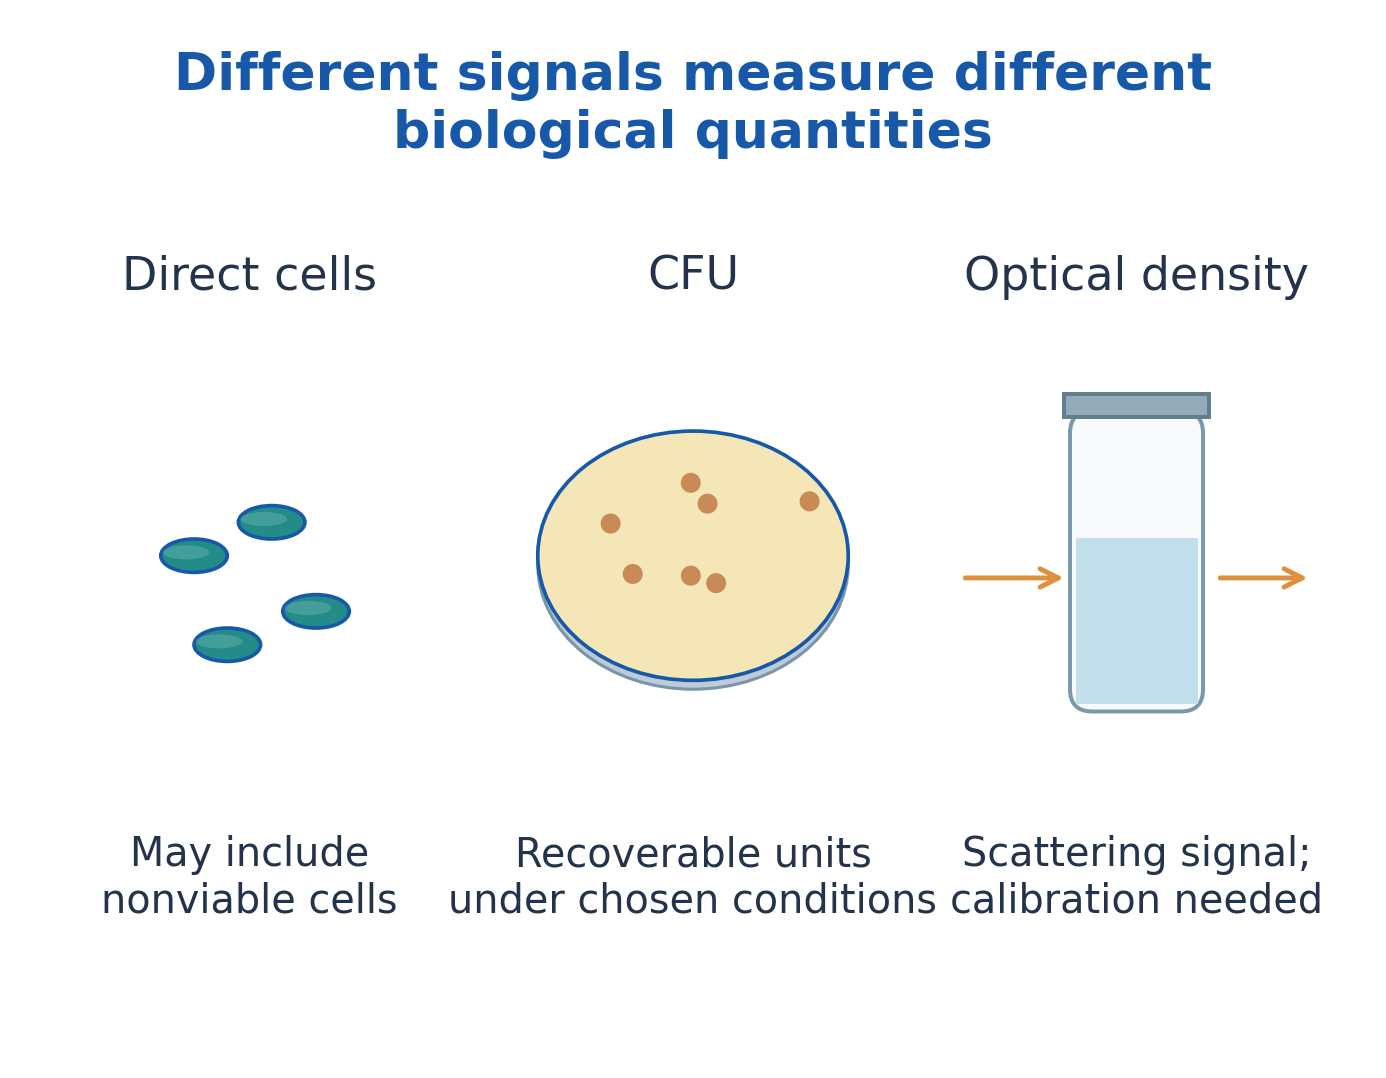
Figure explanation: The direct-cell image can include nonviable cells; CFU records recoverable units under chosen conditions; OD is a scattering signal that needs calibration. These are different biological quantities, even if each is used to describe abundance.
34. Direct Counting Chambers and Electronic Approaches
A counting chamber represents a known volume:
V = grid area × chamber depth
Mean counted cells divided by V gives observed concentration; correct for any prior dilution.
Convert units carefully: 1 mL = 1000 mm³. Count consistently across boundaries rather than double-counting adjacent grid areas.
Microscopy reveals morphology and arrangement but may miss sparse cells or confuse debris and aggregates.
Electronic/flow-based methods count selected signals and require discrimination thresholds.
Direct counting is rapid and need not require colony growth, but it does not establish viability unless a separately validated viability method is included.
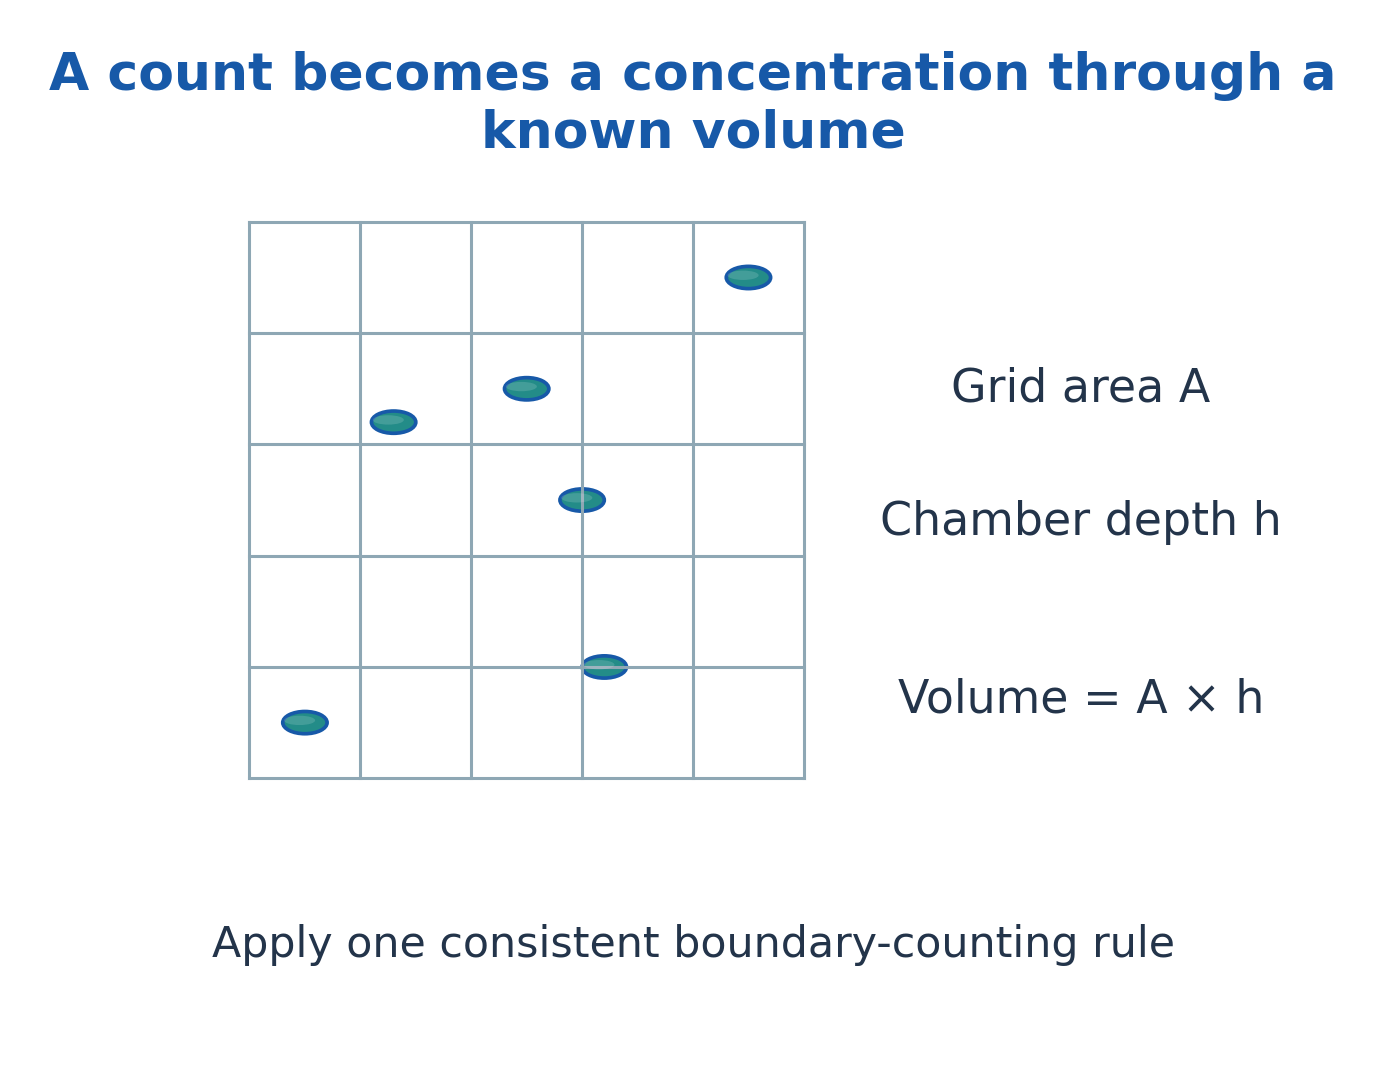
Figure explanation: The chamber drawing labels grid area A, chamber depth h, and volume = A × h. A counted number becomes concentration only after dividing by the known represented volume and correcting dilution. Apply one consistent boundary-counting rule.
35. Viable Plate Counts and the CFU Calculation
For C accepted colonies from V mL at dilution fraction d:
CFU/mL = C/(Vd)
If d = 10^-5, its reciprocal dilution factor is 10^5. Correcting only for dilution while ignoring a plated volume of 0.1 mL gives a tenfold error.
Use method-specific acceptance rules; a familiar textbook range such as 30–300 colonies is not universal.
Overcrowding merges colonies; low counts have greater sampling uncertainty. A clump can form one CFU, and a viable cell may fail to recover.
For identical-volume replicate plates at one dilution, the mean count can be used; do not casually average unlike dilutions without the applicable method.
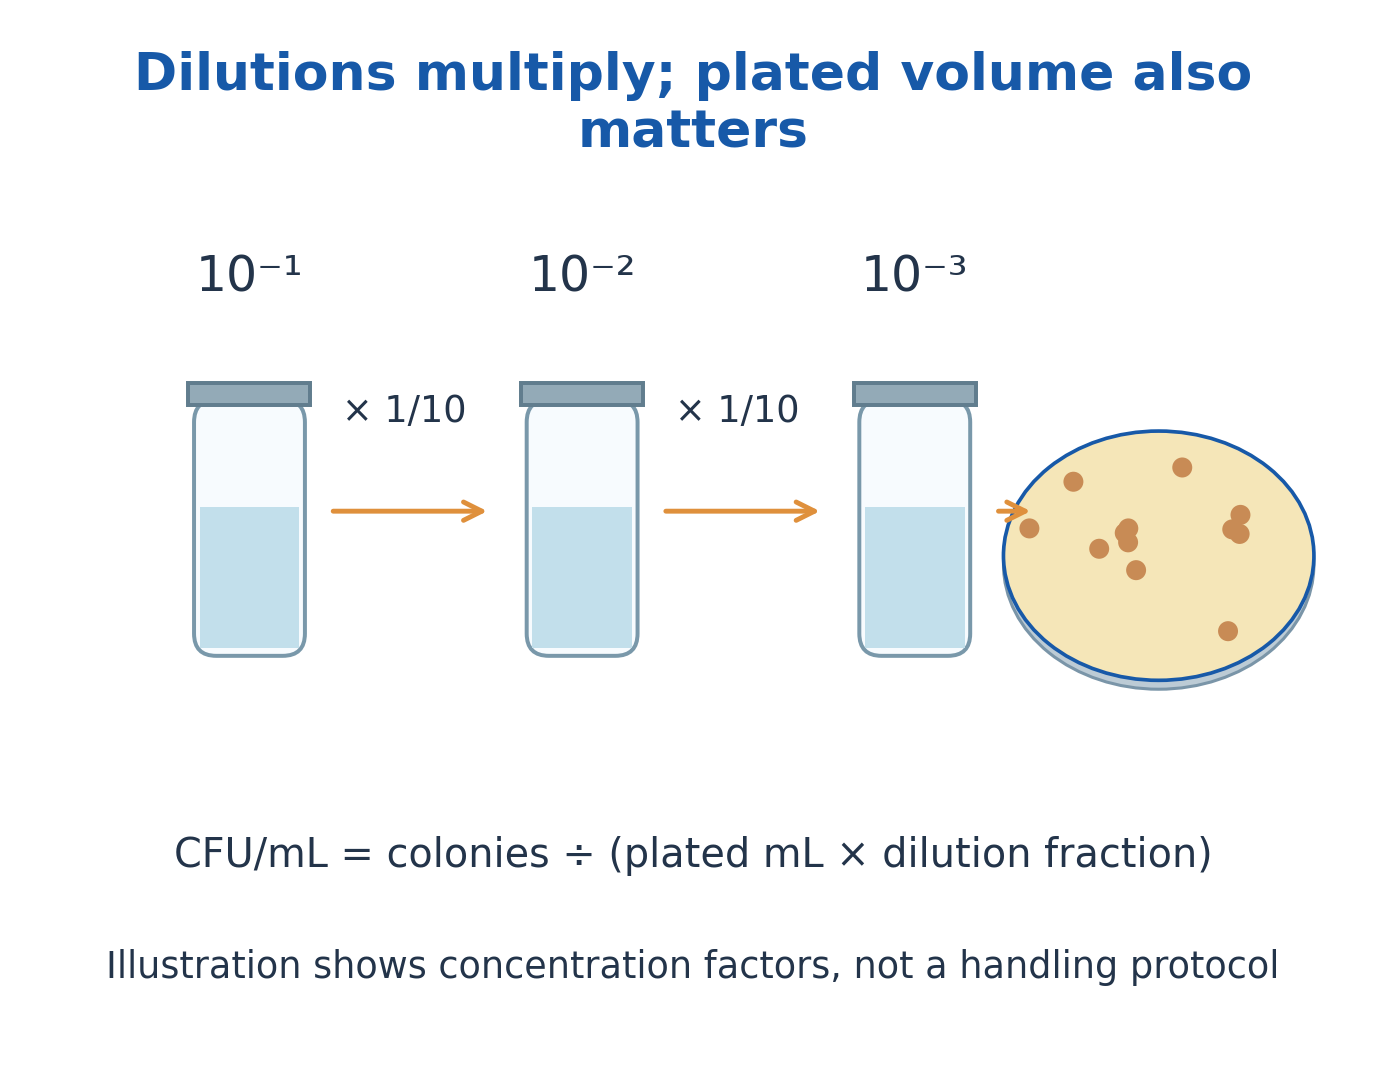
Figure explanation: The dilution sketches show successive concentration fractions 10^-1, 10^-2 and 10^-3. Stepwise fractions multiply. The formula is CFU/mL = colonies/(plated mL × dilution fraction). The illustration explains concentration factors and is not a handling protocol.
36. Membrane Enumeration, MPN and Detection Limits
Membrane enumeration concentrates a measured sample and counts recoverable units associated with the filter.
If V mL yields C accepted CFU without prior dilution, concentration is C/V CFU/mL. Include earlier dilution factors where applicable.
The most probable number method estimates abundance from positive/negative patterns at known sample amounts using an appropriate statistical model. It is not a direct colony count.
Zero detected colonies do not prove absence: one detected unit in V corresponds to a threshold of 1/V.
For zero independent Poisson events, an approximate 95% upper mean is 3, giving an upper concentration near 3/V, subject to sampling and recovery assumptions.
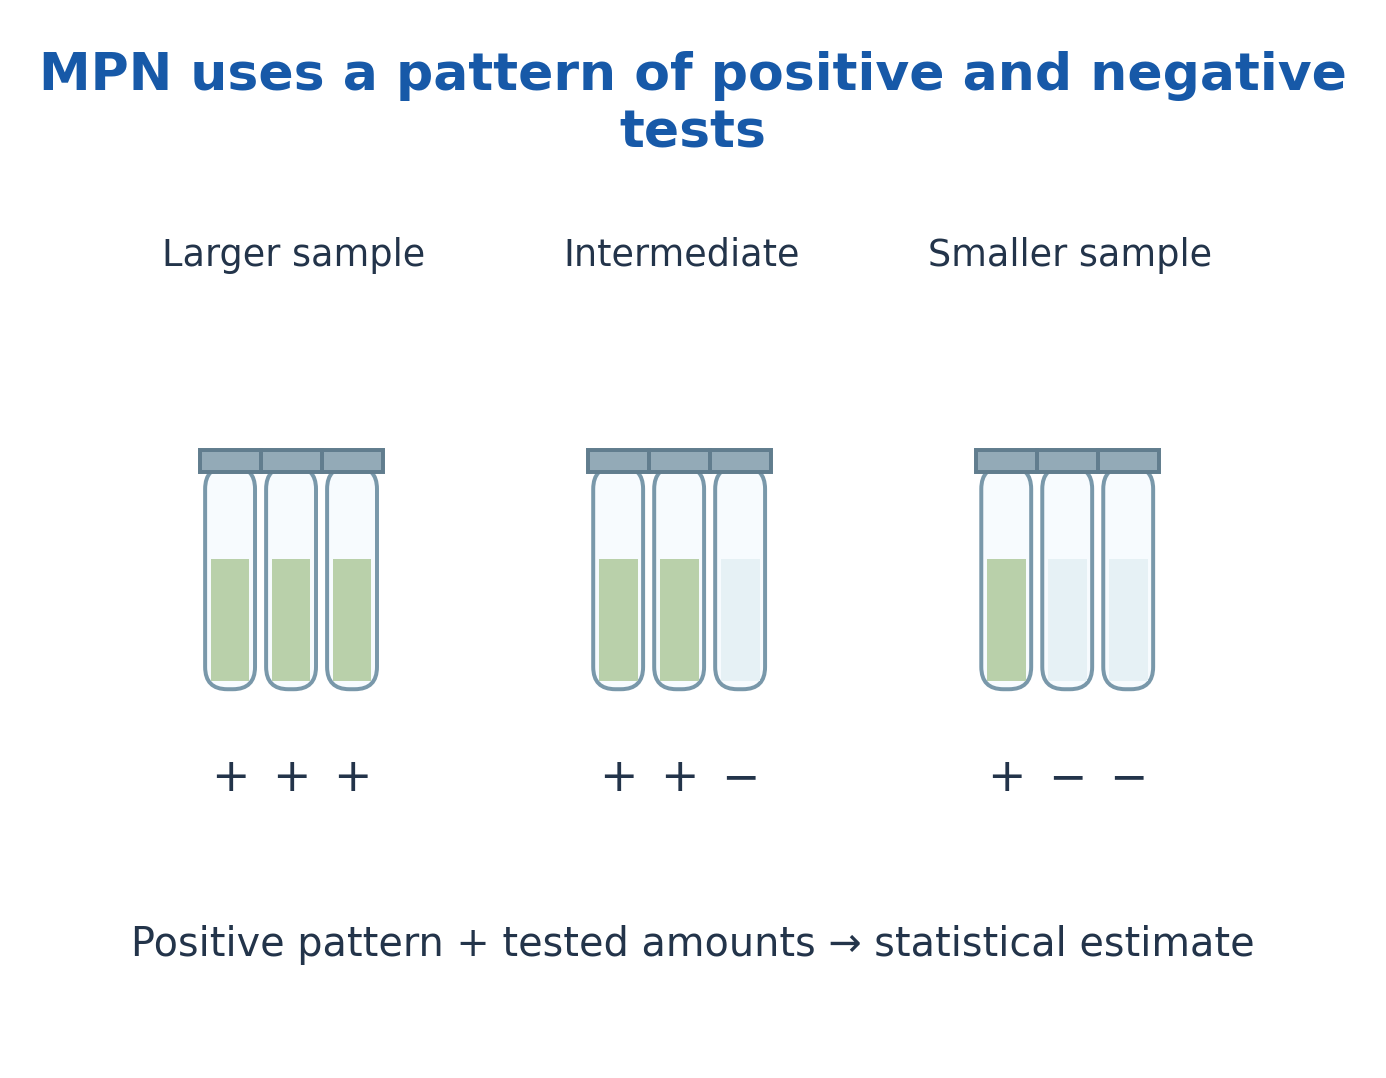
Figure explanation: The MPN sketch shows positive and negative tests at larger, intermediate and smaller represented sample amounts. The pattern and tested amounts feed a statistical estimate. It is different from directly counting colonies.
37. Turbidity, Optical Density and Biomass Measurements
Optical density measures light scattering associated with particles. Signal depends on cell size, shape, aggregation, instrument, wavelength and path length.
Use a suitable blank and validated range; dilute and correct when required. OD requires an organism- and instrument-specific calibration for quantitative cell or biomass estimates.
Dead cells and fragments can still scatter light, so OD is not automatically viable count. At high density, multiple scattering can destroy simple proportionality.
Dry-mass measurements require separation from medium solids and retained salts, and do not distinguish viable biomass.
CFU, OD and biomass curves may therefore differ without either measurement necessarily being wrong.
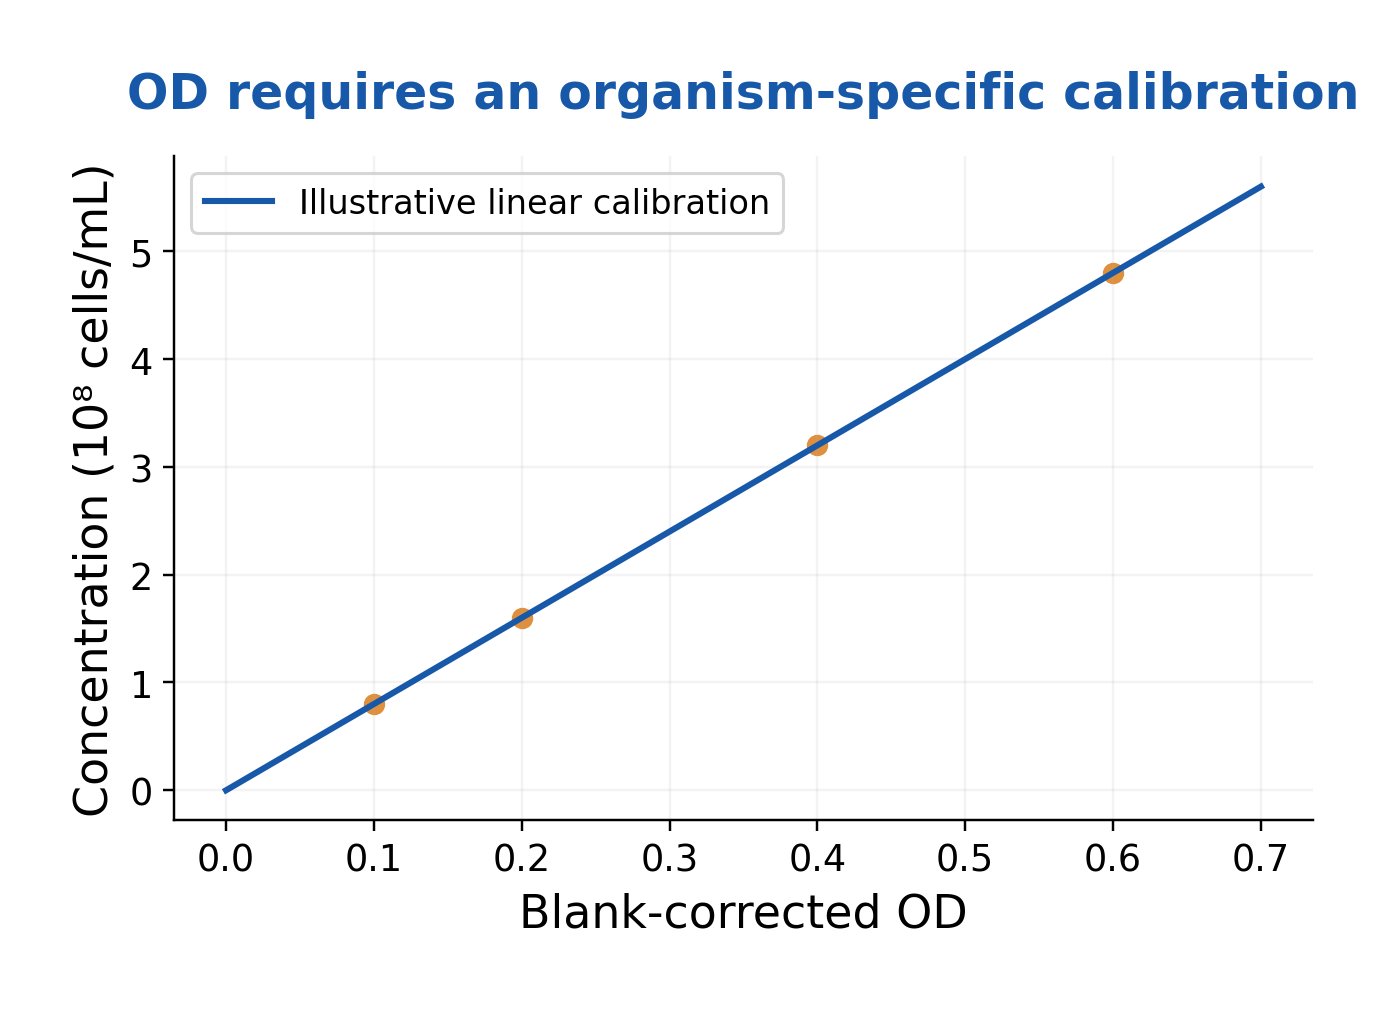
Figure explanation: The plot relates blank-corrected OD on the horizontal axis to concentration on the vertical axis. It is an illustrative linear calibration, labelled in 10^8 cells/mL. Quantitative interpretation requires the calibration to apply to the organism and instrument.
38. Binary Fission and the Four-Phase Batch Growth Curve
Binary fission involves chromosome replication and segregation, septum formation and separation of daughter cells. Cell number and biomass need not change identically.
A batch culture has no continuous matching inflow/outflow during the basic growth experiment.
The conventional viable-count curve has four phases:
- Lag: Physiological adjustment.
- Log/exponential: Approximately constant doubling.
- Stationary: Little net increase.
- Death: Declining recoverable units.
Stationary does not mean all cells are inactive; division and loss can continue. Death need not produce an immediate fall in OD.
Exponential growth forms a straight segment when abundance is plotted logarithmically.
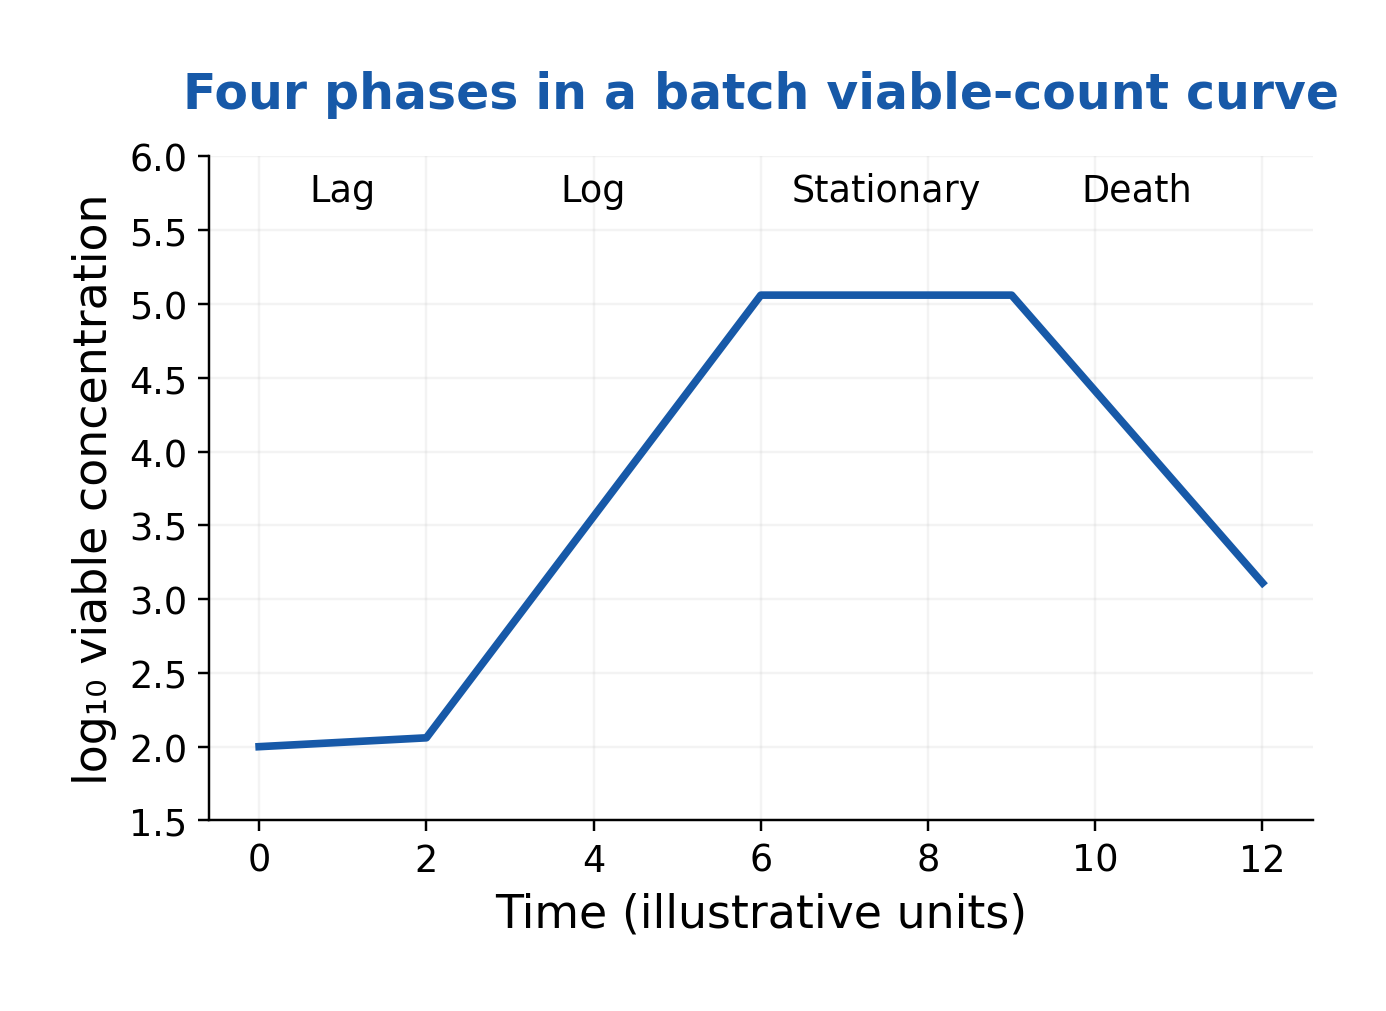
Figure explanation: The batch curve labels lag, log, stationary and death, with time on the horizontal axis and logarithmic viable concentration on the vertical axis. The stationary plateau indicates little net increase in that measurement, not absence of cellular activity.
39. Exponential Growth Equations and Generation Time
Repeated doubling gives:
N = N0 × 2^n
Therefore:
n = log2(N/N0) = 3.322 log10(N/N0)
Generation time is g = t/n and the base-2 rate is k = n/t = 1/g.
Thus:
N = N0 × 2^(t/g)
With constant specific growth rate:
dN/dt = μN
Integration gives:
N = N0e^(μt)
μ = ln(N2/N1)/(t2 – t1)
g = ln2/μ
Hence μ = k ln2; k and μ are not numerically identical.
Use consistent time units and an exponential interval. Account for dilution, changing sampling volume and clumping before interpreting a slope as growth.
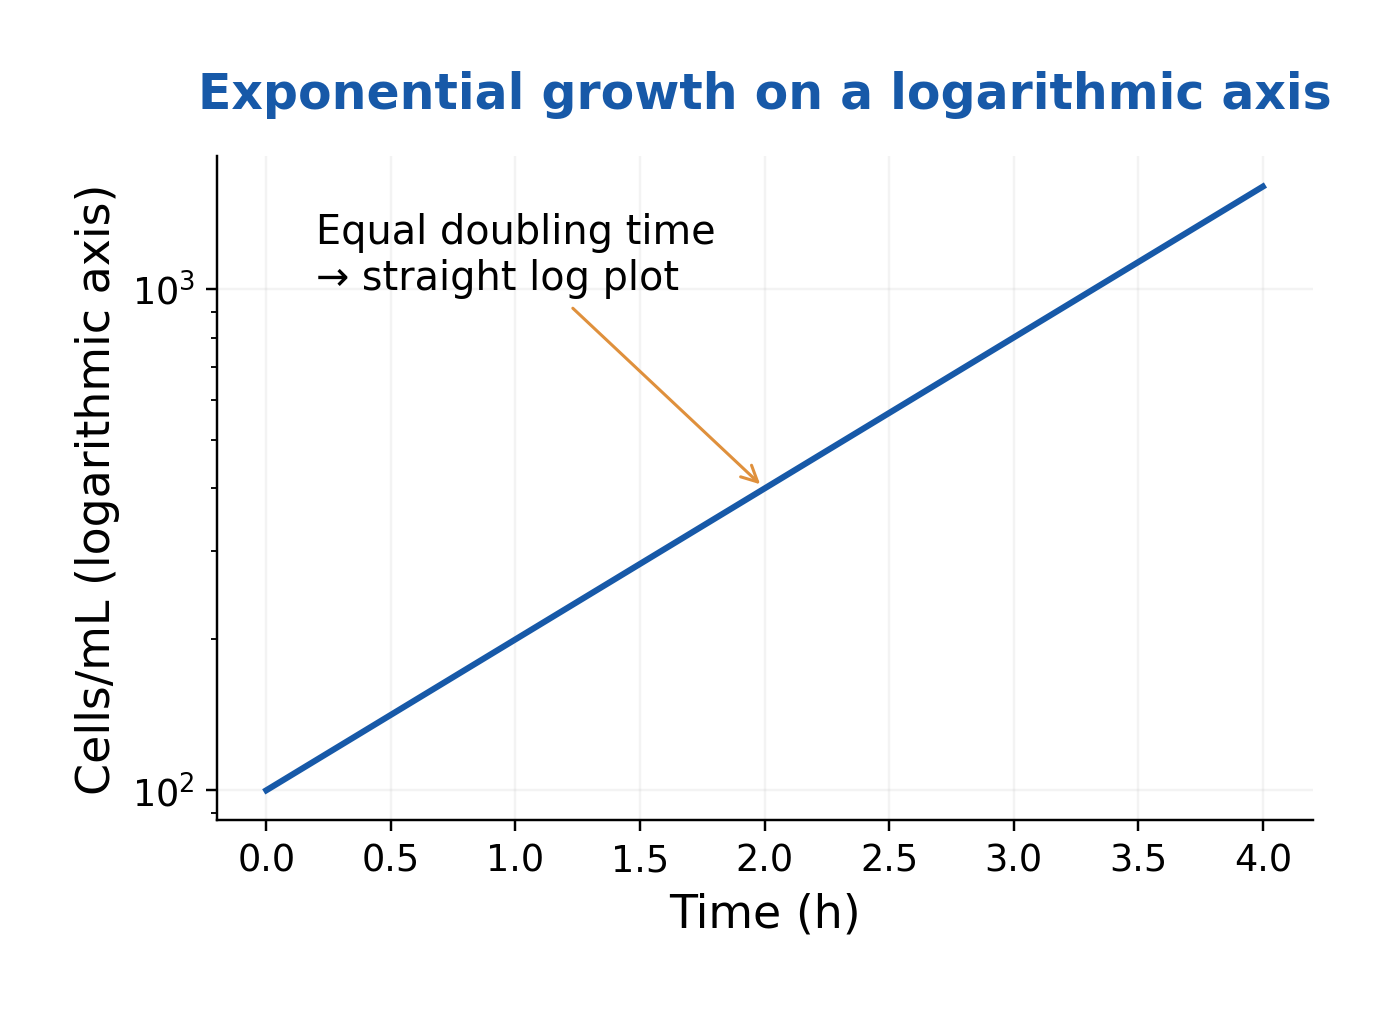
Figure explanation: The graph places cells/mL on a logarithmic vertical axis and time in hours on the horizontal axis. Equal doubling time produces a straight exponential-growth segment on this plot. A straight log plot must still be interpreted over a suitable growth interval.
40. Specific Growth Rate, Substrate Limitation and the Monod Model
For biomass concentration X in balanced exponential growth:
dX/dt = μX
The Monod relation for one limiting substrate is:
μ = μmax S/(Ks + S)
μ and μmax have inverse-time units; S and Ks use compatible concentration units.
At low S relative to Ks, rate is approximately proportional to S; at S = Ks, μ = μmax/2; at high S, rate approaches μmax.
The simple equation does not describe substrate inhibition or every oxygen, pH or nutrient limitation. Parameters are fitted for specified organisms and conditions.
Ks is a half-saturation parameter, not automatically a direct measurement of every molecular transporter’s affinity.
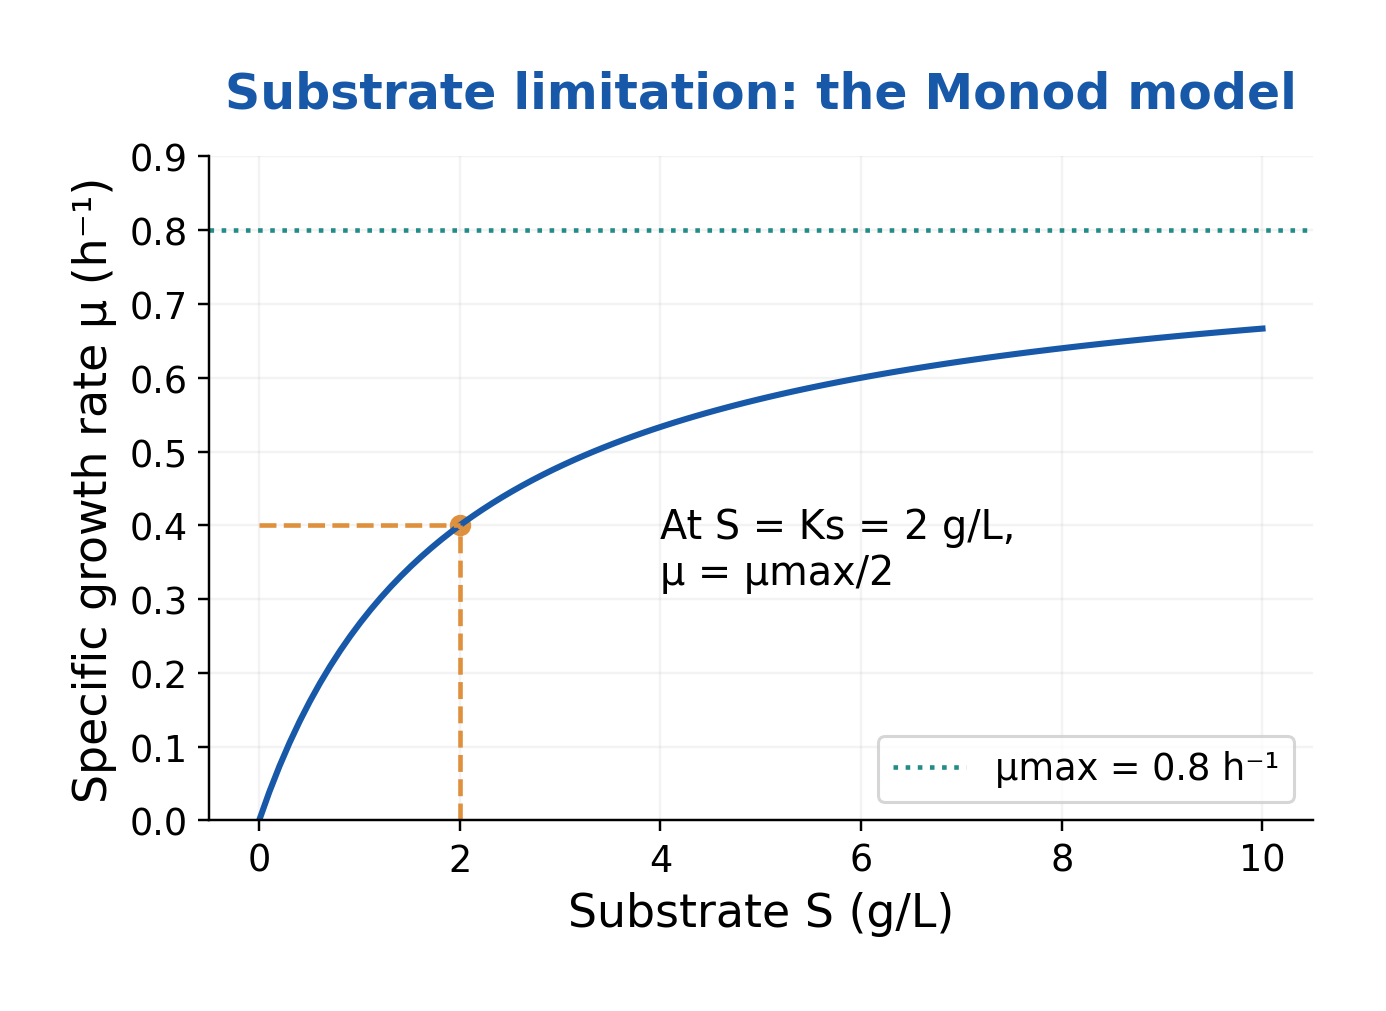
Figure explanation: The illustrative Monod plot uses substrate S in g/L and growth rate μ in h^-1, with μmax = 0.8 h^-1 and Ks = 2 g/L. At S = Ks, μ = μmax/2. The curve approaches μmax as S increases under the stated model.
41. Yield, Productivity, Batch and Continuous Cultivation
Observed biomass yield is:
Yx/s = (X – X0)/(S0 – S)
Use compatible bases, commonly g biomass/g substrate.
Productivity is output per time, such as g/L/h; high yield need not mean high productivity.
Batch begins without continuous medium exchange; fed-batch adds selected material without matching continuous withdrawal in its usual model.
A chemostat has equal inflow/outflow F at constant volume V, giving:
D = F/V
With no biomass in feed and negligible decay:
dX/dt = (μ – D)X
A nonzero steady state therefore requires μ = D. Excess removal relative to sustainable growth can cause washout. Feasibility depends on the actual system.
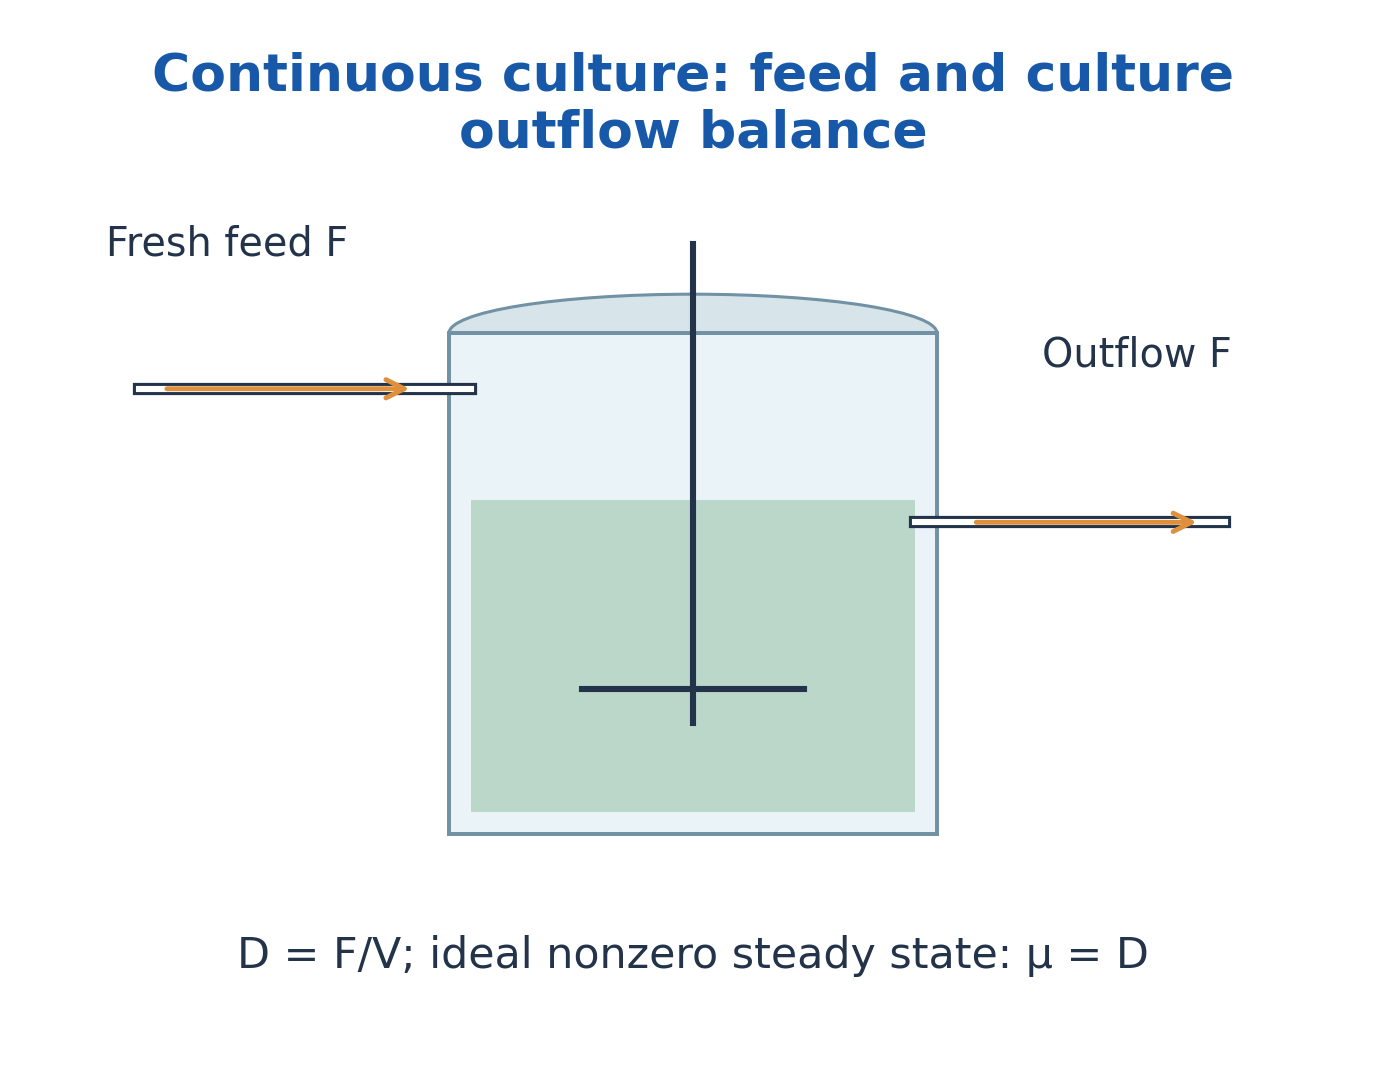
Figure explanation: The continuous-culture sketch labels fresh feed F, culture outflow F and working volume V. Equal inflow/outflow keeps the ideal volume constant. D = F/V, and a feasible nonzero steady state has μ = D under the stated no-significant-decay model.
42. Environmental Effects and Interpretation of Growth Data
Growth depends on temperature, pH, water activity, osmotic conditions, oxygen and nutrients.
Minimum, optimum and maximum temperatures describe an organism under stated conditions; optimum growth need not mean maximum enzyme stability.
Psychrophiles, mesophiles and thermophiles describe temperature-associated patterns; acidophiles, neutrophiles and alkaliphiles describe pH patterns.
Halophiles require elevated salt; halotolerant organisms tolerate it.
For kinetics, use comparable measurements from an approximately linear logarithmic interval. A slope spanning lag, log and stationary phases is not an exponential-phase μ.
Investigate clumping, cell-size shifts, recovery, dilution, blank and sampling changes before attributing every difference to biology.
Solved Problems: Counting, Growth and Control
All numerical data below are stated educational examples. Use the specified measurement basis and model; the results do not establish a universal culture condition or treatment cycle.
Worked Problem 1.1: Plate Count with a Measured Surface Volume
Question: A plate prepared from a 10^-5 dilution gives 84 accepted colonies. The plated volume is 0.1 mL. Estimate the original viable-unit concentration.
Step 1: Use C/(Vd), with C = 84, V = 0.1 mL and d = 10^-5.
Step 2: The represented original-sample volume is Vd = 10^-6 mL.
Step 3: Concentration = 84/10^-6 = 8.4 × 10^7 CFU/mL.
Answer: 8.4 × 10^7 CFU/mL.
Check: Using only 84 × 10^5 would miss the tenfold correction for plating 0.1 mL. CFU does not necessarily mean individual cells.
Worked Problem 1.2: A Mass-Based Sample Suspension
Question: A stated preparation contains 10 g of sample in a final suspension volume of 100 mL. A 10^-3 dilution of this suspension gives 42 accepted colonies from 0.1 mL. Calculate CFU/g in the original material.
Step 1: Suspension concentration = 42/(0.1 × 10^-3) = 4.2 × 10^5 CFU/mL.
Step 2: The initial suspension represents 10/100 = 0.1 g per mL.
Step 3: Mass-based concentration = (4.2 × 10^5)/0.1 = 4.2 × 10^6 CFU/g.
Answer: 4.2 × 10^6 CFU/g.
Check: The stated final volume is required. Do not silently assume that adding 100 mL to a solid creates exactly 100 mL final suspension.
Worked Problem 1.3: Zero Observed Colonies
Question: No colonies are observed from a total tested amount of 10 mL under the stated recovery method. Give the one-colony reporting threshold and a simple Poisson 95% upper concentration estimate.
Step 1: One-colony threshold = 1/10 = 0.1 CFU/mL.
Step 2: For zero independent Poisson events, the upper mean λ solves exp(-λ) = 0.05.
Step 3: λ = -ln(0.05) ≈ 2.996; upper concentration ≈ 2.996/10 = 0.30 CFU/mL.
Answer: Not detected in the tested 10 mL; one-colony threshold 0.1 CFU/mL, approximate model-based 95% upper concentration 0.30 CFU/mL.
Check: These are different quantities. Neither means that the full source is proven sterile; recovery and sampling assumptions matter.
Worked Problem 1.4: Counting Chamber Geometry
Question: A counted grid area is 1 mm² and chamber depth is 0.02 mm. The mean count is 40 cells. There is no prior dilution. Calculate concentration.
Step 1: Volume = 1 × 0.02 = 0.02 mm³.
Step 2: Since 1 mL = 1000 mm³, the counted volume is 2 × 10^-5 mL.
Step 3: Concentration = 40/(2 × 10^-5) = 2.0 × 10^6 cells/mL.
Answer: 2.0 × 10^6 cells/mL.
Check: Convert the complete volume; treating mm³ as mL would create a thousandfold error.
Worked Problem 1.5: OD Calibration with a Dilution Correction
Question: For a stated organism and instrument in its validated range, concentration is 8.0 × 10^8 times blank-corrected OD in cells/mL. A 1:5 dilution reads OD = 0.25. Estimate the original concentration.
Step 1: Measured suspension concentration = (8.0 × 10^8) × 0.25 = 2.0 × 10^8 cells/mL.
Step 2: Correct for the fivefold dilution.
Step 3: Original estimate = 1.0 × 10^9 cells/mL.
Answer: 1.0 × 10^9 cells/mL under the stated calibration.
Check: The calibration is supplied for this model. It is not a universal OD-to-cell or OD-to-CFU conversion.
Worked Problem 1.6: Number of Generations and Generation Time
Question: A comparable population count rises from 2.0 × 10^5 to 1.6 × 10^6 over a 90-minute exponential interval. Find n and g.
Step 1: The ratio is 1.6 × 10^6/(2.0 × 10^5) = 8.
Step 2: n = log2(8) = 3 generations.
Step 3: g = 90/3 = 30 minutes per generation.
Answer: Three generations; generation time 30 min.
Check: The count increased by a factor of eight, not by eight generations.
Worked Problem 1.7: Specific Growth Rate from Two Counts
Question: Biomass concentration rises from 0.40 to 1.60 g/L over 2 h in a suitable exponential interval. Calculate μ and generation time.
Step 1: μ = ln(1.60/0.40)/2 = ln4/2 = 0.6931 h^-1.
Step 2: g = ln2/μ = 1.000 h.
Step 3: The same fourfold increase represents two doublings in 2 h.
Answer: μ ≈ 0.693 h^-1; g = 1 h.
Check: Use natural logarithms in this formula; log10 requires its conversion factor.
Worked Problem 1.8: Monod Growth Rate
Question: For a model with μmax = 0.80 h^-1, Ks = 2.0 g/L and S = 6.0 g/L, calculate μ.
Step 1: μ = μmax S/(Ks + S).
Step 2: μ = 0.80 × 6/(2 + 6).
Step 3: μ = 0.60 h^-1.
Answer: 0.60 h^-1.
Check: At this substrate concentration the model reaches 75% of μmax; it does not exceed the maximum.
Worked Problem 1.9: Biomass Yield on Substrate
Question: Biomass rises from 0.20 to 2.20 g/L while the limiting substrate falls from 10 to 6 g/L. Calculate observed Yx/s.
Step 1: Biomass increase = 2.20 – 0.20 = 2.00 g/L.
Step 2: Substrate consumed = 10 – 6 = 4.00 g/L.
Step 3: Yx/s = 2/4 = 0.50 g biomass/g substrate.
Answer: 0.50 g/g.
Check: Use substrate consumed, not substrate remaining. The observed yield does not separately resolve maintenance or by-product formation.
Worked Problem 1.10: Steady-State Substrate in an Ideal Chemostat
Question: A simple Monod chemostat model has μmax = 0.50 h^-1, Ks = 0.20 g/L and D = 0.30 h^-1. Find the model substrate concentration for a nonzero steady state.
Step 1: Set D = μmax S/(Ks + S).
Step 2: Rearrange S = D Ks/(μmax – D).
Step 3: S = (0.30 × 0.20)/(0.50 – 0.30) = 0.30 g/L.
Answer: 0.30 g/L if a feasible nonzero state exists.
Check: D must be below μmax for this expression, and the feed and full balances must support the resulting state.
Worked Problem 1.11: Treatment Time from a D-Value
Question: For an ideal log-linear model at a stated temperature, D = 2 min. How long is needed to reduce an expected count from 10^7 to 10^2?
Step 1: Required log reduction = log10(10^7/10^2) = 5.
Step 2: t = D × 5 = 2 × 5.
Step 3: t = 10 min under the model.
Answer: 10 min of the defined exposure under the assumed model.
Check: This is a model calculation, not validation of a real sterilisation cycle or a universal load treatment.
Worked Problem 1.12: Temperature Change and z-Value
Question: A model gives D = 10 min at temperature T1 and D = 1 min at T2 = T1 + 10°C. Calculate z.
Step 1: The D-value changes by a factor of 10.
Step 2: That is one log10 unit of change in D.
Step 3: z = (T2 – T1)/log10(D1/D2) = 10/1.
Answer: z = 10°C over the specified model range.
Check: This describes the temperature sensitivity of D, not the time required for a one-log reduction.
Quick Revision: Answers with Reasons
Why Is 70S Not the Arithmetic Sum of 50S and 30S?
Svedberg units describe sedimentation behaviour, which depends on particle shape and interactions as well as mass. They are not ordinary additive masses.
Is the Bacterial Wall the Main Selectively Permeable Barrier?
No. The wall provides mechanical support and protection against osmotic stress; the cytoplasmic membrane is the principal selectively permeable barrier.
Why Can One CFU Represent More Than One Cell?
A pair, chain or aggregate can remain together and produce one colony. CFU records an effective colony-forming unit under the recovery conditions.
Is Sporulation a Reproductive Process That Increases Bacterial Numbers?
Ordinary bacterial endospore formation is a survival process: one cell forms one endospore, which later returns to a vegetative cell before further multiplication.
What Separates Classification from Identification?
Classification builds groups using defined criteria; identification uses evidence to place an unknown within an existing framework. Nomenclature supplies accepted names.
Can a Medium Be Enriched and Differential?
Yes. A nutrient-supplemented medium may also reveal a biological difference, as blood agar can support demanding organisms and display haemolysis patterns.
Does a Successful Streak Plate Provide the Original CFU/mL?
Generally no. Streaking principally separates growth. Quantitative CFU estimation requires a defined represented sample amount and a suitable counting method.
Why Does Preservation Need More Than a Growth Check?
A recovered stock may grow while being contaminated, misidentified or altered. Viability, purity and identity are separate checks.
Why Is Pressure Mentioned in Steam Sterilisation?
It permits saturated steam to reach a temperature above the normal boiling point. Steam access and heat delivery, rather than pressure alone, produce the intended inactivation.
Does a Chemical Indicator Prove Sterility?
No. It indicates exposure to selected process conditions. Appropriate physical, chemical and biological monitoring are interpreted together with the validated process.
Why Can an OD Curve Remain High While CFU Falls?
Nonviable cells, fragments or other particles can still scatter light. OD and recoverable viable units measure different properties.
Is Stationary Phase the Same as Zero Specific Activity in Every Cell?
No. The population shows little net increase in the chosen measurement; metabolism, division, loss and physiological changes can continue.
What Distinguishes Yield from Productivity?
Yield relates output to input consumed, such as g biomass per g substrate. Productivity relates output to time, such as g/L/h.
Does Zero Growth in a Tested Amount Prove Absence in the Source?
No. The result is constrained by tested amount, recovery and detection limits. A model-based upper bound is not the same as observing zero organisms everywhere.
Formula and Method Sheet
| Quantity | Relation and Conditions |
|---|---|
| CFU concentration | C/(Vd); V in mL; d is plated dilution fraction |
| Cumulative dilution | Product of all stepwise dilution fractions |
| Direct count | Mean cells / represented chamber volume; correct prior dilution |
| Generations | n = log2(N/N0) = 3.322 log10(N/N0) |
| Generation time | g = t/n = ln2/μ |
| Specific growth rate | μ = ln(N2/N1)/(t2 – t1), from an exponential interval |
| Base-2 rate | k = n/t = 1/g; μ = k ln2 |
| Exponential prediction | N = N0e^(μt) = N0 × 2^(t/g) |
| Monod model | μ = μmax S/(Ks + S); parameters refer to fitted conditions |
| Biomass yield | Yx/s = (X – X0)/(S0 – S), on a compatible basis |
| Average productivity | Δoutput concentration/Δtime |
| Dilution rate | D = F/V; units inverse time |
| Ideal chemostat | μ = D at a feasible nonzero steady state without significant decay |
| Log reduction | log10(N0/N) |
| D-value relation | t = D log10(N0/N), for log-linear inactivation |
| z-value relation | z = (T2 – T1)/log10(D1/D2), for the stated model range |
Final Calculation Checklist
Identify the measured quantity; write units; distinguish dilution fraction from its reciprocal; correct for plated volume; select the relevant logarithm base; use an appropriate growth interval; and state model and detection limitations.