
Course: AKTU B.Tech 2nd Year | Semester III
Course Code: BBT302
Branch: Biotechnology (BT)
Unit IV Overview
Understand antigen-antibody reactions and serological assays, then connect MHC presentation, complement and cytokine signalling with immune regulation. Labelled diagrams, actual scientific photographs and solved questions explain both mechanisms and interpretation.
Topics Covered
| Syllabus area | Pages |
|---|---|
| Antigen-antibody interactions | 2-3 |
| Precipitation reactions | 3-5 |
| Serology and ELISA | 5-8 |
| Radioimmunoassay | 8-9 |
| Western blot and interpretation | 9-10 |
| MHC and antigen presentation | 10-12 |
| Complement and cytokines | 12-15 |
| Immune tolerance | 15-16 |
| Solved problems and revision | 16-19 |
Learning Outcomes
- Explain antigen-antibody binding and precipitation.
- Compare ELISA, RIA and Western-blot readouts.
- Trace MHC I and II processing routes.
- Connect complement and cytokines to their effects.
- Distinguish central and peripheral tolerance.
Included in These Notes
35 explained sections; 26 labelled illustrations and plots; 10 actual photographs; 10 solved problems; comparison tables; answered revision questions and a formula sheet.
Study Approach
Define the binding event. State whether the sample target is antigen or antibody.
Read the signal correctly. Distinguish direct and inverse responses; check controls before interpreting.
Trace the location. Follow antigen from its source through processing to MHC display.
Connect the branches. Link complement and cytokine effects with regulation and tolerance.
Key distinctions: binding is not the same as a measured signal; presentation is not automatically priming; a negative result requires valid controls. Interpret each observation within the stated assay or immune context.
1. Unit IV framework: binding, detection and immune regulation
Antigen-antibody binding connects molecular recognition with visible reactions and laboratory signals. The same general recognition principle supports precipitation, ELISA, radioimmunoassay and immunoblotting, but the captured target and measured output differ.
The second part of this unit explains how MHC molecules display peptides, how endogenous and exogenous material reaches those molecules, and how complement and cytokines coordinate effectors. Immune tolerance limits inappropriate responses. Study rule: name the recognised structure, binding molecule, detection system and interpretation separately. A visible signal is not automatically a clinical diagnosis, and molecular recognition does not by itself prove that a complete immune response has occurred.
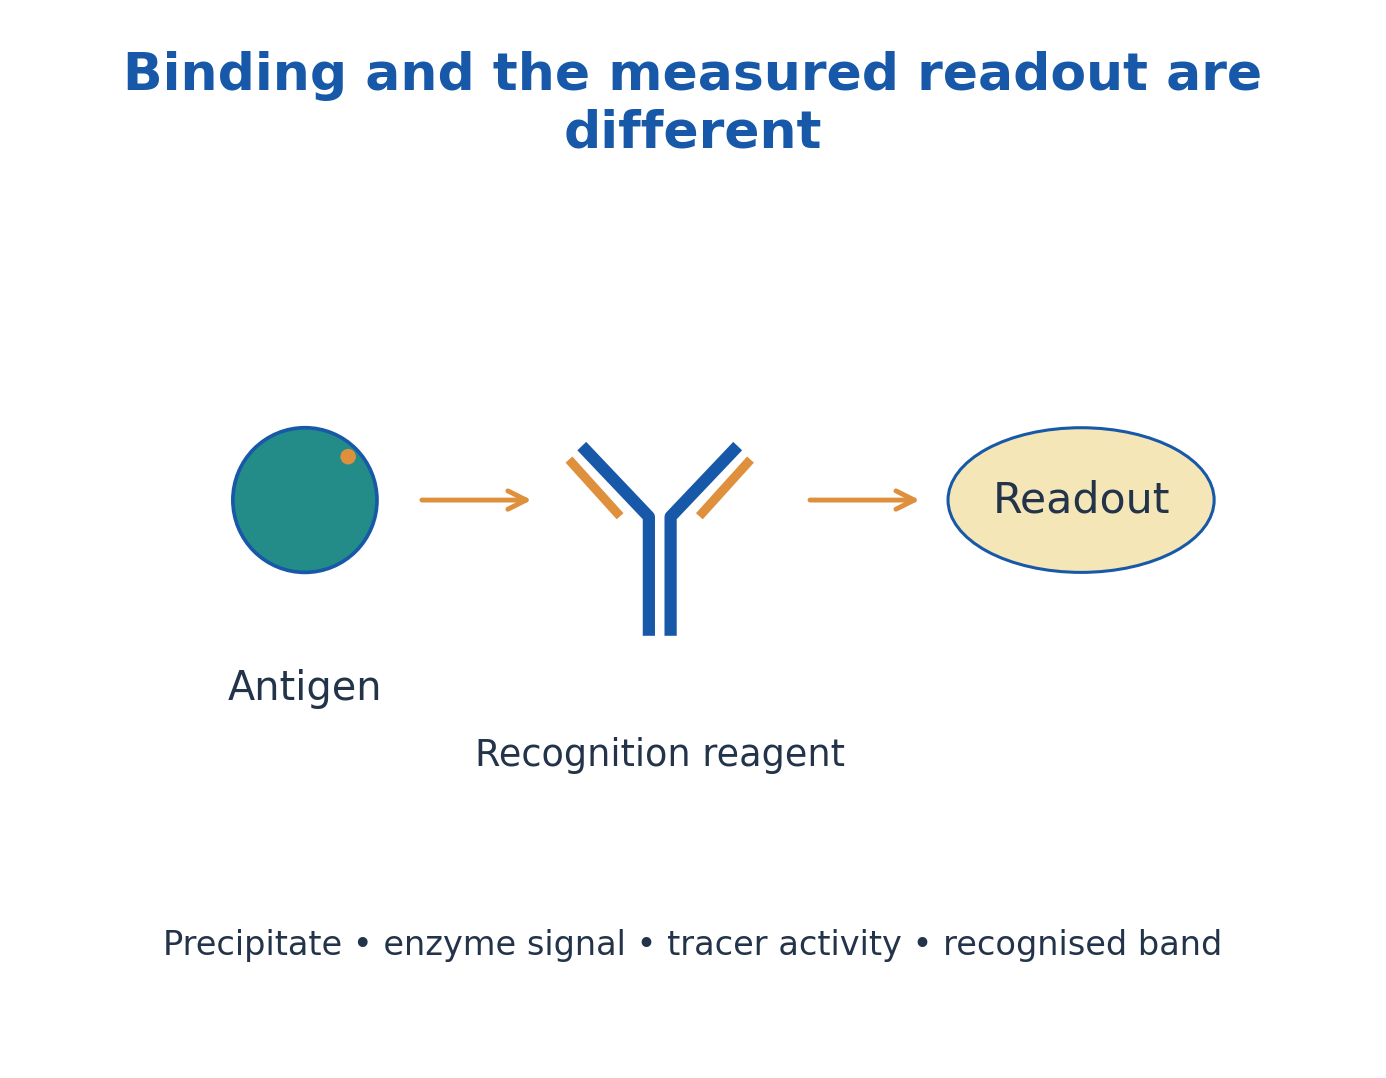
Figure explanation: Antigen binds a recognition reagent, but the measured readout may be a precipitate, enzyme signal, tracer activity or recognised band. Binding and detection are separate stages.
2. Noncovalent binding, affinity, avidity and equilibrium
Antibody paratopes bind complementary epitopes through noncovalent interactions, including hydrogen bonding, electrostatic interactions, hydrophobic effects and van der Waals contacts. Shape, charge and accessibility matter. Binding is reversible rather than a routine covalent joining of antigen and antibody.
Affinity describes one site-epitope interaction; avidity describes the combined strength of multivalent interactions and depends on geometry. In a simple one-site equilibrium, Ka=[AB]/([A][B]) and Kd=[A][B]/[AB]=1/Ka. Lower Kd indicates stronger binding in that model. Real multivalent assays can depart from a one-site interpretation, so an apparent assay strength should not automatically be called an intrinsic single-site affinity.
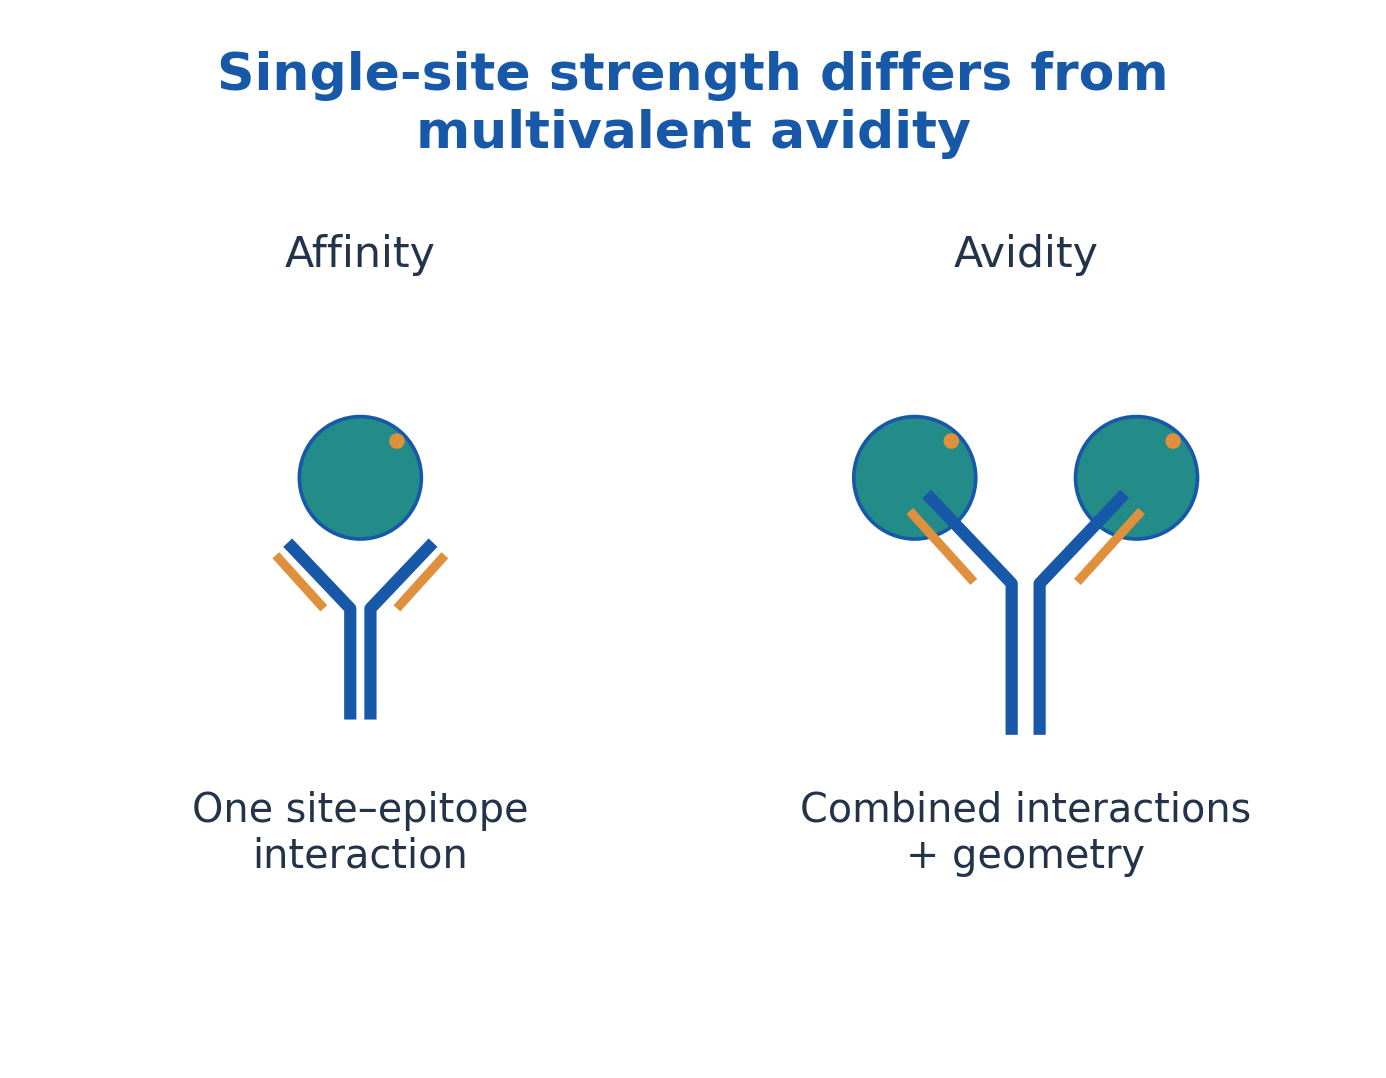
Figure explanation: Affinity describes one binding-site interaction; avidity combines multiple interactions and their geometry. Multivalent binding is therefore not described by a single-site strength alone.
3. Specificity, cross-reactivity and factors affecting reactions
Specificity is selective recognition, not an absolute guarantee that a reagent can never bind a related determinant. Cross-reactivity can arise when another molecule presents sufficiently similar features. Antigen concentration, antibody concentration, valency, pH, ionic conditions and temperature can affect an observed reaction.
Blocking, washing and suitable controls help distinguish specific binding from background in many assay formats. They do not make a poorly characterised reagent perfectly specific. Sample interference, altered epitopes and detection limits can change the result. Distinguish an absent target from a target that is present but poorly recovered or recognised. A negative visible reaction does not necessarily prove absence of binding molecules.
4. Precipitation: how soluble complexes form a lattice
Precipitation occurs when soluble multivalent antigen and suitable antibodies form extended complexes large enough to leave solution or become visibly concentrated. Antibody bridges connect antigenic determinants; valency and accessible epitopes determine whether an extended network can form.
Binding alone is insufficient: small soluble complexes can remain invisible. A monovalent free hapten may bind antibody yet fail to build an extensive lattice. Precipitation differs from agglutination, which visibly clumps particulate material such as cells or coated beads. Both involve recognition and cross-linking, but the initial physical state of the target differs. Do not draw a precipitate as bacterial reproduction or as the automatic consequence of every single binding event.
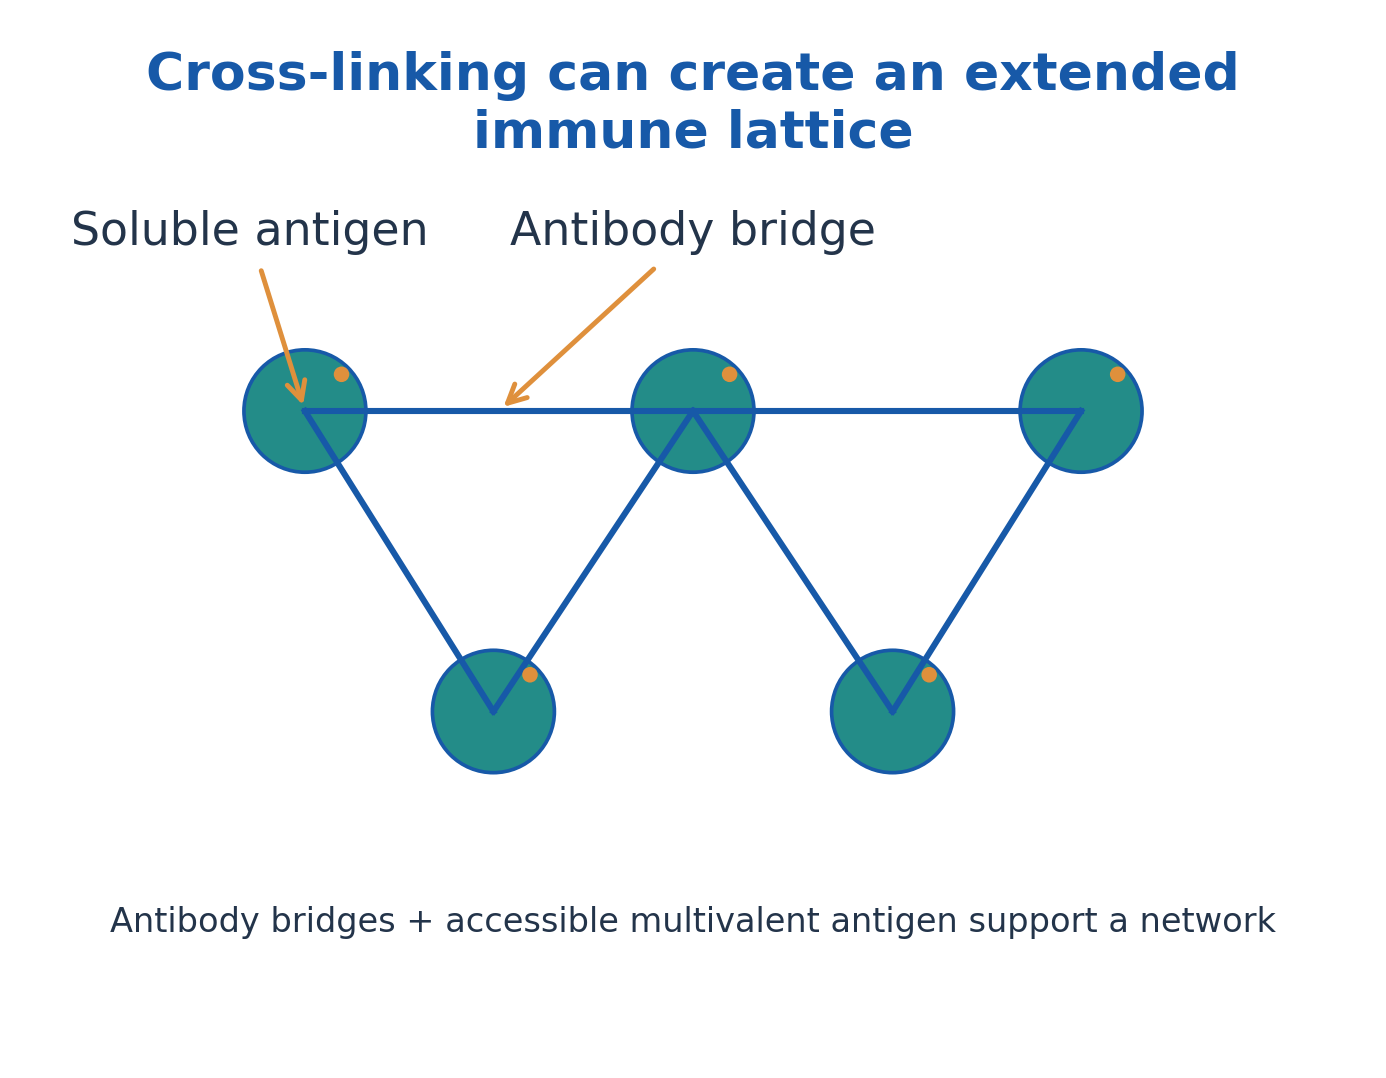
Figure explanation: Antibodies bridge accessible determinants on soluble multivalent antigen to form an extended lattice. The network, rather than an isolated binding event, supports visible precipitation.
5. Equivalence, prozone and postzone
The relative amounts of antigen and antibody influence lattice formation. In antibody excess, the prozone, binding may occur without efficient extended bridging. Near the equivalence region, suitable proportions favour an extensive network and maximum visible precipitation. In antigen excess, the postzone, smaller complexes again reduce visible precipitation.
Equivalence is not necessarily a 1:1 molecular ratio: valency, recognised epitopes and antibody class matter. Excess-related loss of visible reaction is distinct from genuine lack of antigen or antibody. Serial dilution can help investigate an excess effect in an appropriate validated method, but the unit’s diagram is a conceptual relationship rather than a universal dilution or diagnostic instruction.

Figure explanation: The model plot places visible precipitation against increasing antigen at fixed antibody. Visibility is greatest near equivalence and falls in antibody excess or antigen excess.
6. Double immunodiffusion: the Ouchterlony principle
In double immunodiffusion, antigen and antibody diffuse through gel from separate locations. A precipitin line appears where compatible molecules meet in a suitable local concentration relationship. Diffusion and binding together determine line position and appearance.
Several antigen preparations can be compared against an appropriate antiserum. The actual image shows gel-based reaction patterns, while the labelled diagram explains the wells and line. A line supports antigenic recognition in that setup; it is not by itself a complete species identification or quantitative concentration estimate. Different concentrations, mixtures and diffusion properties can alter the pattern, so interpretation requires appropriate comparison materials and controls.
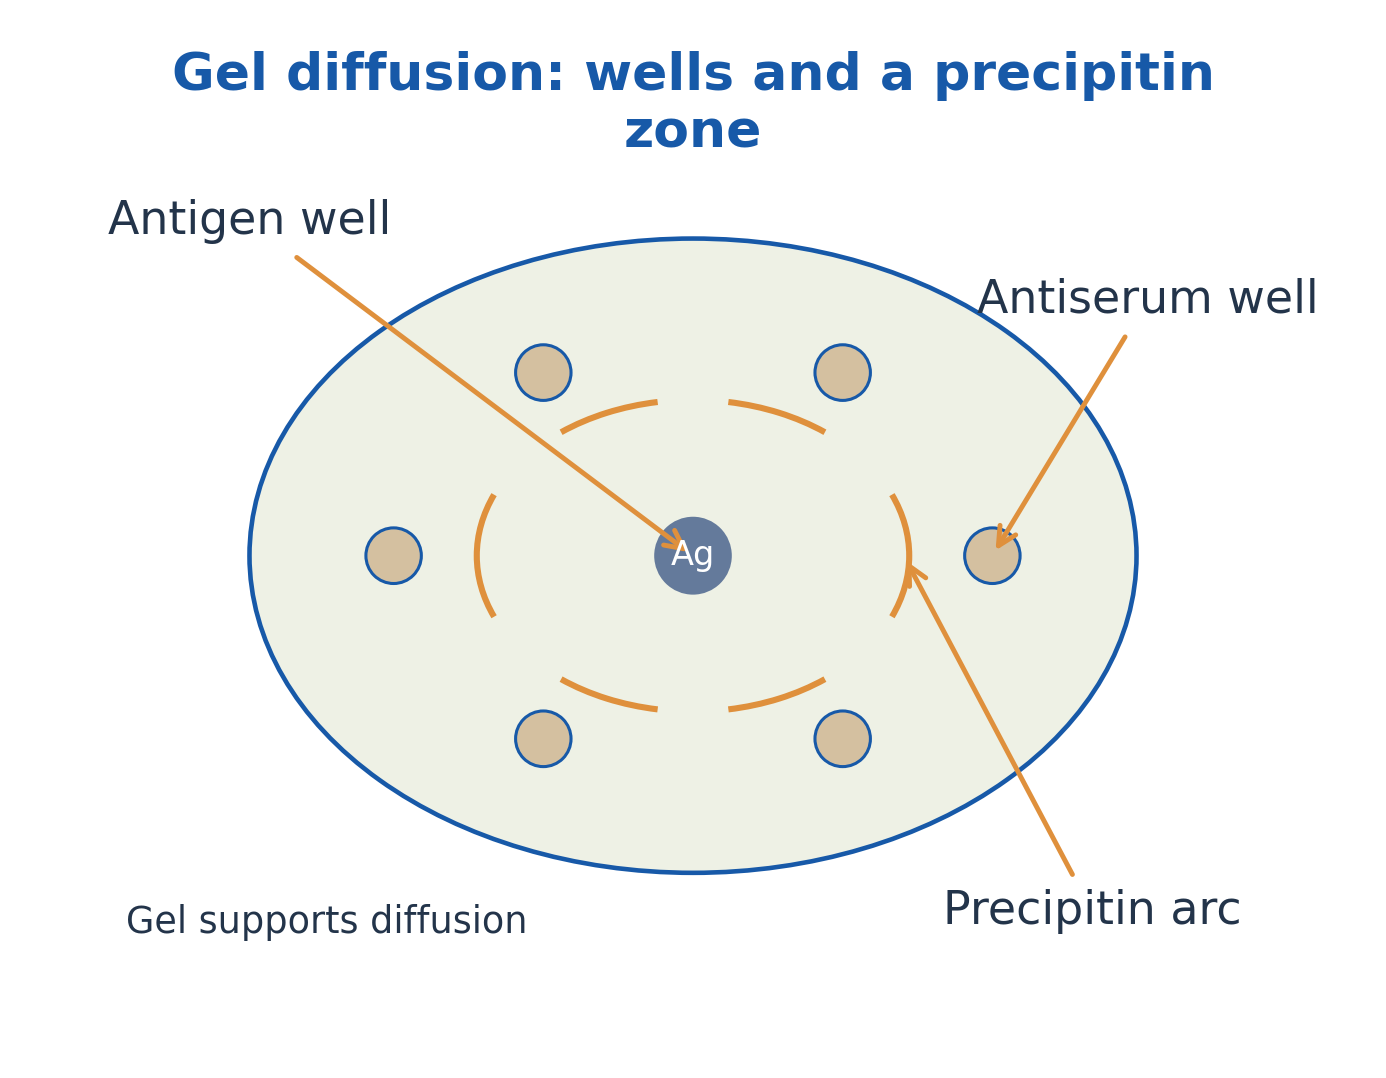
Figure explanation: Antigen and antiserum diffuse from separate wells through gel. A precipitin arc forms where suitable proportions meet; the gel supports diffusion rather than producing specificity.
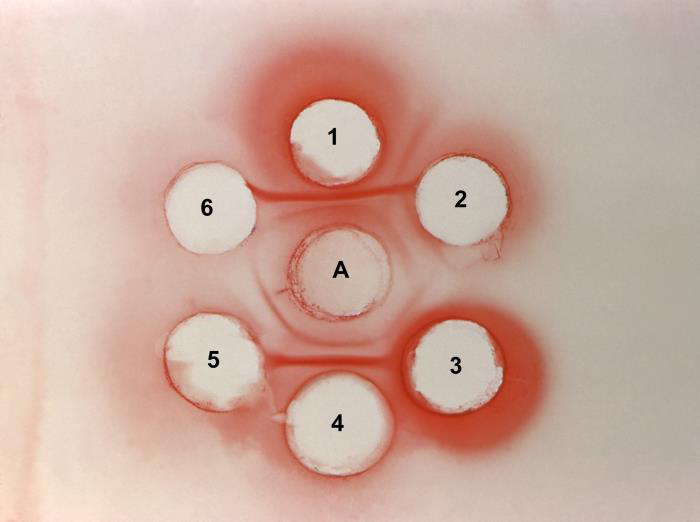
Figure explanation: The actual plate has central antigen, surrounding antisera and visible precipitin arcs. Interpretation depends on the known identity and arrangement of reagents.
7. Identity, nonidentity and partial-identity patterns
In the ideal double-diffusion comparison, lines that merge smoothly indicate recognised antigenic identity in the tested system. Crossing lines indicate recognised nonidentity. A merging line with a spur indicates partial identity: one preparation has additional recognised determinants not represented in the other.
The spur conventionally points toward the antigen preparation lacking those additional recognised determinants. “Identity” means identity with respect to the antiserum and assay, not proof that two molecules are chemically identical in every detail. Concentration differences and complex mixtures can complicate actual plates. Use the idealised patterns to explain relationships, then state the limits of what the experiment demonstrates.
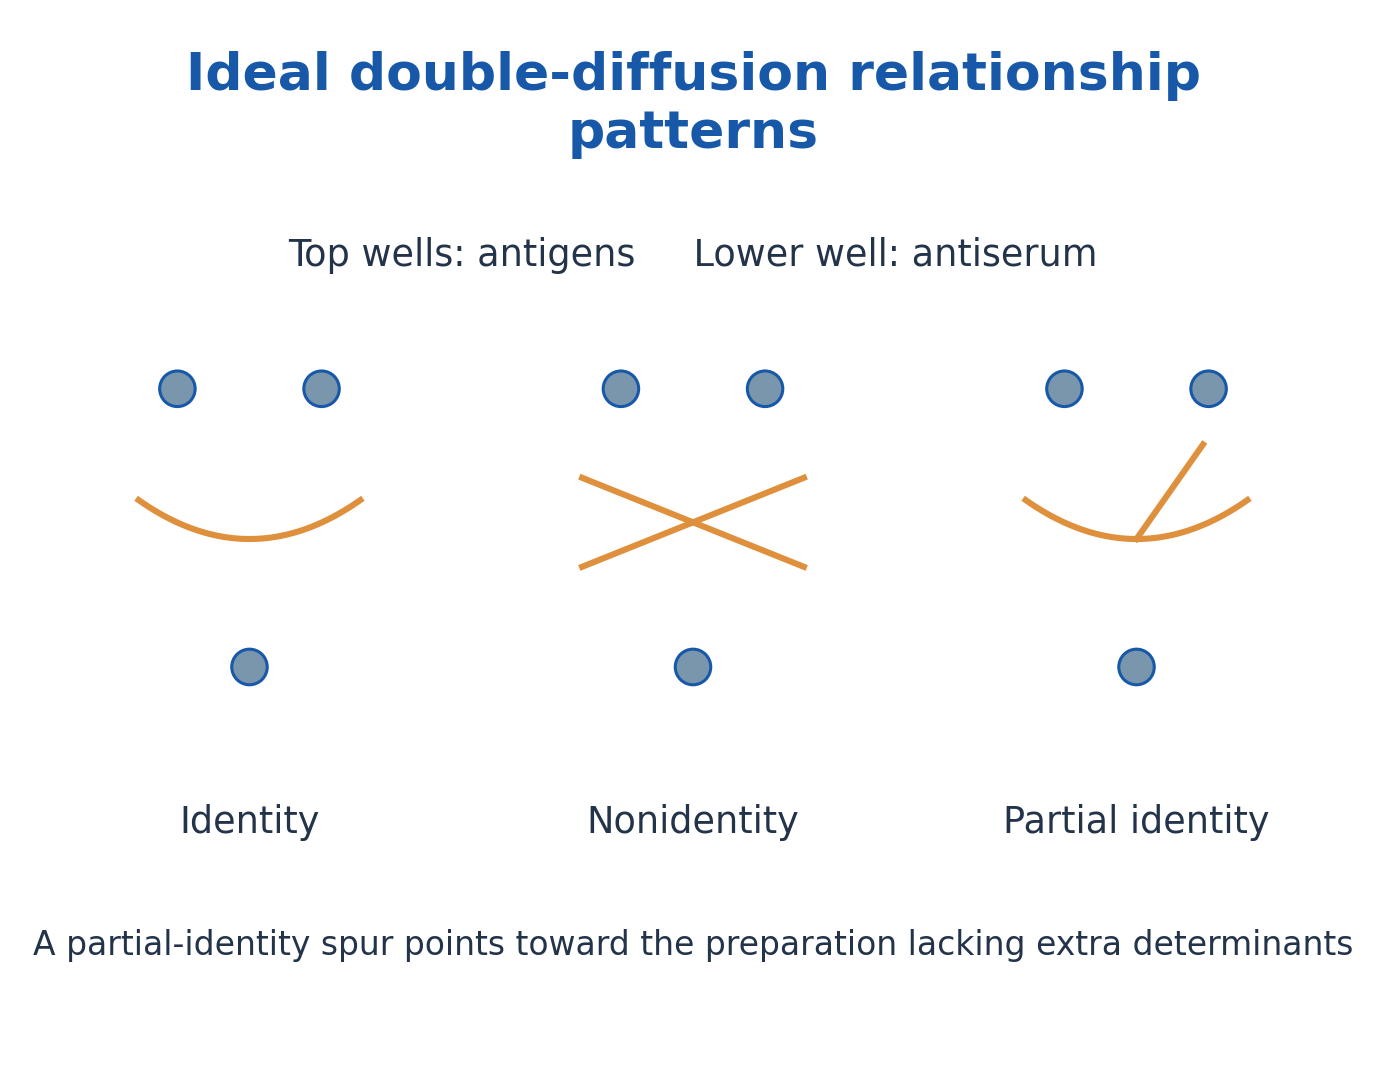
Figure explanation: Identity produces a fused line, nonidentity crossing lines, and partial identity a fused line with a spur. The spur points toward the preparation lacking the extra determinant.

Figure explanation: This archived double-diffusion result contains visible lines around labelled wells. Read these lines against the reagent map rather than assigning a relationship from an isolated arc.
8. Radial diffusion and related precipitation methods
In single radial immunodiffusion, antigen diffuses from a well into gel containing suitable antibody. At an appropriate endpoint and within a validated range, precipitin-ring diameter squared can relate to antigen concentration. Known standards are needed; ring size is not a universal concentration scale.
Immunoelectrophoresis combines electrophoretic separation with subsequent immunodiffusion to resolve complex antigen mixtures. The Elek test is a familiar historical example of gel immunoprecipitation used to demonstrate antigenic material associated with toxin production. The accompanying archived photograph illustrates a reaction pattern, not an operating protocol or proof that all gel lines are interpreted identically. Distinguish qualitative pattern comparison from calibrated quantification.
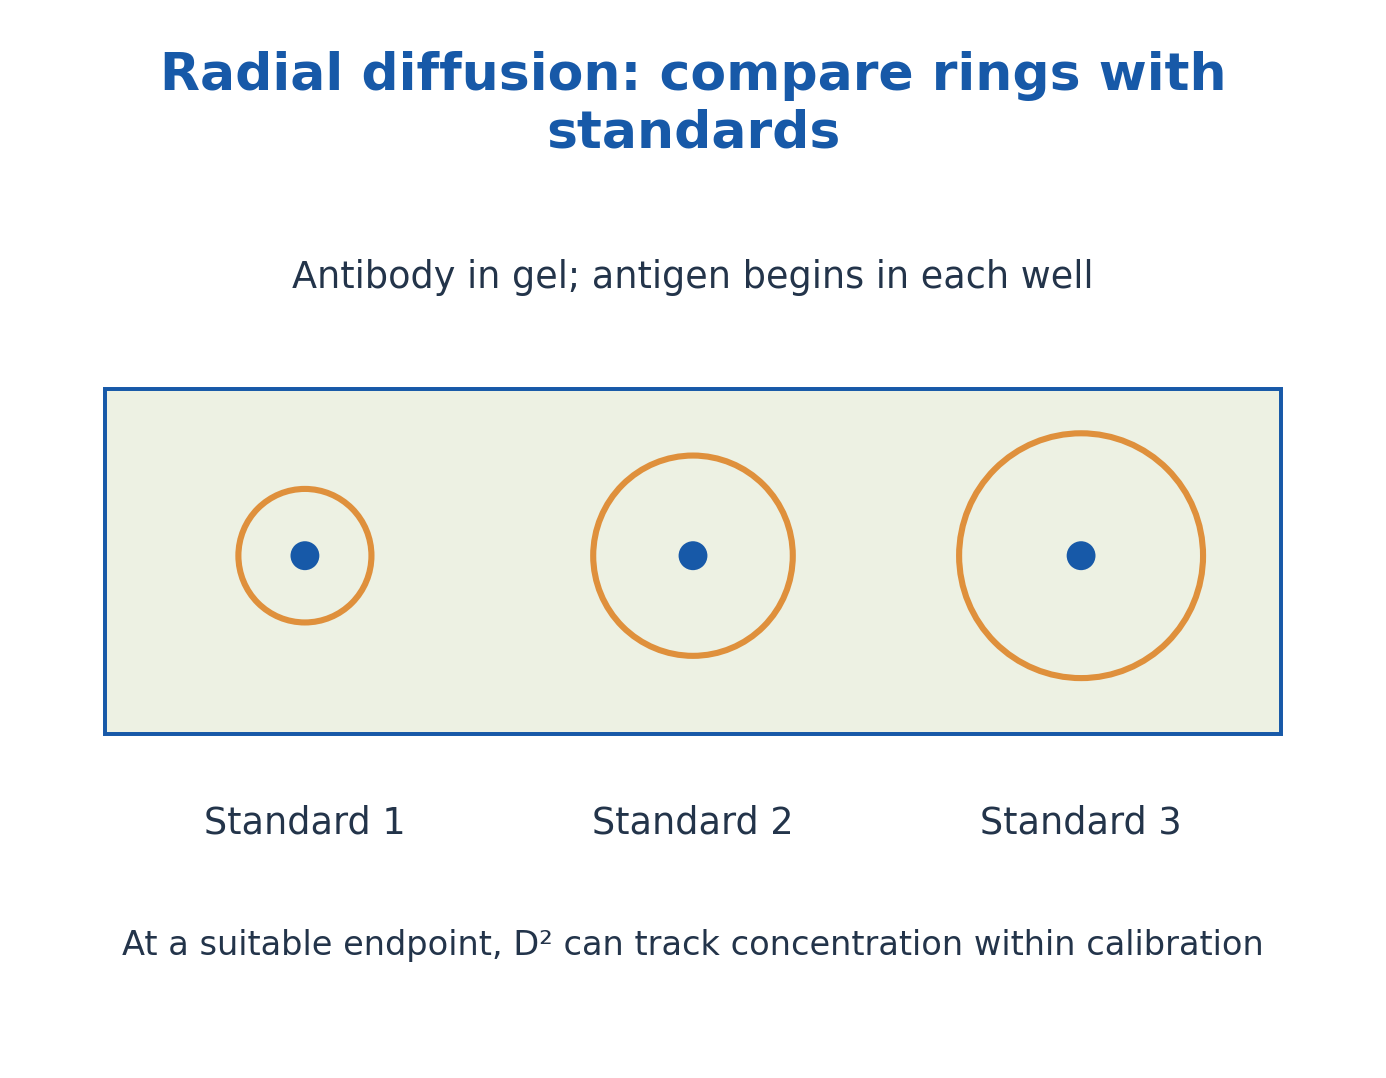
Figure explanation: Antigen diffuses radially from wells into antibody-containing gel. At an appropriate calibrated endpoint, squared ring diameter can track concentration within the valid range.
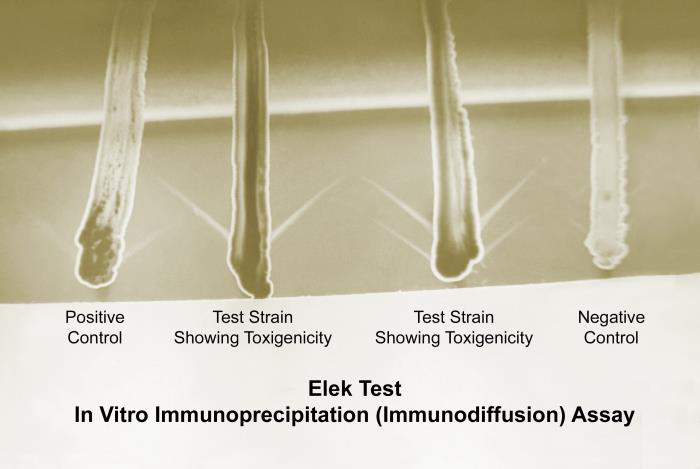
Figure explanation: The Elek-test gel shows immunoprecipitation lines with positive and negative controls. The photograph illustrates a specific application of gel-based antigen–antibody precipitation.

Figure explanation: The archival photograph shows immunoelectrophoresis equipment and result assessment. Separation and immunological recognition contribute different information.
9. Serology: decide whether the target is antigen or antibody
An antigen-detection assay uses characterised binding reagents to look for a target antigen. An antibody-detection assay uses characterised antigen or another suitable capture system to detect the sample’s antibodies. Both may use antibody reagents, so “an antibody is present in the test” does not identify which target is being measured.
Antibodies can persist after an exposure, while a recently exposed individual may not yet have detectable antibody. Antigen detection, antibody detection and direct detection of an organism’s nucleic acid answer different questions. This unit explains assay principles; a disease-specific testing algorithm must not be inferred from a generic diagram or one historical test photograph.
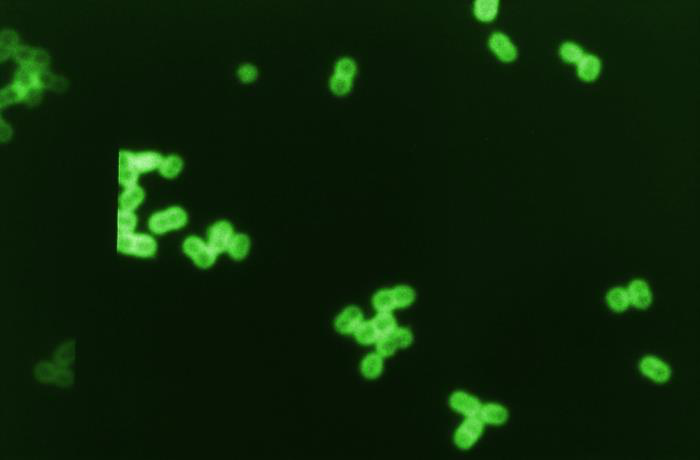
Figure explanation: The fluorescent-antibody micrograph shows a detectable antibody-associated signal. Brightness requires appropriate controls before it can support a quantitative or identity claim.
10. Controls, titres and analytical interpretation
Positive controls show that the expected reaction can be detected; negative controls reveal inappropriate signal; blanks assess specified background contributions. Standards relate signal to known analyte amounts. These functions overlap in practice but are not interchangeable.
An endpoint titre is commonly the reciprocal of the highest sample dilution meeting the method’s positivity criterion. It is not automatically an absolute mass concentration or a protective threshold. Analytical sensitivity, diagnostic sensitivity and specificity describe different properties. Repeatability does not by itself establish accuracy. Unexpected results can reflect sample handling, background, interference, an excess effect or biological timing, so the measured signal and its interpretation must be separated.
11. ELISA: a solid phase and enzyme-linked detection
An enzyme-linked immunosorbent assay uses specific binding on a solid phase, commonly a microplate well, with enzyme-associated detection. Retained enzyme converts an appropriate substrate into a measurable product, often a colour signal. Other enzyme-detection chemistries also exist.
Capture or coating, target recognition, separation of unbound material and signal generation have different roles. The enzyme may be linked through a primary antibody, secondary reagent or another detection arrangement. A darker well is not automatically “more patient antibody”: the signal direction and target depend on the assay architecture. The photographs show actual laboratory equipment and use; the diagrams show conceptual molecular relationships.
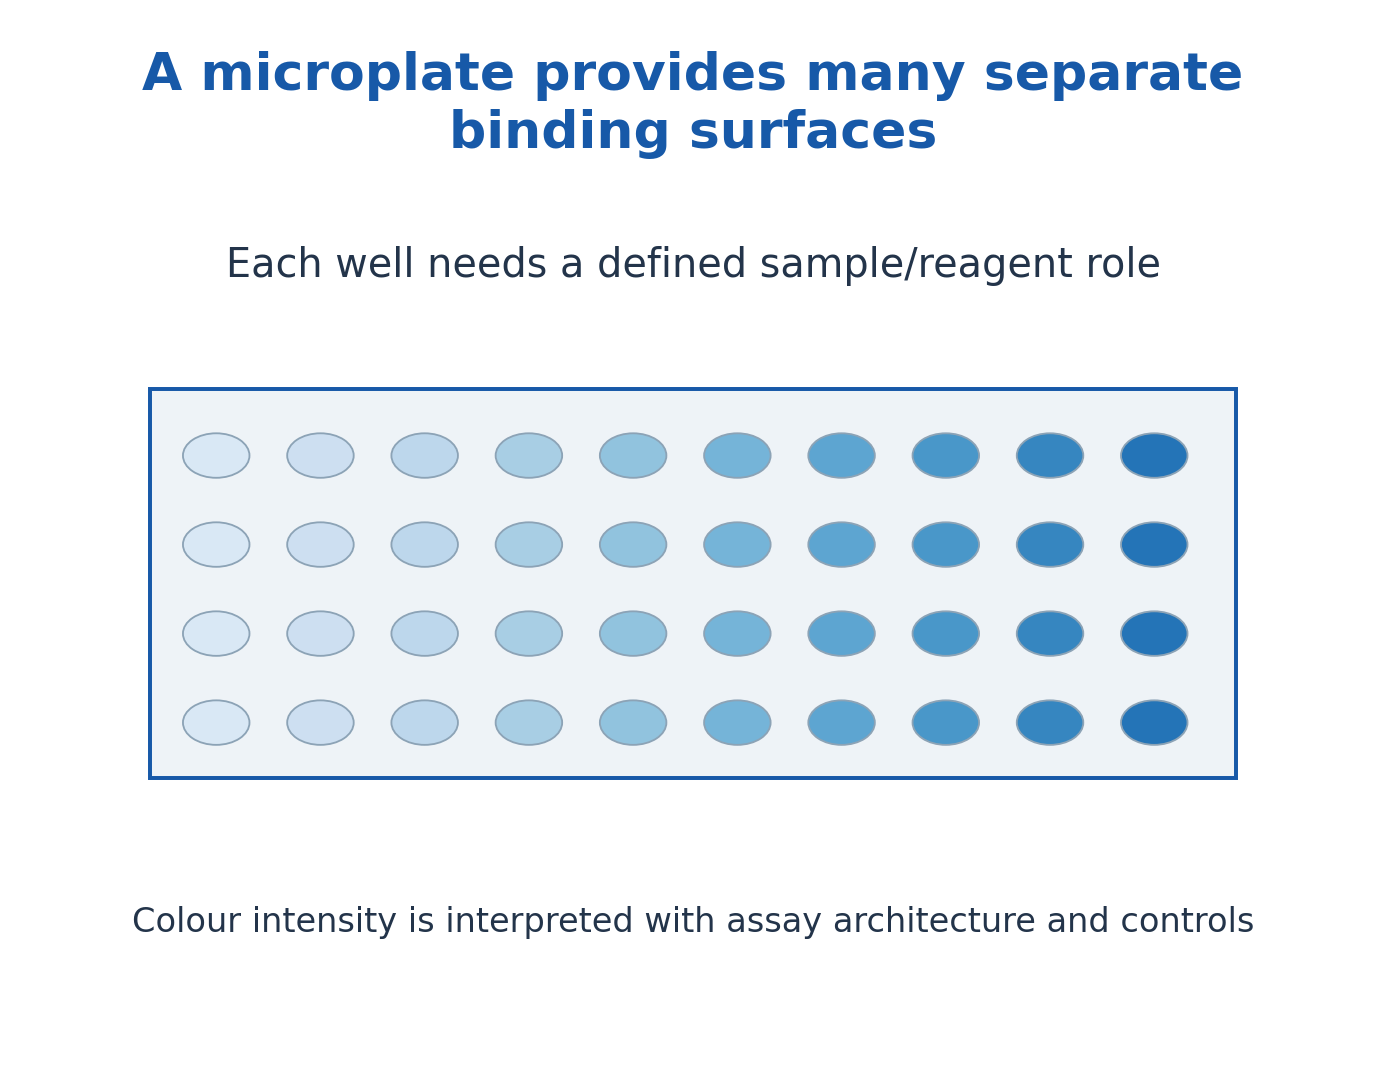
Figure explanation: A microplate provides separate solid-phase binding surfaces. Each well needs an assigned sample/reagent role, and colour must be interpreted using the assay architecture and controls.

Figure explanation: The laboratory photograph shows serum dispensing into microplate wells. The handling image does not itself reveal the sample result.
12. Direct and indirect ELISA architectures
In a common direct antigen-detection model, immobilised antigen is recognised by an enzyme-labelled primary antibody. In a common indirect antibody-detection model, known immobilised antigen captures sample antibody, which is then recognised by an enzyme-associated anti-immunoglobulin reagent.
Indirect detection can amplify signal and supports antibody measurements, but secondary-reagent specificity and background matter. Terminology varies between assay descriptions, so identify what coats the surface, what the sample contributes and what the labelled detector binds. Direct and indirect describe a detection arrangement; they do not universally mean that one method is always quantitative, more sensitive or clinically superior.
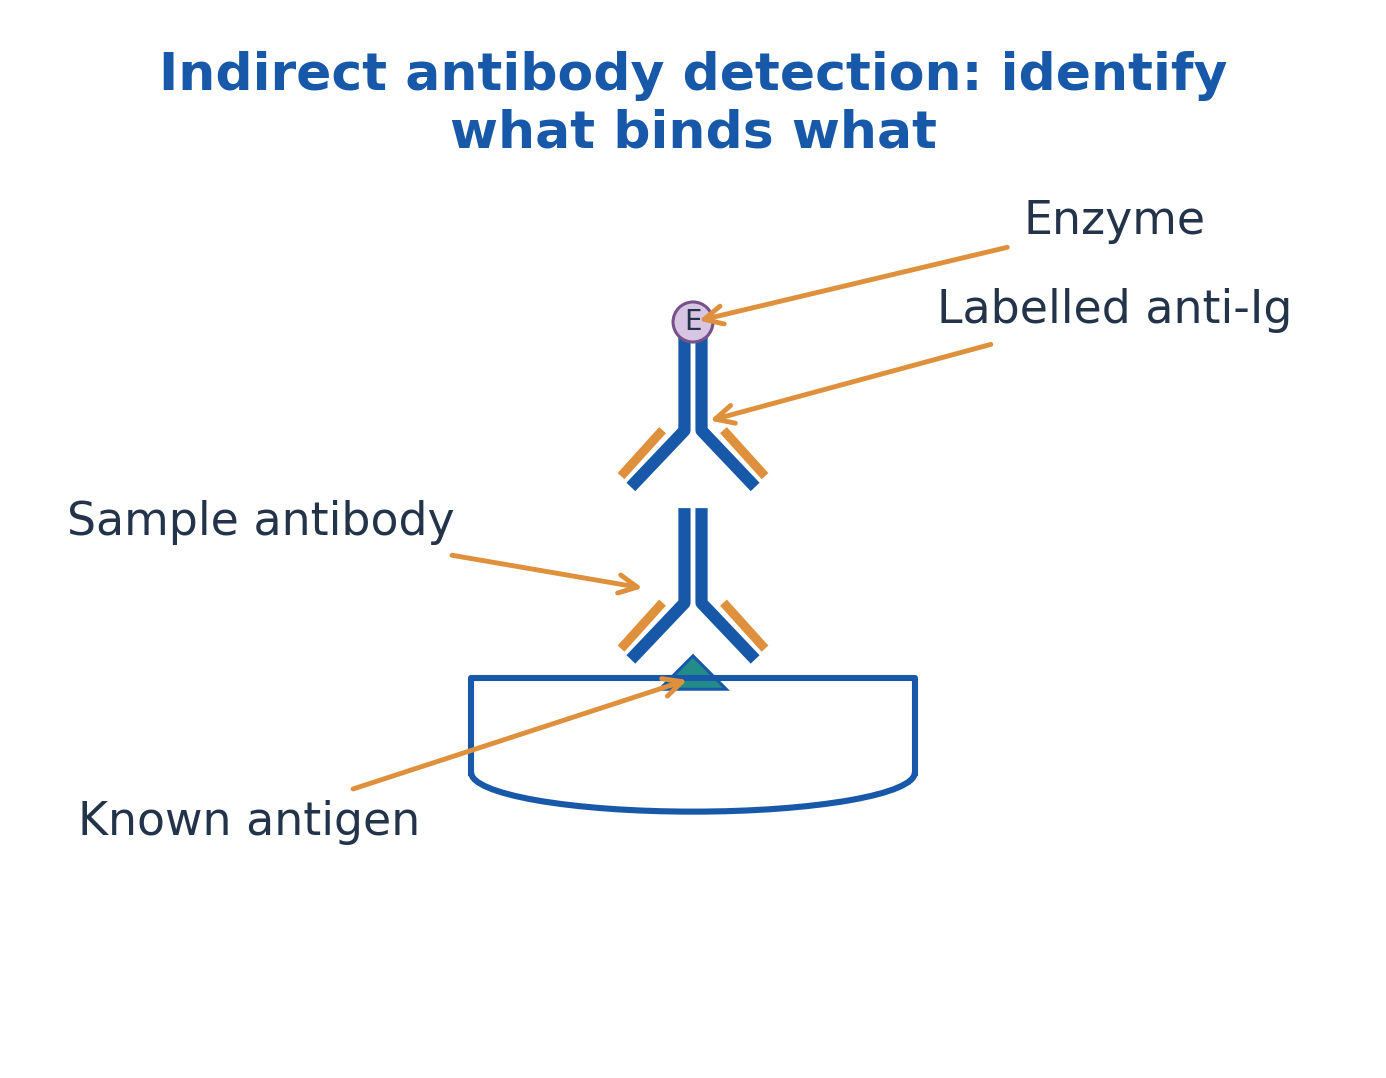
Figure explanation: In the indirect antibody model, sample antibody binds known antigen and labelled anti-immunoglobulin binds that sample antibody. The enzyme label identifies the detection reagent.
| Arrangement used here | Sample-related target | Detector |
|---|---|---|
| Direct antigen model | Antigen immobilised on surface | Enzyme-associated primary antibody |
| Indirect antibody model | Sample antibody binding a known antigen | Enzyme-associated anti-immunoglobulin reagent |
13. Sandwich ELISA: two compatible recognition events
In the sandwich model, an immobilised capture antibody binds target antigen. A detection antibody recognises an accessible additional determinant, and an enzyme-linked system reports retained detection reagent. The antigen lies between two compatible binding reagents.
The antibodies must bind without mutually preventing the required interaction. The sample and standards must be suitable for the method, and the signal must remain within the validated range. Two binding events can improve selectivity, but they do not eliminate all cross-reactivity or matrix effects. A high-dose hook effect can cause misleadingly low signal in susceptible sandwich systems; this is a design-dependent limitation, not a rule for every ELISA.

Figure explanation: Capture and detector antibodies bind mutually accessible sites on the target antigen. A sandwich requires compatible recognition events rather than two antibodies competing for the same inaccessible site.

Figure explanation: The actual research photograph illustrates ELISA-associated antigen-detection work. A quantitative conclusion still requires the defined assay, standards and controls.
14. Competitive ELISA and the direction of the signal
Competitive formats use competition for a limited binding interaction. In one familiar design, sample antigen competes with a labelled or surface-associated reference for antibody recognition. More sample antigen can reduce the retained detector-related signal.
The direction depends on what is being measured: bound label, free label or another inhibited interaction. A low signal can therefore correspond to a high analyte concentration in a defined competitive assay, but this should not be generalised to all enzyme assays. State the competitors and the measured fraction. The diagram is a teaching model of competition rather than a full reagent sequence.
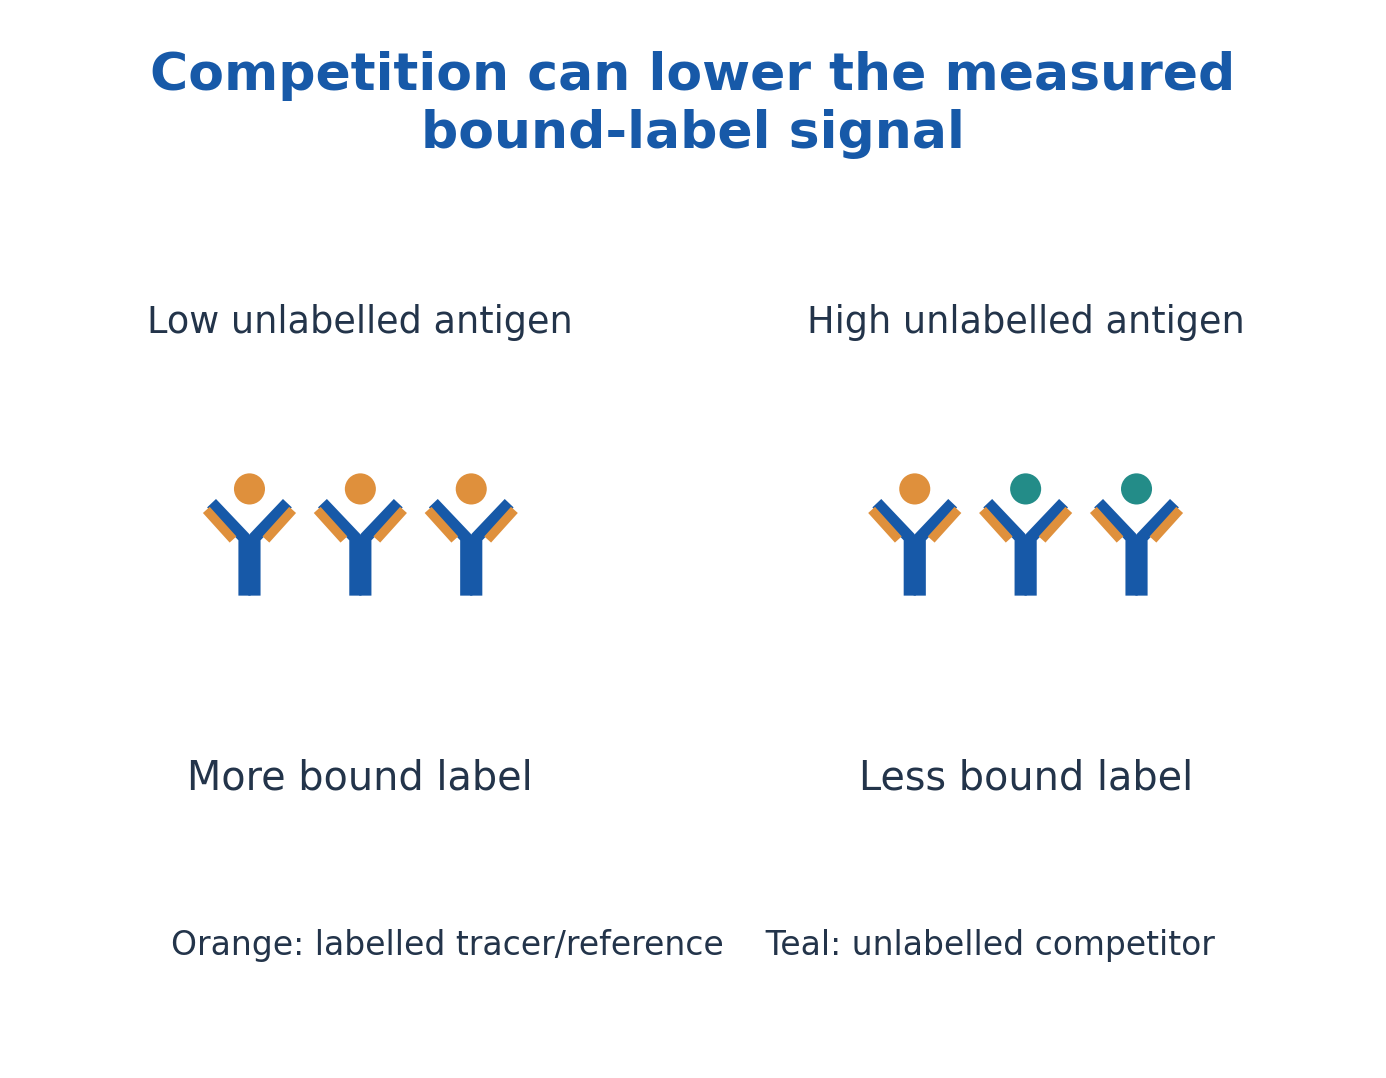
Figure explanation: At fixed binding capacity, increasing unlabelled competitor reduces the bound labelled fraction in this competitive model. Signal direction depends on which fraction is measured.
15. Calibration curves, dilution correction and assay limits
A standard curve relates known analyte concentrations to measured signal. Immunoassay curves may be nonlinear and require an appropriate fitted model; simple interpolation is justified only where the stated calibration supports it. Samples outside the working range should not be interpreted by unlimited straight-line extrapolation.
A prior sample dilution must be included when reporting original-sample concentration. Blanks, replicates and suitable controls reveal different sources of uncertainty. Saturation, a hook effect, interfering antibodies and matrix differences can distort apparently plausible values. A numerical concentration should state units and the measurement basis; a colour photograph of wells cannot supply a reliable concentration without its calibration and assay context.
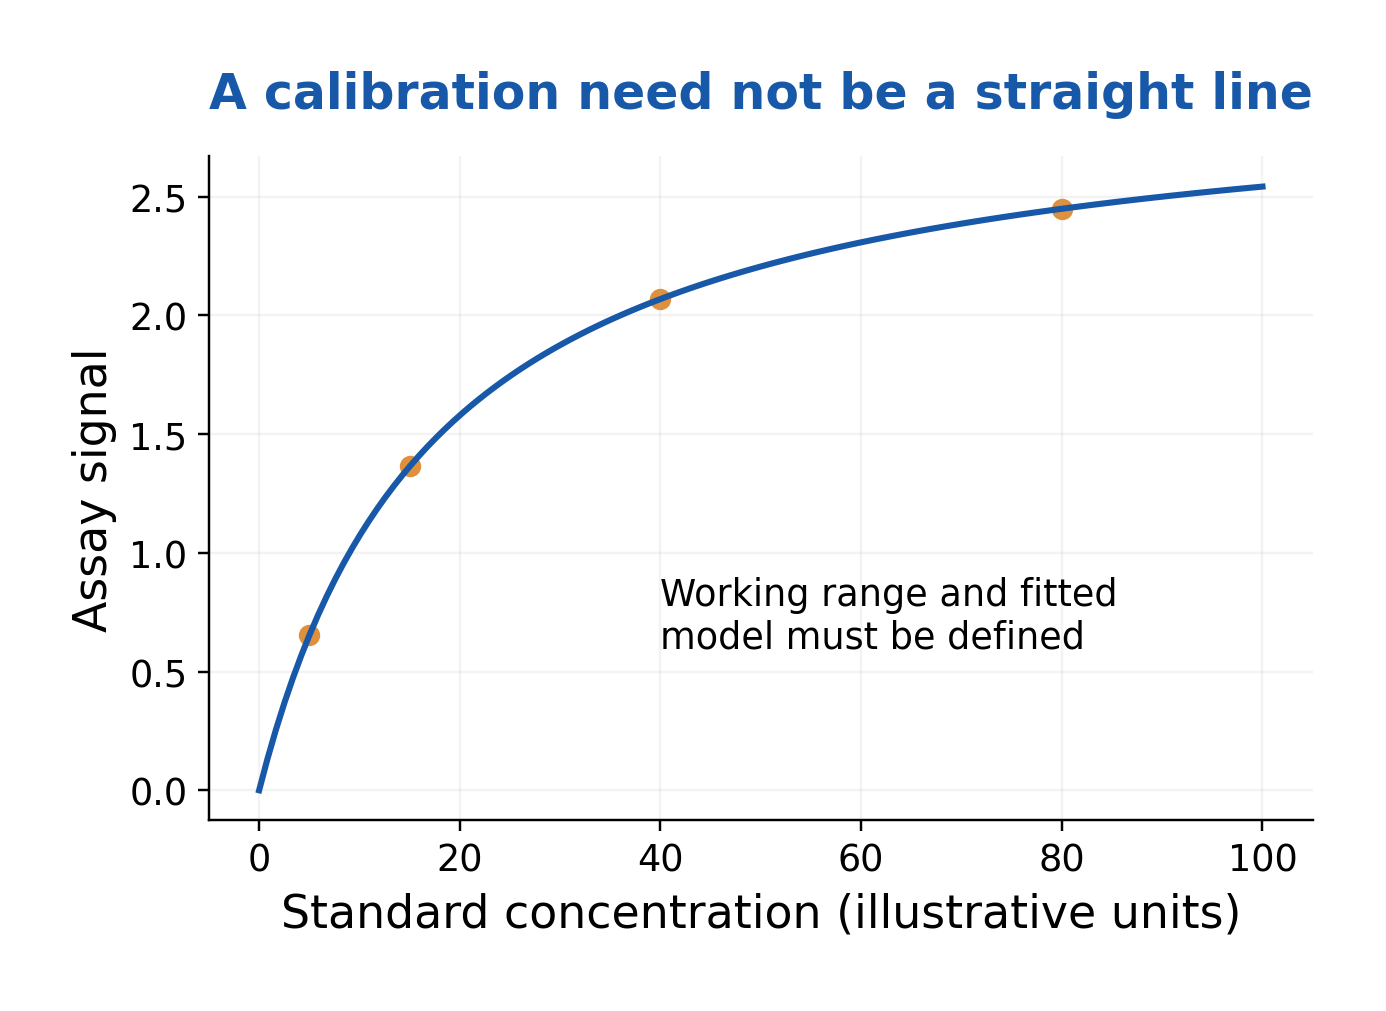
Figure explanation: The illustrative calibration curve is nonlinear and approaches a plateau. The working range and fitted model must be defined before converting signal to concentration.
16. Radioimmunoassay: traditional competitive binding
Traditional competitive RIA uses a radioactive tracer antigen and unlabelled sample antigen competing for a limited amount of specific antibody. Bound and free tracer are distinguished by the assay’s separation system, and radioactivity is measured in a defined fraction.
When bound tracer is the readout, increased unlabelled analyte commonly reduces bound radioactivity. A calibration curve converts that relationship into an estimate. This describes conventional competitive RIA, not every radiolabelled immunoassay: noncompetitive immunoradiometric arrangements can behave differently. Tracer decay, reagent quality and separation affect performance. Radioactivity provides a detection label; it does not make antibody binding uniquely covalent or automatically more specific.
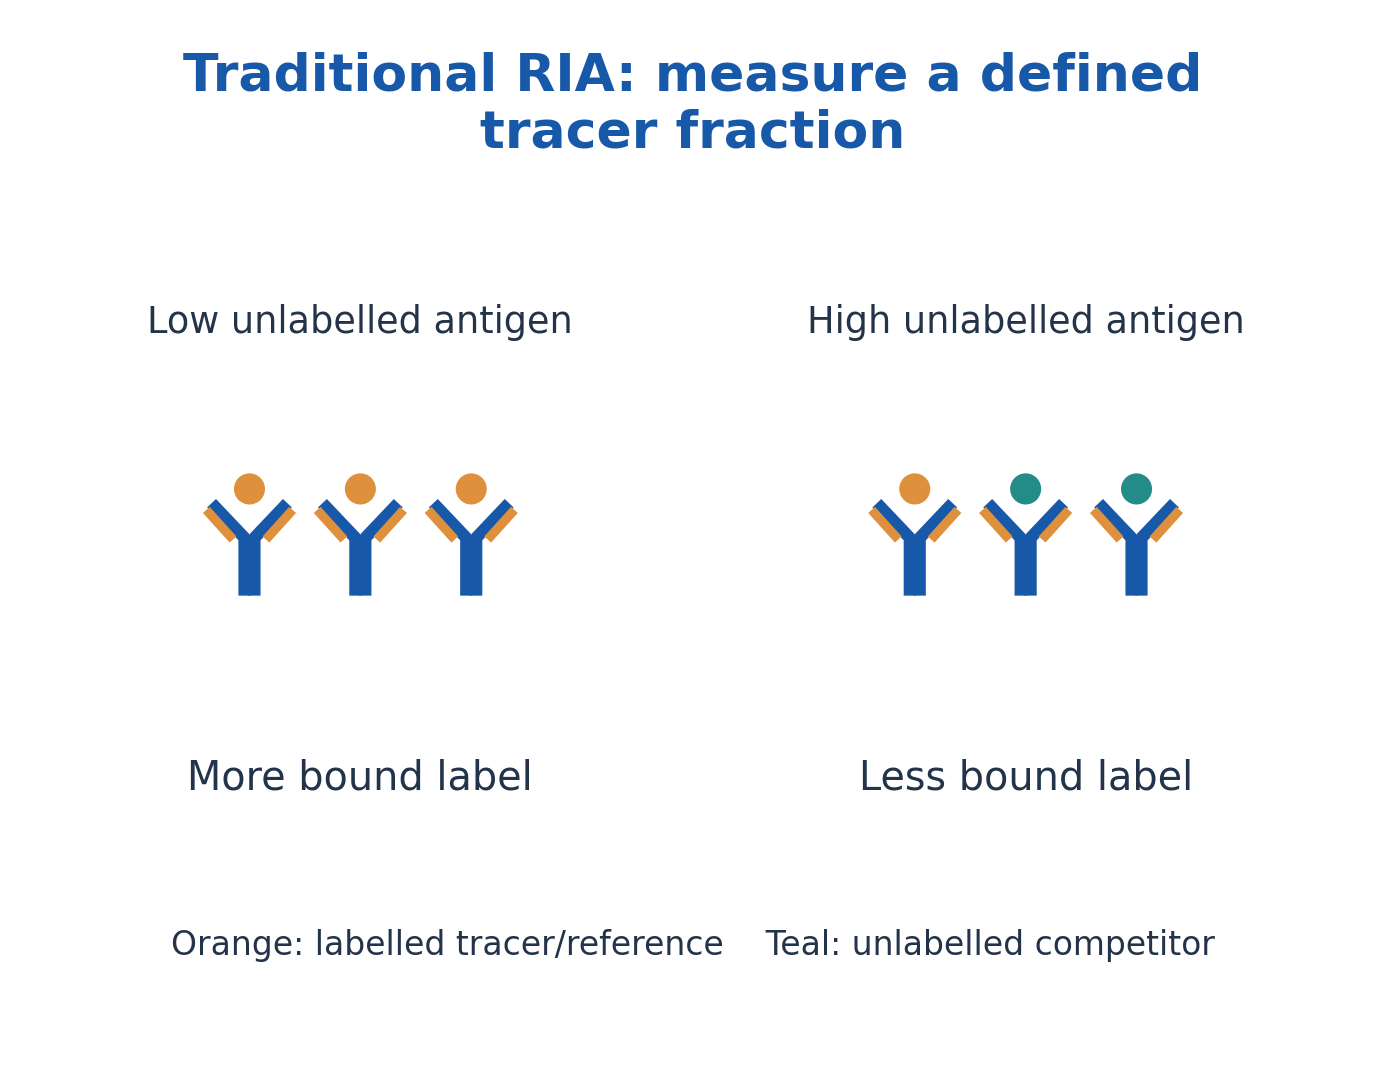
Figure explanation: Traditional competitive RIA compares a defined tracer fraction as unlabelled antigen competes for binding. More unlabelled antigen commonly means less bound label, not necessarily less total radioactivity.
17. Comparing ELISA, RIA and related detection choices
ELISA and RIA share specific binding but differ in the detection label and associated measurement system. Enzyme detection can produce optical signals; traditional RIA measures radiolabel-associated activity. Performance depends on the whole method, including sample matrix, calibration and reagent quality.
Radioactive reagents bring decay, measurement and controlled-handling requirements. Enzyme reagents also have stability, background and dynamic-range limitations. Neither label alone guarantees clinical accuracy. Competitive versus noncompetitive is a separate classification from enzyme versus radioactive label. Choose an interpretation by the actual architecture, rather than memorising that every immunoassay signal rises with analyte concentration.
| Feature | Enzyme-based ELISA | Traditional competitive RIA |
|---|---|---|
| Measured label | Enzyme-generated product | Radioactive tracer in a specified fraction |
| Typical instrument | Suitable optical reader | Appropriate radiation-counting system |
| Signal direction | Format-dependent | Bound tracer commonly decreases with analyte |
| Shared requirement | Specific reagents, controls and calibration | Specific reagents, controls and calibration |
18. Western blot: separate proteins and transfer them
A Western blot identifies antibody-recognised proteins after electrophoretic separation and transfer to a membrane. In the common SDS-PAGE model, denatured proteins separate mainly by apparent molecular size, then are transferred while preserving their relative distribution.
The membrane supports immunodetection. A protein-size marker, transfer assessment and suitable controls serve distinct purposes. Apparent molecular mass is not a complete identity test: different proteins can migrate similarly, and modifications or preparation can alter migration. Denaturation may destroy conformational epitopes. The protein-separation step distinguishes Western blotting from a simple microplate binding assay; it is not a method for routinely separating antibodies according to their antigen specificity.
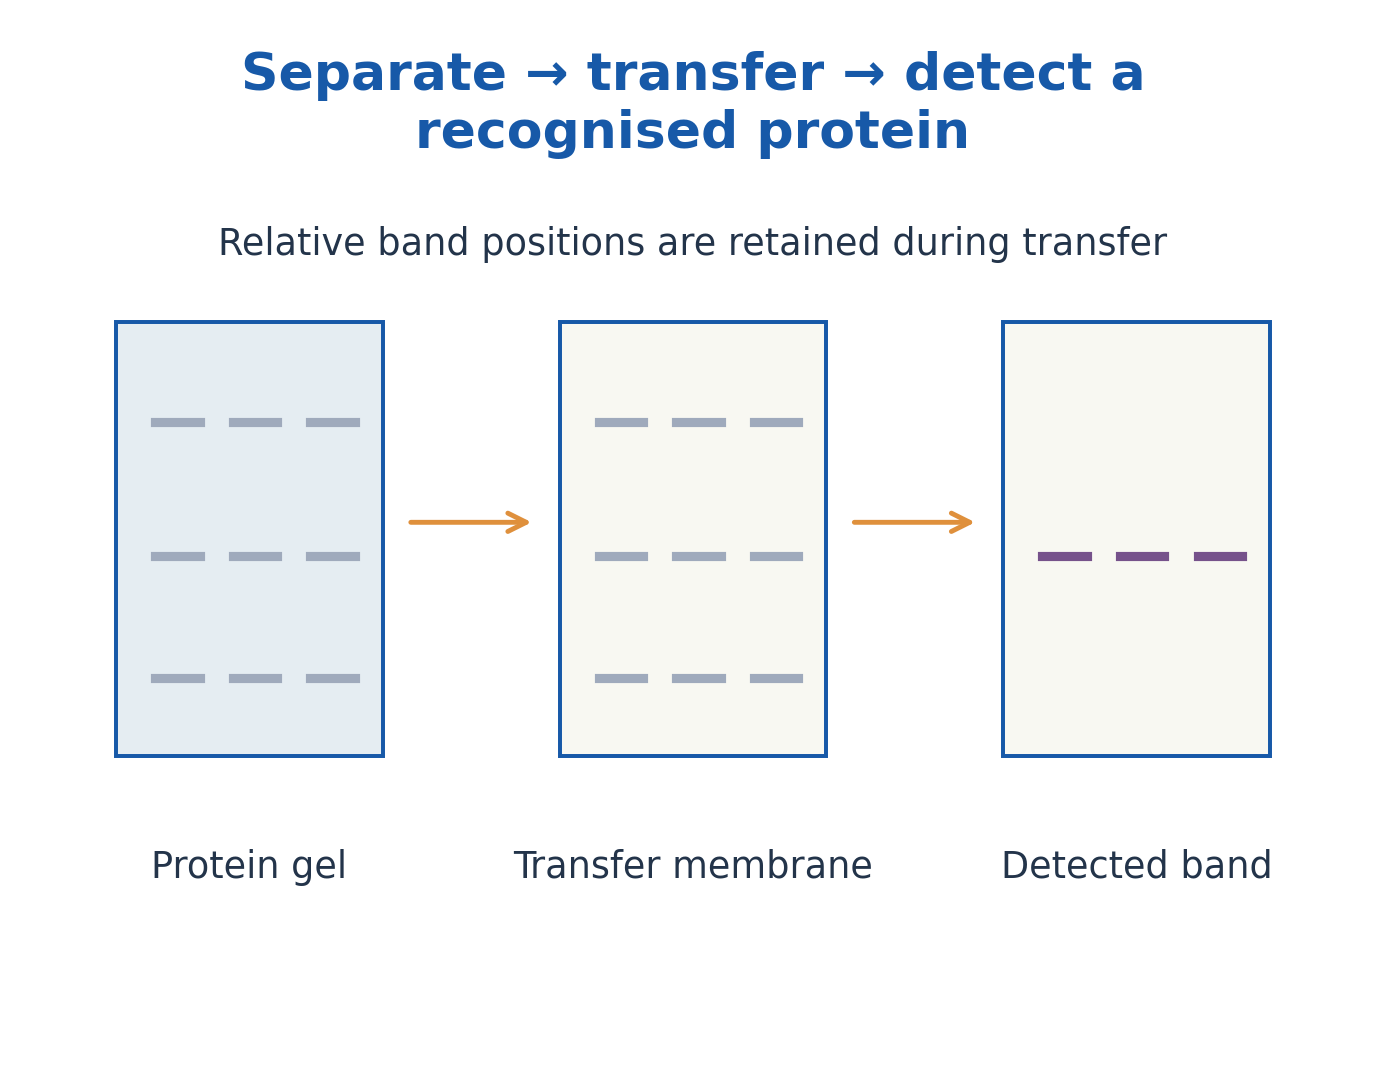
Figure explanation: Proteins are separated in a gel, transferred to a membrane and detected as recognised bands. Relative band positions are retained during transfer; recognition adds specificity to separation.
19. Western-blot probing, bands and valid comparisons
An appropriate primary antibody recognises a target on the membrane; a labelled primary or secondary system produces a visible or measurable signal. Blocking and separation of unbound detector reduce background but cannot substitute for specific reagents. The archived photograph shows a strip in a test tray, not a universal interpretation key.
A band at an expected position supports a result only alongside suitable controls. Loading controls or total-protein assessment help evaluate comparisons, but must themselves be appropriate. Saturated detection can invalidate intensity comparisons. In some serological blots, known antigens are probed with sample antibodies; that differs from directly measuring a target protein’s abundance. Western blot is not a mandatory final diagnostic test for every infection.

Figure explanation: The photograph shows a Western-blot strip being placed in a test tray. A strip image needs controls and defined band interpretation before a sample conclusion is drawn.
20. Comparing assay outputs and diagnostic performance
Precipitation reports lattice formation; ELISA reports an enzyme-linked signal; RIA reports radiolabel-associated activity; Western blot provides a band pattern after separation. These outputs cannot be read as identical evidence. A sample can show binding in one format but fail in another because epitopes and conditions differ.
Diagnostic sensitivity=TP/(TP+FN), specificity=TN/(TN+FP), and positive predictive value=TP/(TP+FP). Predictive value depends on the tested population as well as assay performance. The worked examples use hypothetical data to teach definitions, not disease-specific cut-offs. Consistent repeated measurements do not automatically establish either target identity or clinical meaning.
| Technique | Core observation | Key interpretive limit |
|---|---|---|
| Precipitation | Visible lattice or line | Ratio and valency affect visibility |
| ELISA | Enzyme-associated signal | Architecture and calibration define meaning |
| RIA | Tracer activity | Specify bound or free fraction |
| Western blot | Recognised bands | Controls, transfer and epitope state matter |
21. MHC and HLA: genes, expression and function
The major histocompatibility complex is a genomic region containing important immune-related genes. In humans, the classical antigen-presenting molecules are called HLA molecules. Class I loci include HLA-A, -B and -C; class II includes HLA-DP, -DQ and -DR.
MHC systems are polygenic and highly polymorphic, with codominant expression of inherited variants. They display selected peptides for T-cell recognition, not merely a label saying “foreign present”. Normal self-derived peptides are also displayed. Class III region genes include other immune functions; they do not define a third equivalent class of peptide-presenting surface molecule. Expression and peptide binding vary with cell type, activation state and allele.
22. MHC class I: structure and recognition
A conventional class I molecule contains a membrane-spanning α heavy chain associated with β2-microglobulin, which does not itself span the membrane. The α1 and α2 domains form the peptide-binding groove; α3 contributes a membrane-proximal region involved in the usual CD8 interaction.
Class I is expressed on most nucleated cells and displays peptides to conventional CD8 T cells. Mature erythrocytes do not follow this nucleated-cell model. The groove’s closed ends commonly accommodate short peptides, often around 8-10 residues, with allele-dependent preferences. The diagram separates the heavy chain from β2-microglobulin; the latter is not a second transmembrane class I chain.
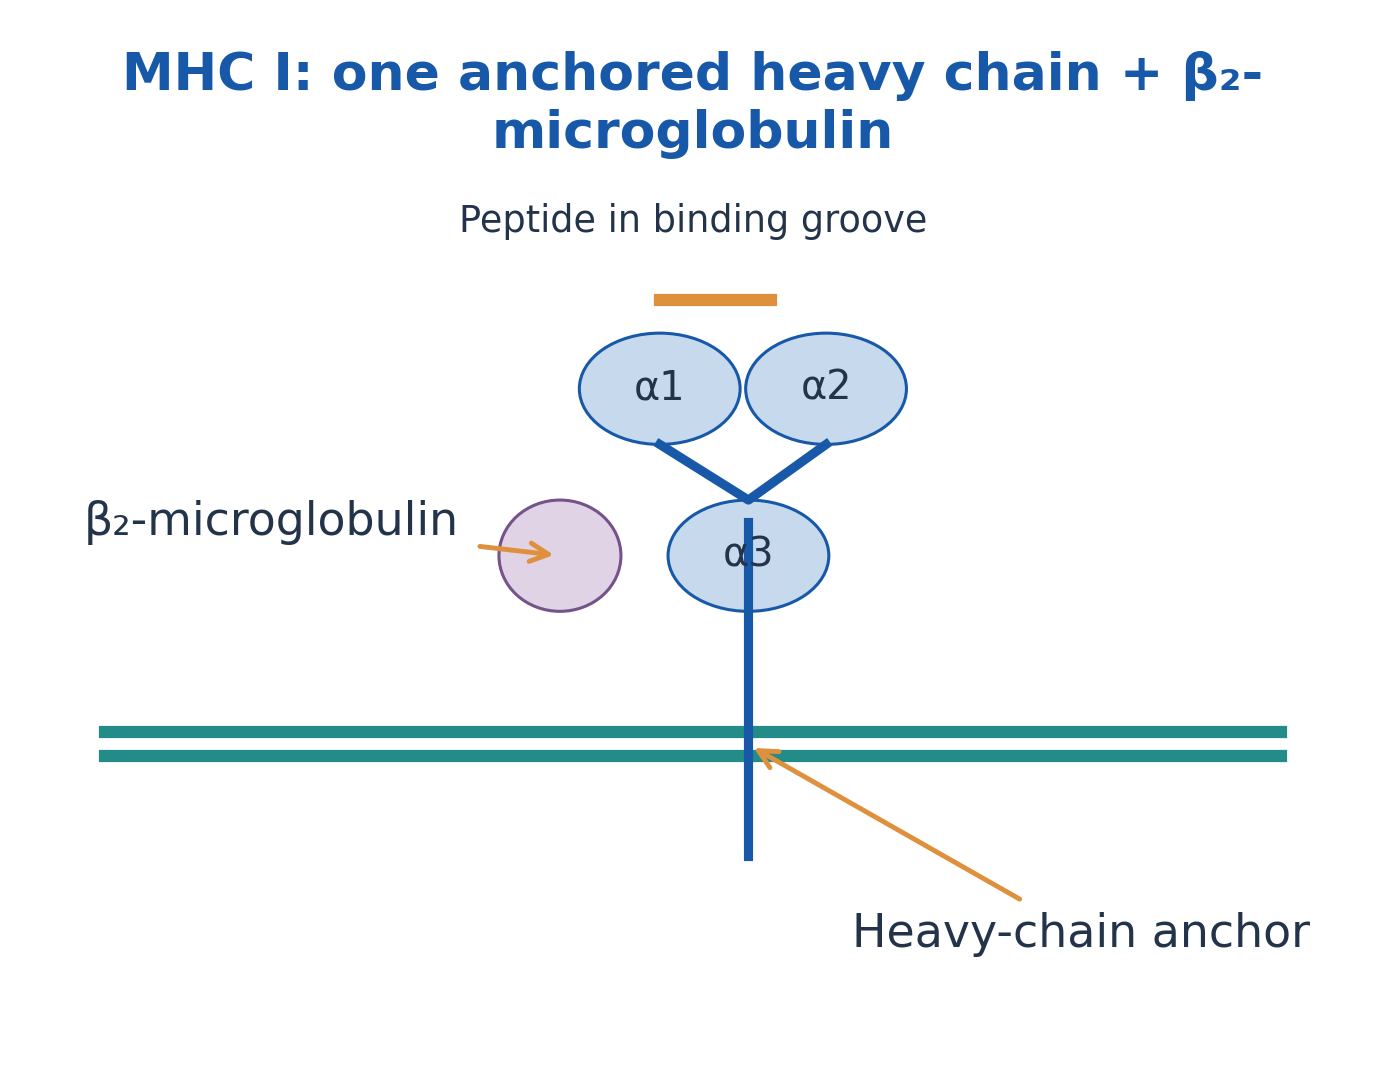
Figure explanation: MHC I contains an anchored heavy chain with α1, α2 and α3 domains plus associated β2-microglobulin. The peptide-binding groove lies between α1 and α2; only the heavy chain spans the membrane.
23. MHC class II: structure and cellular distribution
A conventional class II molecule has an α chain and a β chain, both membrane-spanning. The α1 and β1 domains form its peptide-binding groove, while α2 and β2 are membrane-proximal domains. This differs from the class I heavy-chain plus β2-microglobulin arrangement.
Class II is characteristically expressed by professional antigen-presenting cells such as dendritic cells, macrophages and B cells, with inducible expression in additional settings. It presents peptides to conventional CD4 T cells. Its open-ended groove allows longer peptides, often about 13-25 residues with a bound core. These lengths are useful typical ranges, not absolute rules for every allele and peptide.
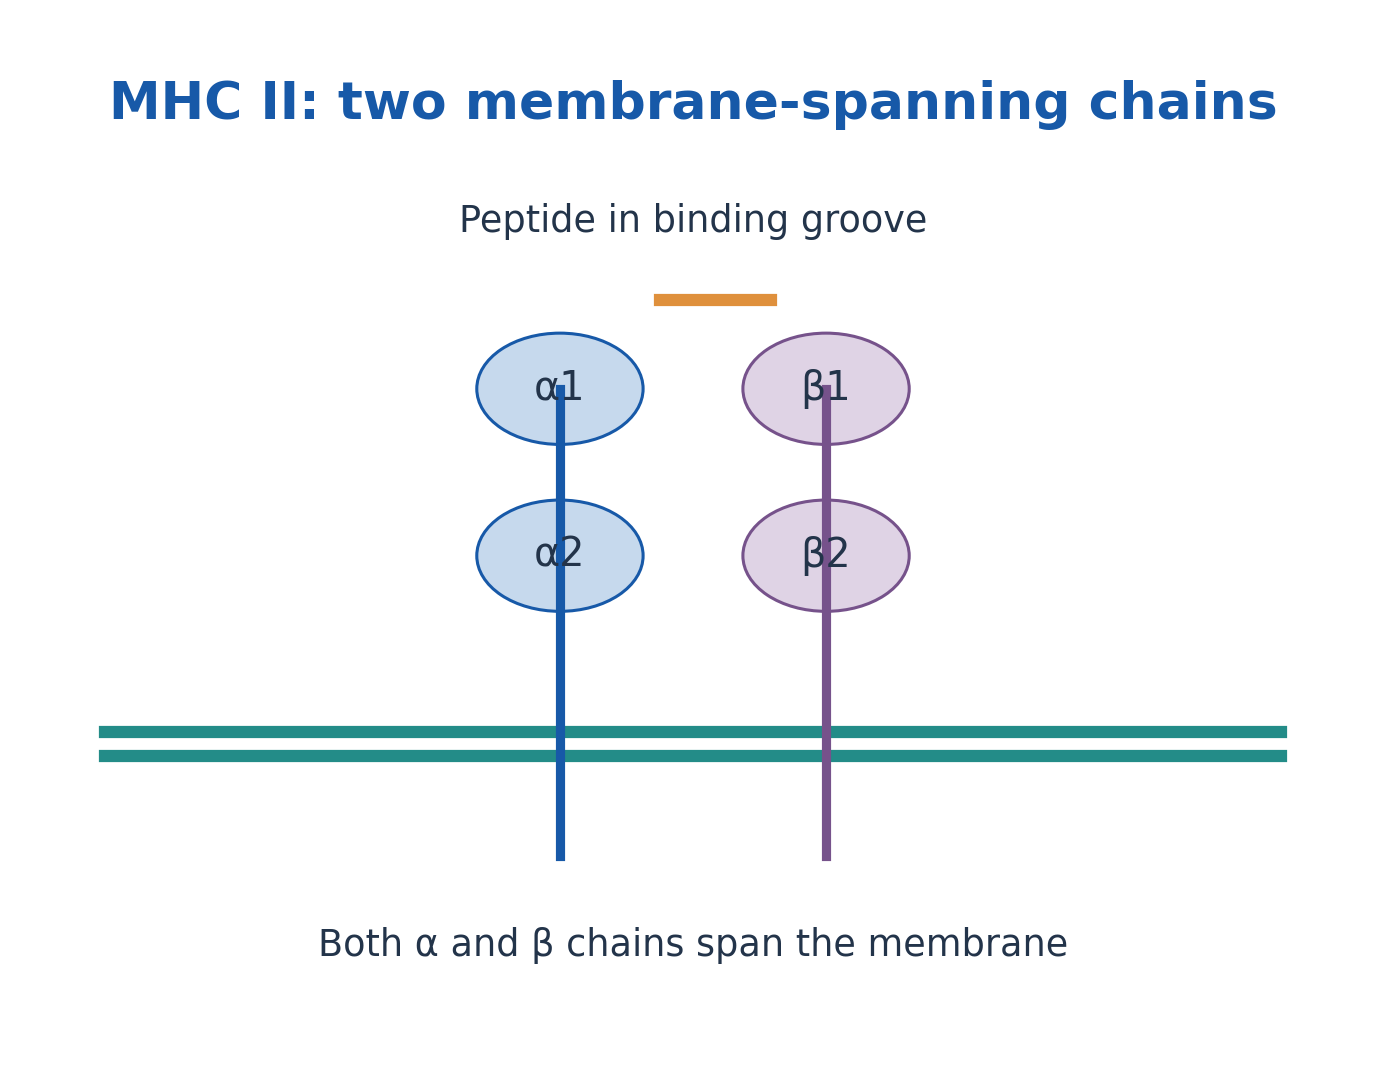
Figure explanation: MHC II contains α and β chains, both spanning the membrane. The α1 and β1 domains form the peptide-binding groove.
| Feature | MHC class I | MHC class II |
|---|---|---|
| Chains | α heavy chain + β2-microglobulin | α and β chains |
| Membrane anchors | Heavy chain only | Both chains |
| Groove | α1/α2; relatively closed ends | α1/β1; open ends |
| Usual T-cell partner | CD8 | CD4 |
| Common displayed source | Intracellular proteins | Uptake-derived proteins |
24. Endogenous processing and the class I pathway
In the conventional endogenous route, intracellular proteins are degraded into peptides through proteasome-associated processing. Suitable peptides reach the endoplasmic reticulum through TAP-associated transport. Class I heavy chain, β2-microglobulin and supporting loading machinery help assemble stable peptide-MHC complexes.
The loaded complexes travel through the secretory pathway to the surface, where appropriate CD8 T cells can recognise them. Both normal self proteins and abnormal or infection-associated proteins can contribute peptides. This route explains a major pathway, not every exception to peptide generation. A displayed peptide does not automatically prime a naïve T cell without suitable activation context.

Figure explanation: The conventional class I sequence is intracellular protein → proteasome → TAP/ER loading → surface peptide–MHC I. Loaded complexes pass through the secretory pathway.
25. Exogenous processing and the class II pathway
In the conventional exogenous route, antigen enters an endosomal/phagolysosomal system and is proteolytically processed. Class II molecules are assembled in the ER with invariant chain, which helps prevent premature groove loading and directs trafficking toward appropriate compartments.
Processing of invariant chain leaves CLIP in the groove; HLA-DM supports exchange and loading of suitable antigenic peptides. The peptide-class II complex reaches the surface for conventional CD4 recognition. This pathway does not mean that the intact swallowed organism is displayed whole in the groove. Antigen uptake, peptide production, loading and T-cell activation are separate events, each with its own biological requirements.

Figure explanation: The conventional class II sequence is uptake → endosomal processing → peptide loading after CLIP exchange with HLA-DM support → surface display for CD4 recognition.
26. Cross-presentation, exceptions and activation context
Some antigen-presenting cells can display uptake-derived material on class I: this is cross-presentation. When it supports priming of an appropriate naïve CD8 response, the outcome is cross-priming. The two terms therefore describe related but different levels of the process.
Endogenous material can also reach class II pathways through routes such as autophagy. Source and class are strongly associated in the conventional model, but not an unbreakable universal rule. TCR recognition, co-receptors, co-stimulation and cytokine context together influence response. MHC presents peptides; it does not itself synthesise the antibody that binds the original antigen.
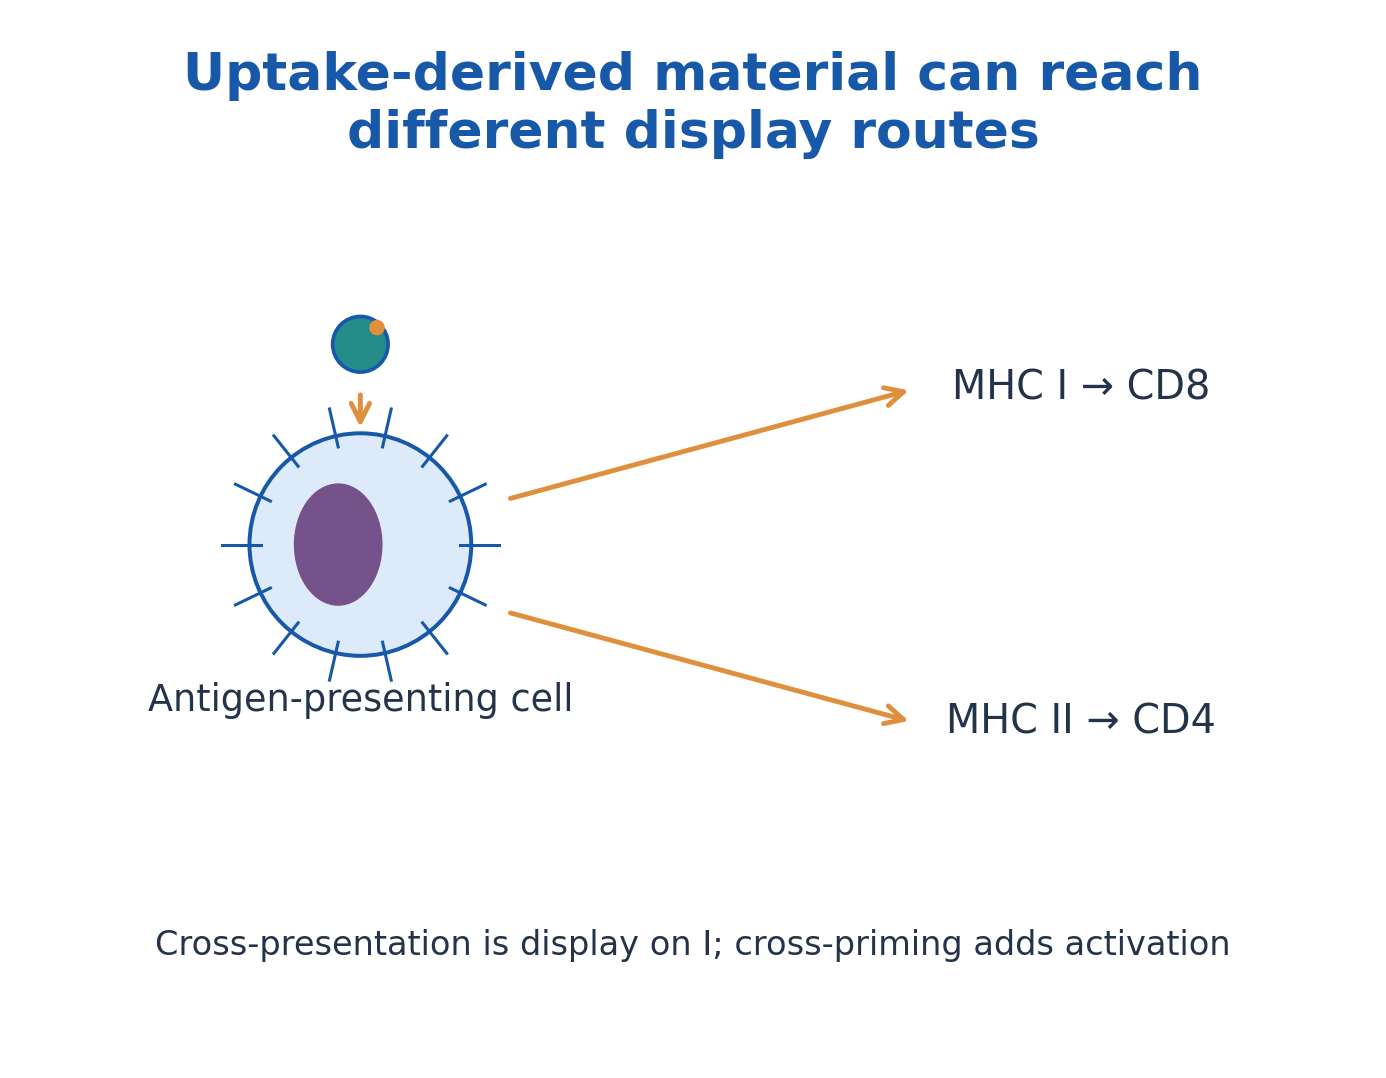
Figure explanation: Uptake-derived material can be displayed by class II to CD4 cells or cross-presented by class I to CD8 cells. Cross-presentation describes display; cross-priming additionally requires activation.
27. Complement overview: three routes to shared effectors
Complement is a regulated network of soluble and surface-associated proteins. The classical, lectin and alternative pathways use different initiation mechanisms but converge on C3 activation. Antibody-associated activation connects innate complement functions with adaptive recognition, yet not every pathway requires antibody.
In the familiar classical model, C1 engages appropriately arranged antibody-containing complexes. Lectin recognition, including mannose-binding lectin/ficolin-associated systems, uses associated proteases. Alternative-pathway activation and amplification depend on C3 chemistry and suitable surfaces. The cascade is not simply nine proteins acting once each in numerical order. Recognition, enzymatic amplification and terminal assembly are distinct stages.
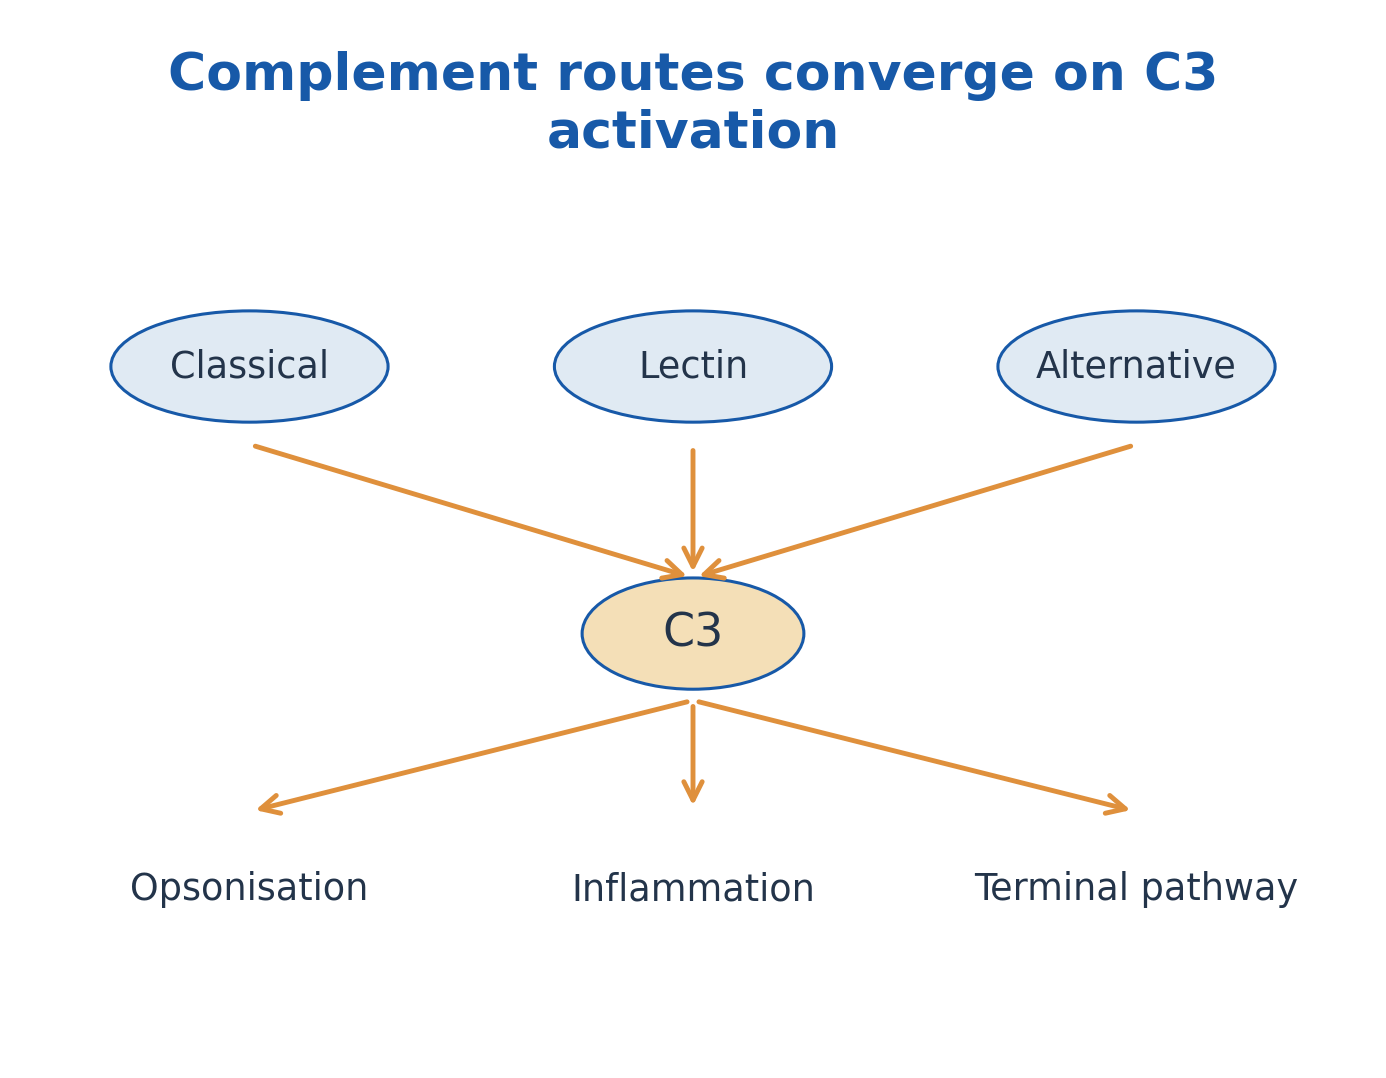
Figure explanation: Classical, lectin and alternative routes converge on C3 activation. Shared downstream outcomes include opsonisation, inflammation and terminal-pathway activity.
28. C3 and C5 convertases: amplification and branching
Using conventional textbook notation, classical/lectin activation produces C4b2a as a C3 convertase. The alternative-pathway C3 convertase is C3bBb, with properdin able to stabilise appropriate complexes. C3 cleavage generates C3a and C3b, opening different effector routes.
Additional C3b association supports C5-convertase activity, commonly represented as C4b2a3b or C3bBb3b. C5 cleavage produces C5a and C5b. These names are teaching shorthand for regulated molecular complexes; some literature uses a different C2-fragment naming convention. The essential relationships are convergence on C3, amplification, and the C5 branch toward strong inflammatory signalling and terminal assembly.
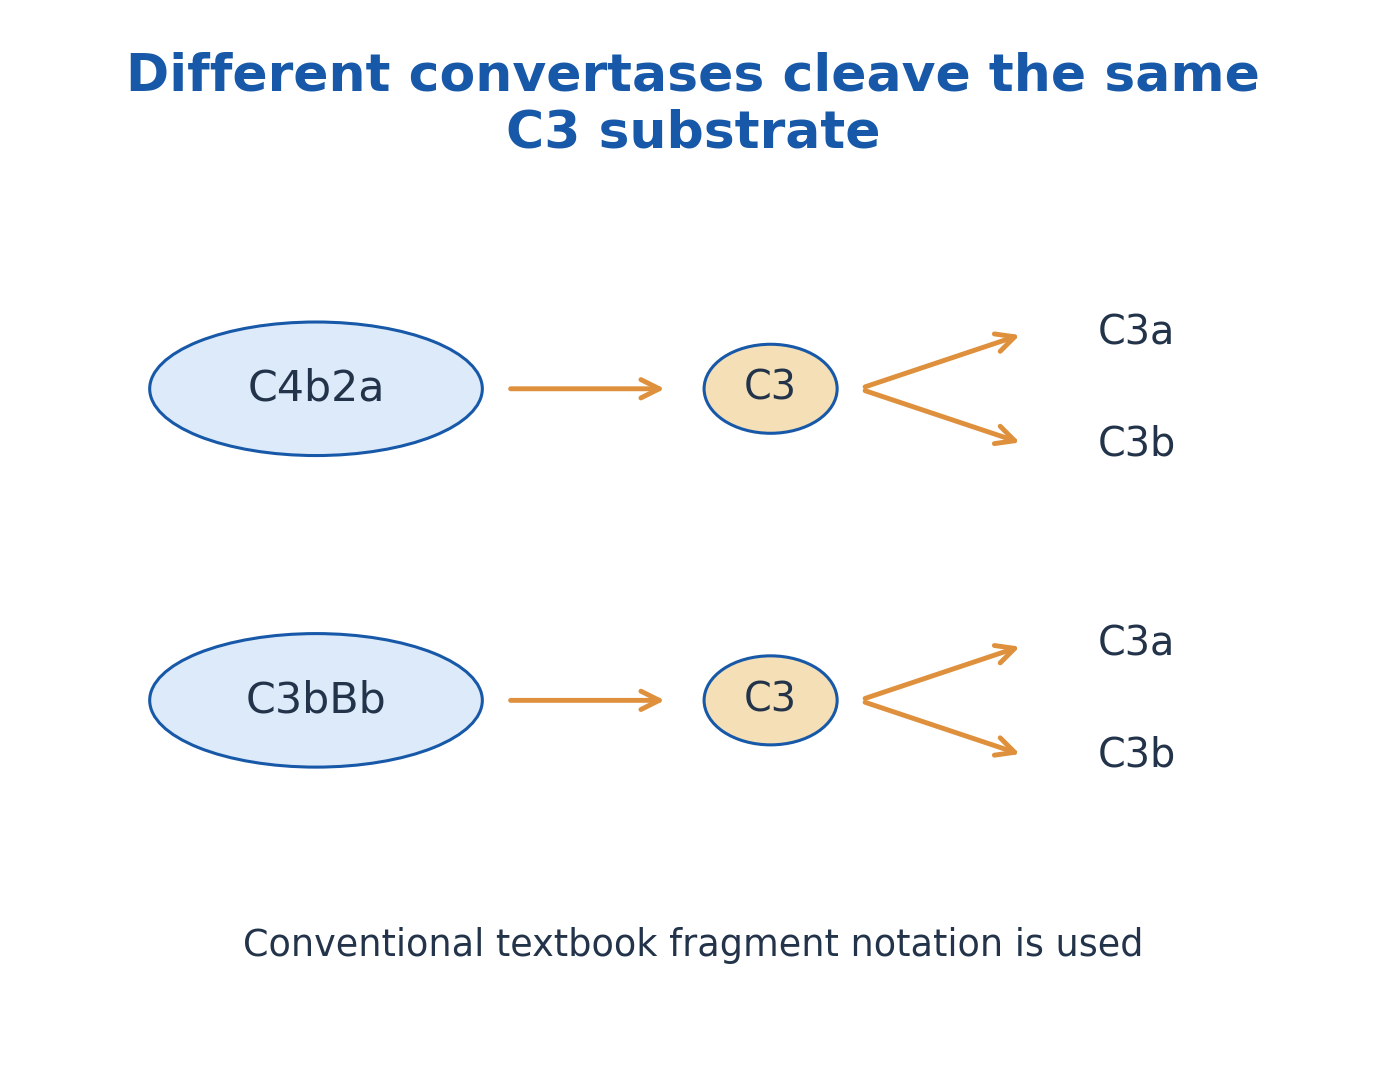
Figure explanation: Conventional textbook convertases C4b2a and C3bBb cleave C3 to C3a and C3b. Different initiating pathways therefore amplify the same central substrate.
29. Complement functions and the membrane attack complex
C3b-related deposition supports opsonisation and contributes to immune-complex handling. C3a and C5a participate in inflammatory signalling; C5a is a particularly important recruitment and activation signal. These fragments do not all perform the same task.
C5b initiates assembly with C6, C7, C8 and multiple C9 molecules to form the terminal membrane attack complex, commonly called C5b-9. It can damage susceptible membranes, notably selected Gram-negative targets. It does not universally lyse every bacterium or every infected host cell. Thick cell walls and other protective mechanisms affect susceptibility. Terminal assembly is different from an antibody physically drilling a hole by itself.
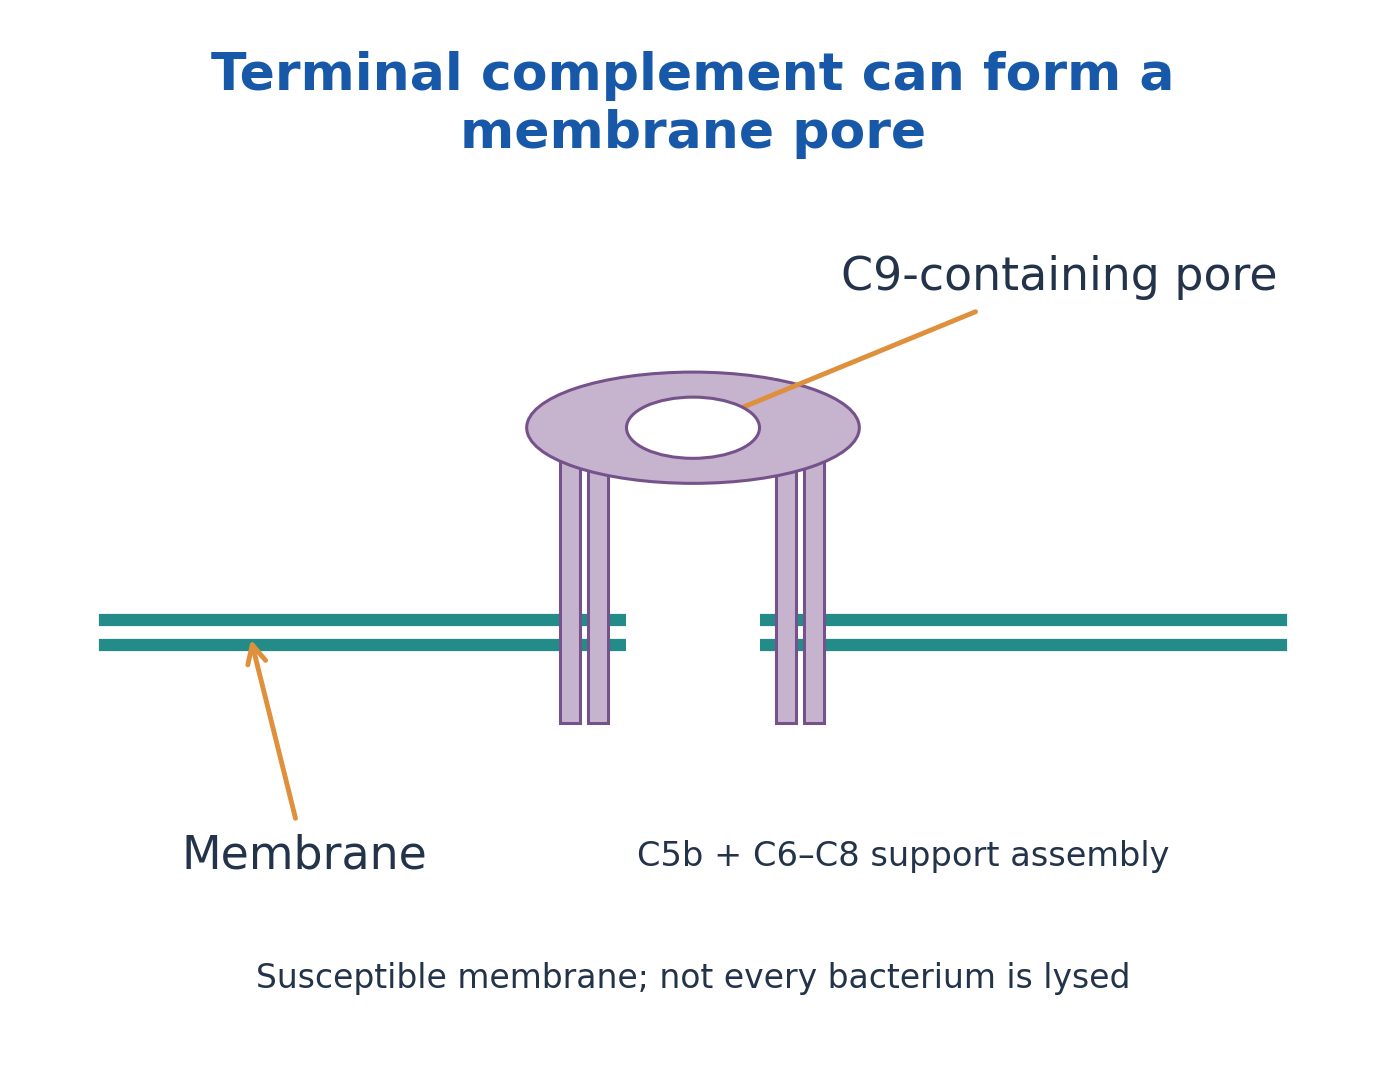
Figure explanation: C5b and C6–C8 support assembly of a C9-containing membrane pore. Terminal complement can injure susceptible membranes, but does not lyse every bacterium equally.

Figure explanation: The colourised SEM shows a neutrophil-bacterium interaction. Complement-mediated coating or receptor engagement is not directly resolved in this photograph.
30. Complement regulation and the fixation-test principle
Host protection requires control of complement activation. Soluble and membrane-associated regulators limit initiation, accelerate convertase decay, support fragment inactivation or restrict terminal assembly. Examples include C1 inhibitor, factors H/I, CD46, CD55 and CD59, with different roles rather than one interchangeable “off switch”.
In the classical complement-fixation assay concept, an appropriate antigen-antibody reaction consumes available complement. An indicator system then asks whether active complement remains to lyse sensitised red cells. Thus no indicator haemolysis can indicate a positive fixation reaction, while haemolysis can indicate unconsumed complement. Interpretation requires controls because an independently inactive complement preparation could otherwise mimic consumption.
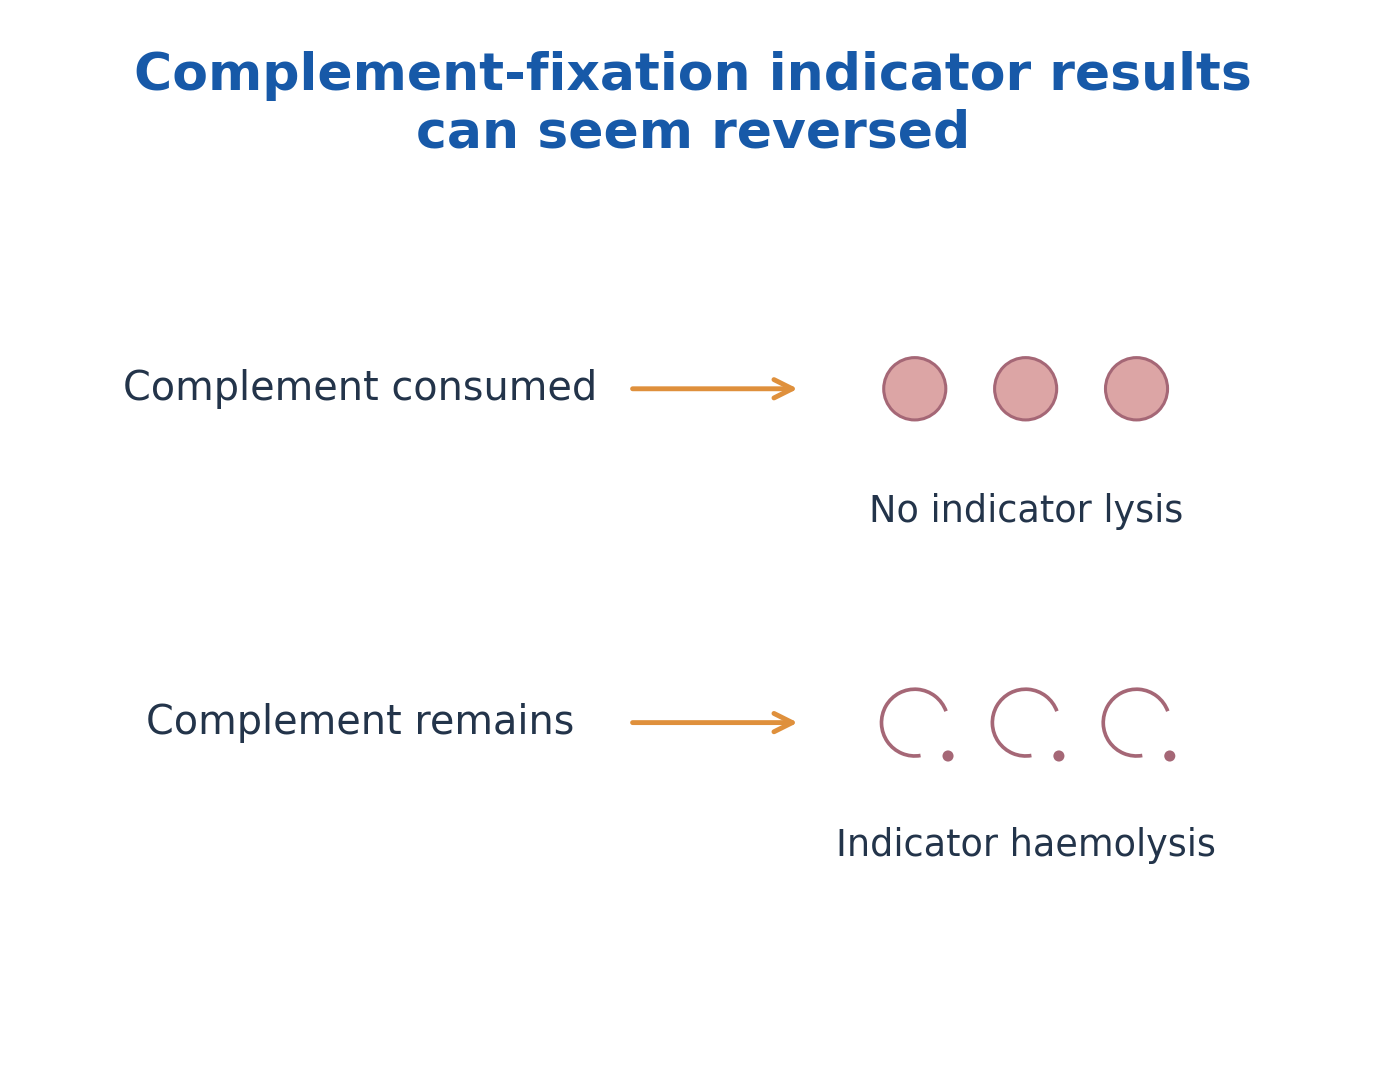
Figure explanation: In the complement-fixation indicator system, consumed complement gives no indicator lysis, while remaining complement permits indicator haemolysis. The apparent signal direction is therefore reversed relative to a simple more-signal/more-target assumption.
31. Cytokines and chemokines: communication by context
Cytokines are signalling proteins that alter the behaviour of cells with suitable receptors. They can act on the producing cell (autocrine), nearby cells (paracrine), or at a distance through systemic distribution (endocrine-like action). Chemokines are a migration-associated subset of signalling molecules.
A cytokine can affect several cell types (pleiotropy); different cytokines can overlap in function (redundancy), reinforce one another (synergy), or oppose an effect (antagonism). Receptor expression and timing matter. A cytokine is not an antigen-specific antibody, and a single measured concentration does not reveal every responding cell or biological effect.
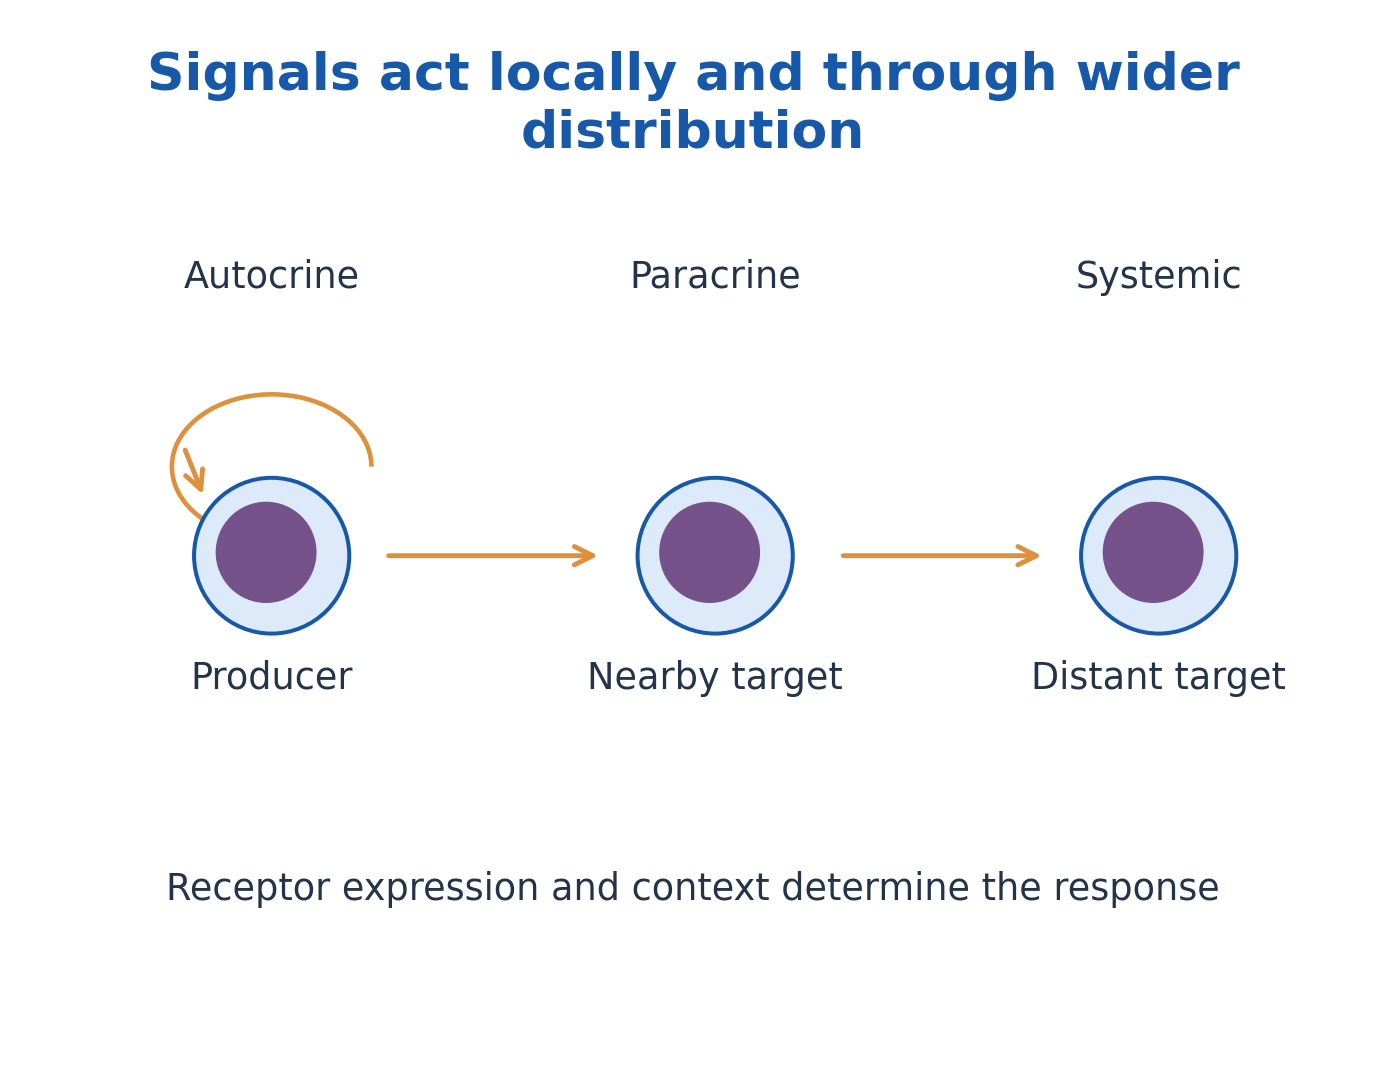
Figure explanation: Autocrine signalling acts back on the producer, paracrine signalling on nearby cells, and wider distribution can reach distant targets. Receptor expression and context determine the response.
32. Cytokine examples, networks and balanced responses
IL-1, IL-6 and TNF participate in many inflammatory networks; their effects are context-dependent. IL-2 supports important lymphocyte responses. Type I interferons promote antiviral cellular states, while IFN-γ supports selected cellular activation pathways, including macrophage-associated functions. IL-10 and TGF-β contribute to regulation in appropriate settings.
Chemokine gradients help organise migration and tissue positioning. Multiple cell populations can produce a given mediator; a cytokine should not be assigned to exactly one source cell in all circumstances. Excessive or poorly located signalling can injure tissues, while insufficient signalling can impair defence. The overview explains communication, not a universal treatment algorithm or a single numerical definition of immune protection.
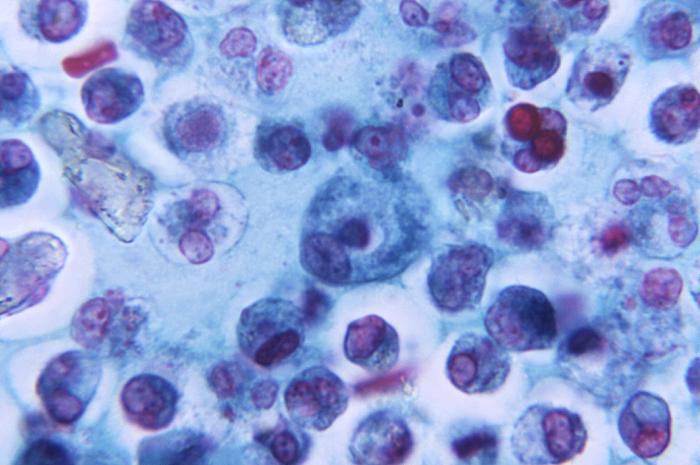
Figure explanation: The macrophage photomicrograph illustrates cells that can produce and respond to cytokines. The signalling molecules themselves are not visible.
33. Central tolerance: selection during lymphocyte development
Immune tolerance is a state of controlled non-responsiveness toward particular antigens, especially important for self structures. It is not identical to globally weak immunity. Central mechanisms act during development in primary lymphoid organs.
In the thymus, strong harmful self-reactivity can lead to deletion or suitable regulatory-lineage development. In marrow-associated B-cell development, receptor editing, deletion and functional changes can reduce self-reactivity. Positive selection for useful recognition is a related developmental requirement but should not be confused with the whole definition of self tolerance. Central mechanisms are incomplete, so additional controls are required after lymphocytes enter the periphery.
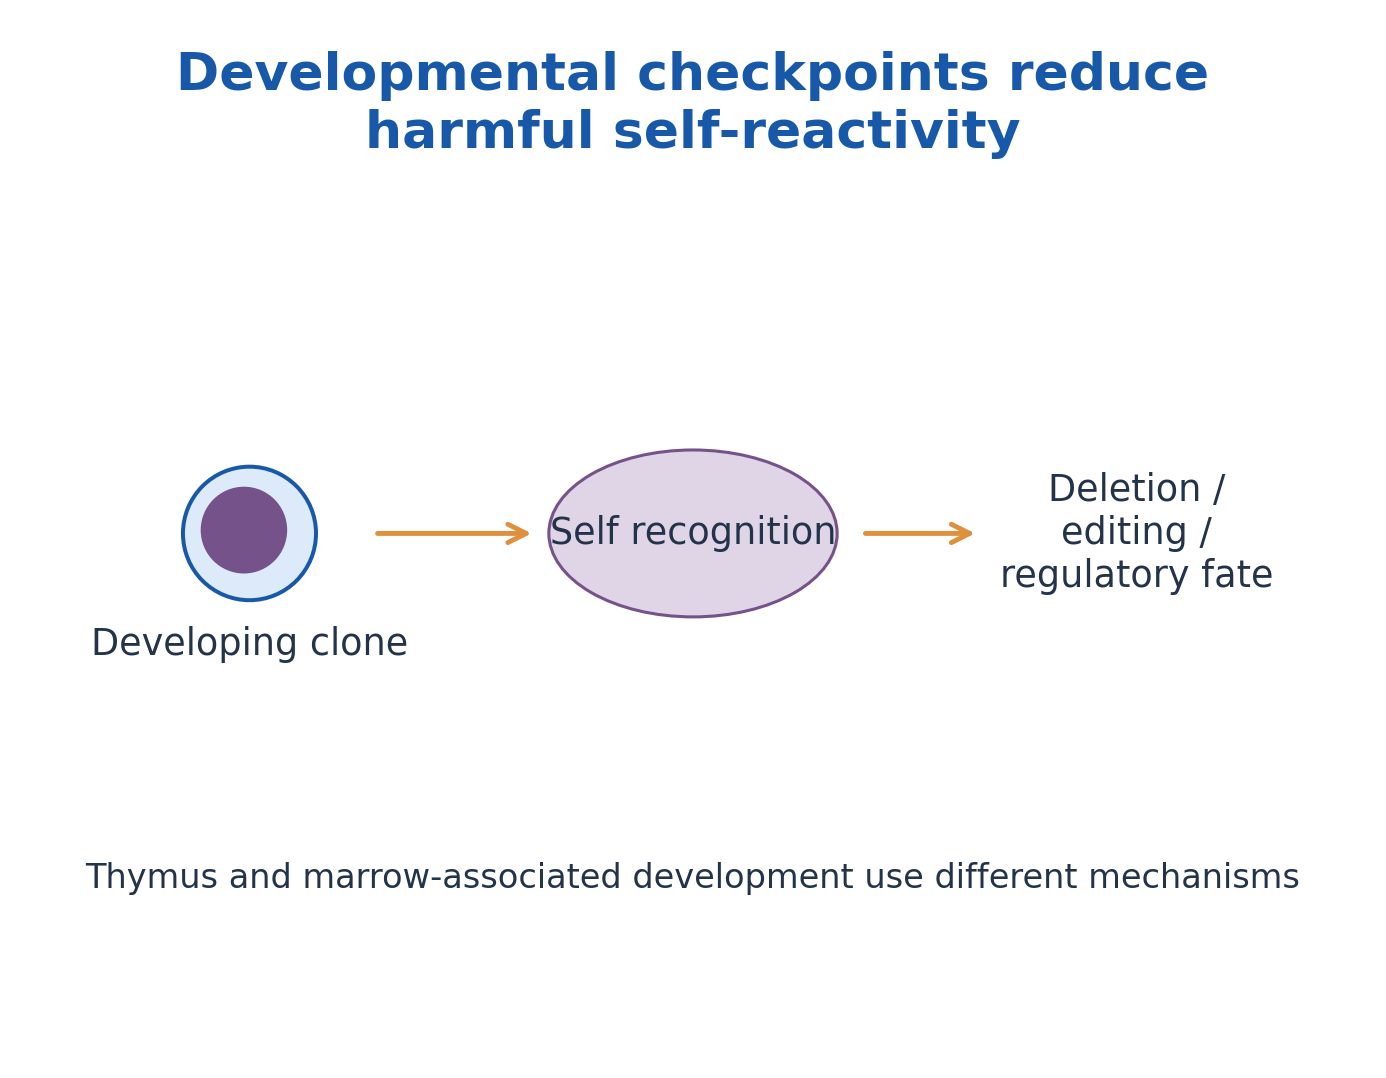
Figure explanation: Developmental self-recognition checkpoints can lead to deletion, editing or regulatory fates, depending on lineage and context. Thymic and marrow-associated development use different mechanisms.
34. Peripheral tolerance: anergy, deletion and regulation
Peripheral tolerance controls potentially harmful responses after developmental checkpoints. Antigen recognition without appropriate activation signals can support anergy, a functionally unresponsive state, rather than productive expansion. Deletion removes cells; it is not the same as keeping them alive but unresponsive.
Regulatory T cells and inhibitory signalling help restrain unsuitable responses. Antigen accessibility, tissue context and controlled handling of harmless material also influence whether activation occurs. B cells have peripheral checkpoints as well. Tolerance does not mean that every self-reactive cell is physically absent, nor that one inhibitory receptor alone explains all protection. Failure of regulation can contribute to autoimmunity, but detecting a self-reactive molecule alone is not a complete disease diagnosis.

Figure explanation: Peripheral tolerance includes anergy, deletion and regulatory suppression. An anergic cell remains alive but functionally unresponsive; deletion removes the cell.
35. Integrated interpretation: recognition does not equal response
An antibody can bind without forming a visible precipitate; an antigen can be processed without efficiently activating a naïve T cell; complement can be initiated yet constrained by regulation. These examples share a principle: an early molecular event is not proof that every later outcome has occurred.
For each question, identify the binding target, detection fraction, processing compartment, presenting molecule and effector pathway. Explain anergy versus deletion, affinity versus avidity, antigen detection versus antibody detection, and classical versus alternative complement initiation. The worked questions and quick-reference table connect those distinctions without replacing the stated assay controls or biological context.
WORKED QUESTIONS: ASSAYS AND IMMUNE MECHANISMS
The questions apply the stated teaching models. Identify the relevant cell, molecule and context before interpreting an observation; these examples are not stand-alone clinical diagnoses.
Worked problem 4.1: Affinity from a dissociation constant
Question: In a one-site equilibrium model, Kd=2 × 10^-9 M. Find Ka and compare with a reagent whose Kd is 8 × 10^-9 M.
Step 1: Ka=1/Kd for the stated reciprocal definitions.
Step 2: Ka=1/(2 × 10^-9)=5 × 10^8 M^-1.
Step 3: The first reagent has the smaller Kd and therefore stronger equilibrium binding in this comparison.
Answer: Ka=5 × 10^8 M^-1; the first reagent has higher affinity.
Check: Affinity at one site does not fully specify avidity or assay performance.
Worked problem 4.2: An invisible precipitate
Question: At fixed antigen, excessive antibody gives little visible precipitate. Can this establish absence of antigen?
Step 1: Antibody excess is the prozone region of the classical precipitation model.
Step 2: Binding can occur without producing an extended insoluble lattice.
Step 3: A validated dilution series and controls can clarify the reaction zone.
Answer: No. Weak visibility in antibody excess does not prove antigen absence.
Check: Antigen excess is the postzone; do not interchange the two.
Worked problem 4.3: Radial diffusion calibration
Question: In a validated endpoint calibration, D²=16 mm² at 2 mg/L and 36 mm² at 6 mg/L. An unknown has D²=25 mm². Use linear interpolation.
Step 1: Concentration interval=6-2=4 mg/L; squared-diameter interval=36-16=20 mm².
Step 2: Fraction of interval=(25-16)/20=0.45.
Step 3: Unknown=2+(0.45 × 4)=3.8 mg/L.
Answer: The interpolated concentration is 3.8 mg/L.
Check: Interpolate squared diameter, not diameter; the stated endpoint calibration is essential.
Worked problem 4.4: Endpoint titre
Question: Serial dilutions are positive through 1:160 and negative at 1:320. Report the endpoint titre.
Step 1: The endpoint is the highest dilution meeting the defined positive criterion.
Step 2: The reciprocal of 1:160 is 160.
Step 3: A titre is not automatically an antibody mass concentration.
Answer: Endpoint titre=160, under the stated test criterion.
Check: A changed assay or positivity threshold can change the reported endpoint.
Worked problem 4.5: ELISA interpolation and dilution
Question: A defined linear range gives absorbance 0.20 at 10 ng/mL and 0.80 at 40 ng/mL. A fivefold-diluted specimen reads 0.50. Find its original concentration.
Step 1: Interval fraction=(0.50-0.20)/(0.80-0.20)=0.5.
Step 2: Diluted concentration=10+0.5 × (40-10)=25 ng/mL.
Step 3: Original concentration=25 × 5=125 ng/mL.
Answer: 125 ng/mL in the original specimen.
Check: Use the stated linear range; a saturated signal cannot be reliably extrapolated this way.
Worked problem 4.6: Traditional RIA and bound tracer
Question: Total bound counts are 5000 for the zero-unlabelled-antigen reference and 2000 for the sample. Background is 200 counts for each. Find background-corrected B/B0.
Step 1: B=2000-200=1800 counts. B0=5000-200=4800 counts.
Step 2: B/B0=1800/4800=0.375=37.5%.
Step 3: In this competitive bound-fraction assay, greater unlabelled antigen tends to reduce bound tracer; use standards to infer concentration.
Answer: B/B0=37.5%; concentration still requires the calibration curve.
Check: The direction applies to the defined bound fraction, not automatically to free tracer.
Worked problem 4.7: Interpreting a Western blot
Question: A target band is absent from a sample lane. Its loading control is also absent. Can absence of target protein be concluded?
Step 1: The loading control fails to support adequate sample loading or transfer in that lane.
Step 2: The negative target signal could reflect a technical failure rather than a true biological absence.
Step 3: Repeat or otherwise resolve the control failure before interpreting the target comparison.
Answer: No. The lane does not support a valid absence claim.
Check: Expected molecular mass and appropriate positive and negative controls also matter.
Worked problem 4.8: Selecting a presentation route
Question: A cytosolic protein is degraded; peptides pass through TAP into the ER. Which conventional MHC route and T-cell coreceptor fit?
Step 1: Proteasomal degradation and TAP-associated ER entry characterise the conventional endogenous route.
Step 2: Peptides load onto MHC class I, which includes an anchored heavy chain and β2-microglobulin.
Step 3: The displayed complex can be recognised by suitable CD8 T cells; recognition alone does not prove priming.
Answer: Conventional class I presentation to CD8-associated recognition.
Check: Class II instead commonly uses endosomal processing and CLIP exchange with HLA-DM support.
Worked problem 4.9: A reversed complement-fixation readout
Question: In a controlled complement-fixation test, antigen-antibody interaction consumes complement before sensitised indicator red cells are added. What happens to the indicator cells?
Step 1: The first reaction has used the available complement.
Step 2: Indicator-cell lysis requires sufficient remaining active complement.
Step 3: With complement consumed, the indicator cells remain unlysed in the positive teaching model.
Answer: No indicator haemolysis can represent a positive fixation reaction.
Check: Inactivated or otherwise deficient complement can mimic this pattern; the controls must work.
Worked problem 4.10: Tolerance or failed recognition?
Question: A mature self-reactive lymphocyte survives but is functionally unresponsive after recognition without an adequate activating context. Is this deletion?
Step 1: Deletion removes the cell; survival rules out deletion as the described outcome.
Step 2: Anergy denotes functional unresponsiveness of a surviving lymphocyte.
Step 3: This is one peripheral tolerance mechanism; regulatory suppression is a distinct mechanism.
Answer: The stated outcome is anergy, not deletion.
Check: Tolerance is selective immune restraint and is not synonymous with global immune weakness.
Quick Revision: Answers with Reasons
Why is avidity different from affinity?
Affinity concerns one binding-site interaction; avidity reflects combined multivalent binding, accessibility and geometry.
What is required for classical precipitation?
Accessible multivalent antigen and suitable antibody must form a sufficiently extensive lattice under appropriate conditions.
Are equivalence and a 1:1 molar ratio identical?
No. Functional equivalence depends on accessible determinants and valency; it need not mean equal numbers of molecules.
Where does a partial-identity spur point?
Toward the antigen preparation lacking the additional determinants recognised by that antiserum.
What does an ELISA actually detect?
It detects a specified binding event through an enzyme-associated signal. The sample target can be antigen or antibody depending on architecture.
Why wash a solid-phase assay?
Washing reduces unbound material so that measured label more closely reflects retained complexes; incomplete washing can raise background.
Must more antigen always give more colour?
No. Competitive formats can give an inverse response, and very high antigen may interfere with some sandwich assays.
How is traditional RIA competitive?
Unlabelled antigen competes with radiolabelled antigen for limited binding sites. Bound tracer typically falls as competitor rises in the stated design.
What are the three basic Western-blot stages?
Separate proteins, transfer them to a membrane, and detect recognised targets with appropriate reagents and controls.
Does a band prove clinical disease?
No. Its meaning depends on reagent specificity, controls, sample context and a validated interpretation scheme.
Which chains anchor MHC I and II?
Class I has one membrane-spanning heavy chain with noncovalently associated β2-microglobulin. Both α and β chains of class II span the membrane.
What do TAP and HLA-DM do?
TAP supports peptide transport into the ER for conventional class I loading. HLA-DM supports CLIP release and peptide exchange for class II.
Is cross-presentation the same as cross-priming?
No. Cross-presentation displays uptake-derived antigen on class I; cross-priming additionally activates a suitable naïve CD8 T-cell response.
Where do complement pathways converge?
Their initiating routes generate C3-cleaving activity, followed by shared effector branches and potential terminal-pathway assembly.
How do C3a and C3b differ?
C3a contributes to inflammatory signalling; deposited C3b supports opsonisation and convertase-related functions.
What forms the membrane attack complex?
C5b recruits C6, C7 and C8, followed by C9-containing pore assembly on susceptible target membranes.
Why can a positive fixation test show no haemolysis?
Complement consumed in the initial immune reaction is unavailable to lyse the sensitised indicator red cells.
What makes a cytokine response context-dependent?
Receptor expression, cellular state, concentration, timing and other signals determine the target response.
Does one cytokine have only one function?
No. Pleiotropy means one cytokine can have several effects; redundancy means different cytokines can share an effect.
How do central and peripheral tolerance differ?
Central mechanisms operate during lymphocyte development; peripheral mechanisms restrain potentially harmful cells that reach later compartments.
Quick Reference: Mechanisms and Relations
| Concept | Meaning / relation |
|---|---|
| Equilibrium | Ka=1/Kd for reciprocal one-site definitions; lower Kd indicates stronger affinity. |
| Titre | Reciprocal of the highest dilution meeting the stated endpoint. |
| Dilution | Original concentration=measured diluted concentration × dilution factor. |
| RIA ratio | B/B0=(sample bound-background)/(reference bound-background). |
| Sensitivity | TP/(TP+FN); proportion of truly positive samples detected. |
| Specificity | TN/(TN+FP); proportion of truly negative samples excluded. |
| Predictive value | PPV=TP/(TP+FP); interpretation depends on the tested population. |
| Class I route | Cytosol → proteasome → TAP/ER → MHC I → CD8 recognition. |
| Class II route | Uptake → endosomal processing → CLIP exchange → MHC II → CD4 recognition. |
| C3 convertases | C4b2a (classical/lectin) and C3bBb (alternative), using conventional textbook notation. |
| Complement outputs | C3b: opsonisation; C3a/C5a: inflammation; C5b-9: terminal complex. |
| Tolerance | Central: developmental checkpoints. Peripheral: anergy, deletion and regulation. |